

SNX10 and PTGDS are associated with the progression and prognosis of cervical squamous cell carcinoma
- PMID: 34116656
- PMCID: PMC8196508
- DOI: 10.1186/s12885-021-08212-w
SNX10 and PTGDS are associated with the progression and prognosis of cervical squamous cell carcinoma
Abstract
Background: Cervical cancer (CC) is the primary cause of death in women. This study sought to investigate the potential mechanism and prognostic genes of CC.
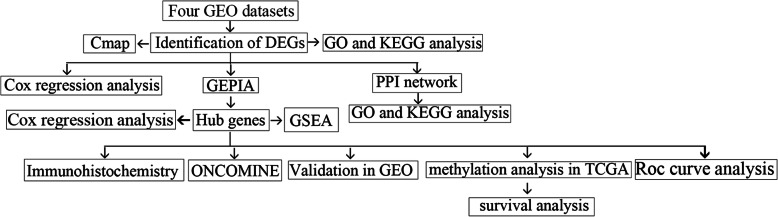
Methods: We downloaded four gene expression profiles from GEO. The RRA method was used to integrate and screen differentially expressed genes (DEGs) between CC and normal samples. Functional analysis was performed by clusterprofiler. We built PPI network by Search Tool for the Retrieval of Interacting Genes Database (STRING) and selected hub modules via Molecular COmplex Detection (MCODE). CMap database was used to find molecules with therapeutic potential for CC. The hub genes were validated in GEO datasets, Gene Expession Profiling Interactive Analysis (GEPIA), immunohistochemistry, Cox regression analysis, TCGA methylation analysis and ONCOMINE were carried out. ROC curve analysis and GSEA were also performed to describe the prognostic significance of hub genes.
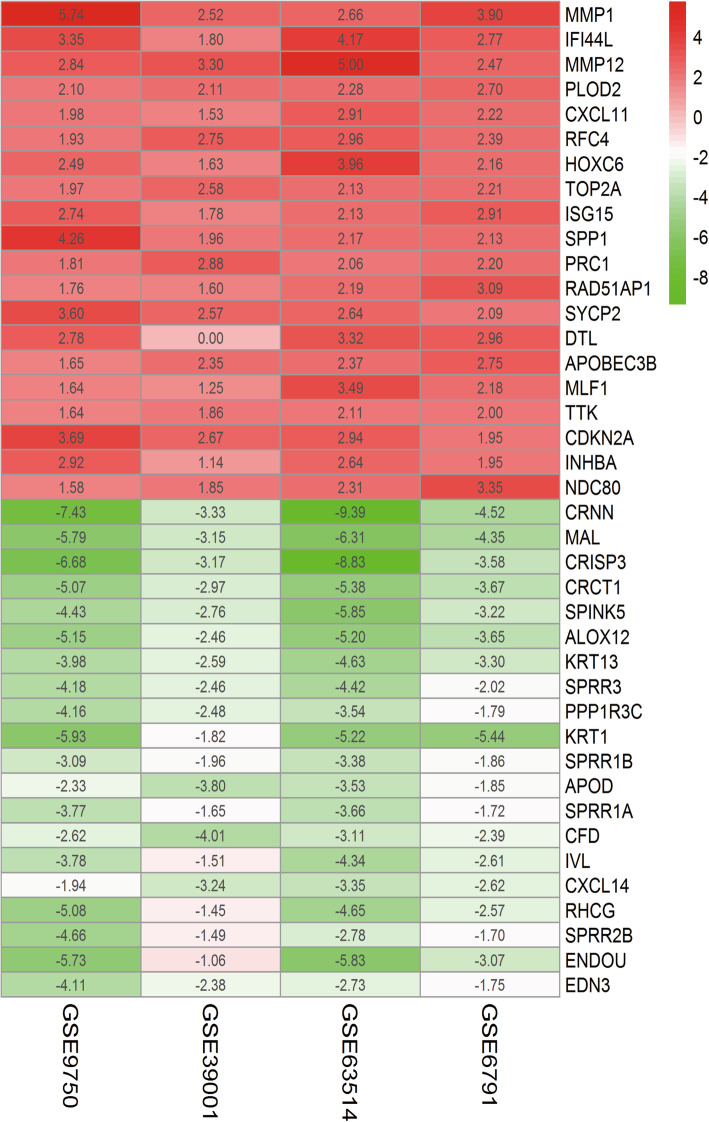
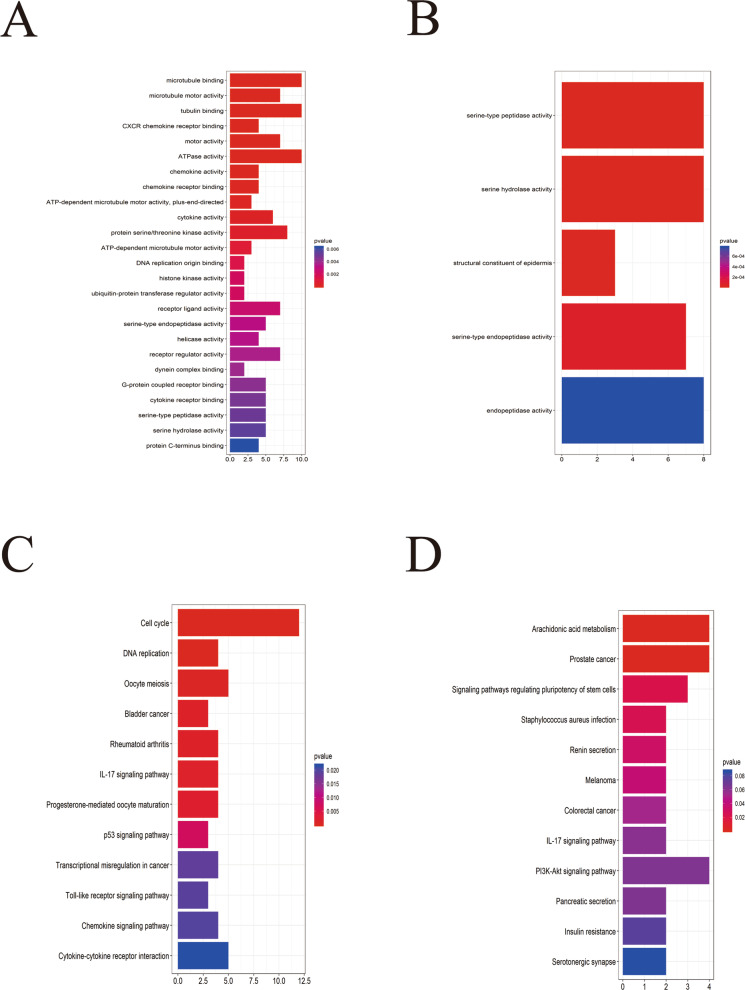
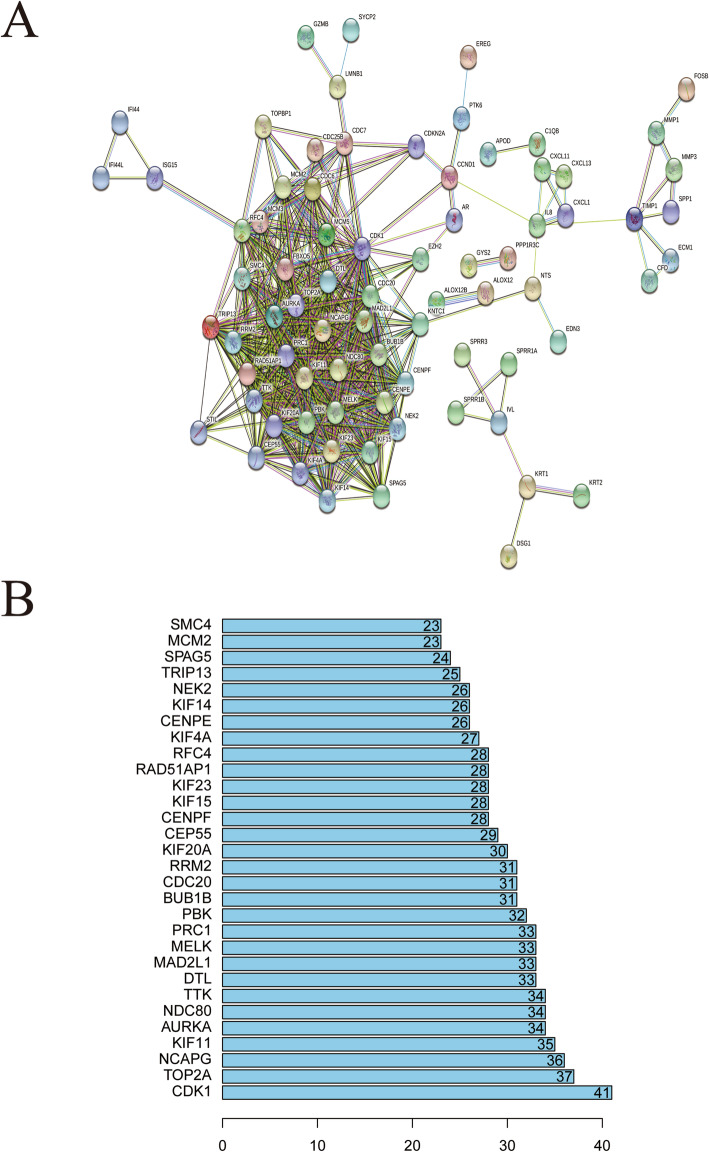
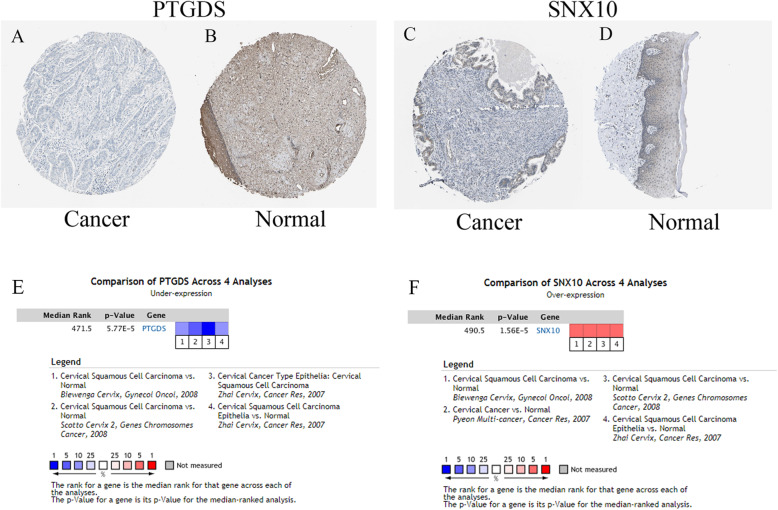
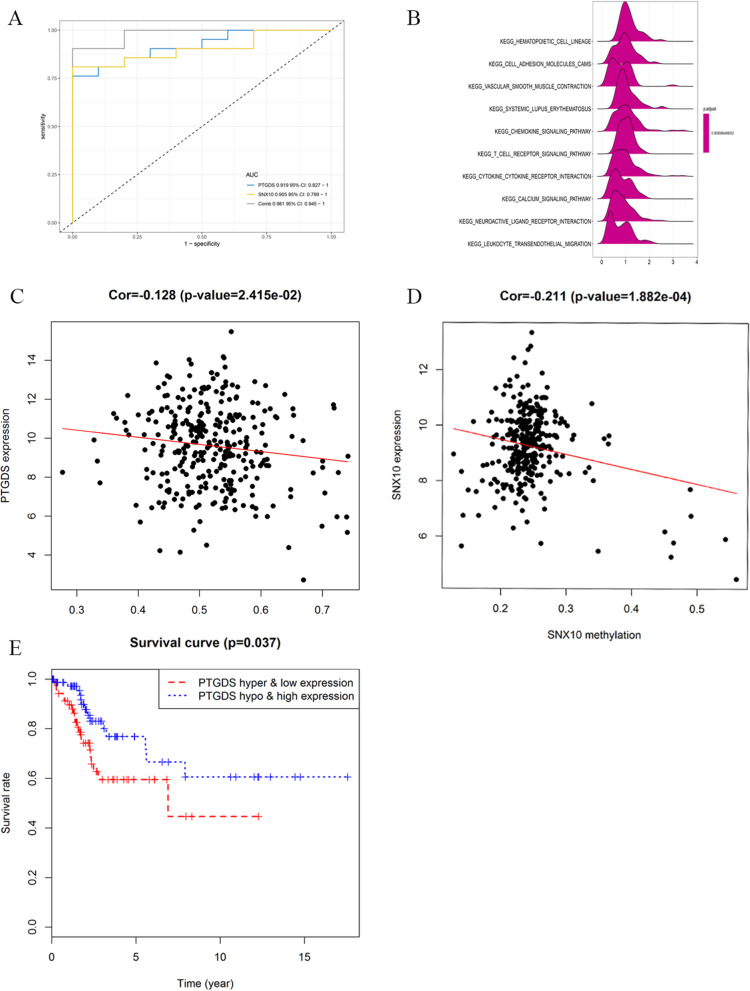
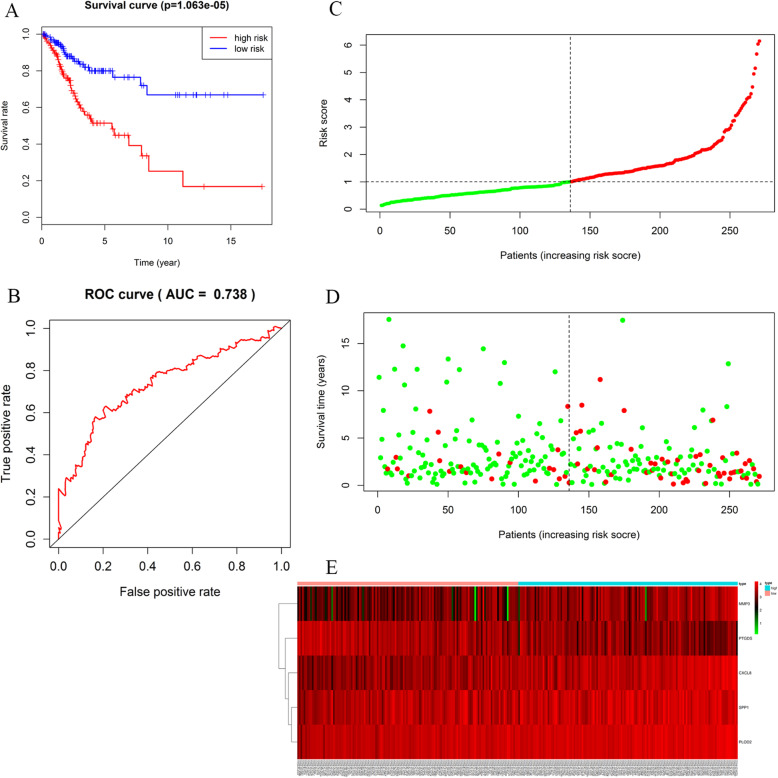
Results: Functional analysis revealed that 147 DEGs were significantly enriched in binding, cell proliferation, transcriptional activity and cell cycle regulation. PPI network screened 30 hub genes, with CDK1 having the strongest connectivity with CC. Cmap showed that apigenin, thioguanine and trichostatin A might be used to treat CC(P < 0.05). Eight genes (APOD, CXCL8, MMP1, MMP3, PLOD2, PTGDS, SNX10 and SPP1) were screened out through GEPIA. Of them, only PTGDS and SNX10 had not appeared in previous studies about CC. The validation in GEO showed that PTGDS showed low expression while SNX10 presented high expression in tumor tissues. Their expression profiles were consistent with the results in immunohistochemistry. ROC curve analysis indicated that the model had a good diagnostic efficiency (AUC = 0.738). GSEA analysis demonstrated that the two genes were correlated with the chemokine signaling pathway (P < 0.05). TCGA methylation analysis showed that patients with lowly-expressed and highly-methylated PTGDS had a worse prognosis than those with highly-expressed and lowly-methylated PTGDS (p = 0.037). Cox regression analysis showed that SNX10 and PTGDS were independent prognostic indicators for OS among CC patients (P = 0.007 and 0.003).
Conclusions: PTGDS and SNX10 showed abnormal expression and methylation in CC. Both genes might have high prognostic value of CC patients.
Keywords: Cervical squamous cell carcinoma; Methylation; PTGDS; Prognosis; Risk model; SNX10.
Conflict of interest statement
The authors declare that they have no competing interests.
Figures
Similar articles
-
Co-expression network analysis identified atypical chemokine receptor 1 (ACKR1) association with lymph node metastasis and prognosis in cervical cancer.Cancer Biomark. 2020;27(2):213-223. doi: 10.3233/CBM-190533. Cancer Biomark. 2020. PMID: 32083574
-
Identification of crucial aberrantly methylated and differentially expressed genes related to cervical cancer using an integrated bioinformatics analysis.Biosci Rep. 2020 May 29;40(5):BSR20194365. doi: 10.1042/BSR20194365. Biosci Rep. 2020. PMID: 32368784 Free PMC article.
-
Inhibiting SNX10 induces autophagy to suppress invasion and EMT and inhibits the PI3K/AKT pathway in cervical cancer.Clin Transl Oncol. 2025 May;27(5):2084-2094. doi: 10.1007/s12094-024-03715-x. Epub 2024 Oct 5. Clin Transl Oncol. 2025. PMID: 39367898
-
Gene expression profiles analysis identifies a novel two-gene signature to predict overall survival in diffuse large B-cell lymphoma.Biosci Rep. 2019 Jan 3;39(1):BSR20181293. doi: 10.1042/BSR20181293. Print 2019 Jan 31. Biosci Rep. 2019. PMID: 30393234 Free PMC article.
-
Identification of molecular markers associated with the progression and prognosis of endometrial cancer: a bioinformatic study.Cancer Cell Int. 2020 Feb 19;20:59. doi: 10.1186/s12935-020-1140-3. eCollection 2020. Cancer Cell Int. 2020. PMID: 32099532 Free PMC article.
Cited by
-
Single-cell RNA combined with bulk RNA analysis to explore oxidative stress and energy metabolism factors and found a new prostate cancer oncogene MXRA8.Aging (Albany NY). 2024 Mar 4;16(5):4469-4502. doi: 10.18632/aging.205599. Epub 2024 Mar 4. Aging (Albany NY). 2024. PMID: 38441550 Free PMC article.
-
SRPX2 promotes cancer cell proliferation and migration of papillary thyroid cancer.Clin Exp Med. 2023 Dec;23(8):4825-4834. doi: 10.1007/s10238-023-01113-1. Epub 2023 Jun 12. Clin Exp Med. 2023. PMID: 37306872 Free PMC article.
-
Unveiling SNX10: a key player in bladder cancer progression.Transl Androl Urol. 2025 Jul 30;14(7):1912-1924. doi: 10.21037/tau-2025-169. Epub 2025 Jul 28. Transl Androl Urol. 2025. PMID: 40800094 Free PMC article.
-
The tertiary lymphoid structure-related signature identified PTGDS in regulating PD-L1 and promoting the proliferation and migration of glioblastoma.Heliyon. 2023 Dec 18;10(1):e23915. doi: 10.1016/j.heliyon.2023.e23915. eCollection 2024 Jan 15. Heliyon. 2023. PMID: 38205335 Free PMC article.
-
Butyrate Metabolism-Related Gene Signature in Tumor Immune Microenvironment in Lung Adenocarcinoma: A Comprehensive Bioinformatics Study.Immun Inflamm Dis. 2024 Dec;12(12):e70087. doi: 10.1002/iid3.70087. Immun Inflamm Dis. 2024. PMID: 39641239 Free PMC article.
References
-
- Petryszak R, Burdett T, Fiorelli B, Fonseca NA, Gonzalez-Porta M, Hastings E, Huber W, Jupp S, Keays M, Kryvych N, McMurry J, Marioni JC, Malone J, Megy K, Rustici G, Tang AY, Taubert J, Williams E, Mannion O, Parkinson HE, Brazma A. Expression atlas update--a database of gene and transcript expression from microarray- and sequencing-based functional genomics experiments. Nucleic Acids Res. 2014;42(Database issue):D926–D932. doi: 10.1093/nar/gkt1270. - DOI - PMC - PubMed
MeSH terms
Substances
LinkOut - more resources
Full Text Sources
Medical
Research Materials
Miscellaneous
