. 2021 Jun 11;7(24):eabg3080.
doi: 10.1126/sciadv.abg3080. Print 2021 Jun.

Ice-shelf retreat drives recent Pine Island Glacier speedup

Affiliations

Ice-shelf retreat drives recent Pine Island Glacier speedup

Ian Joughin et al. Sci Adv. .

Abstract

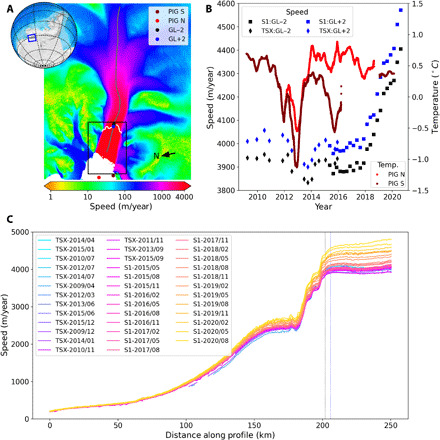
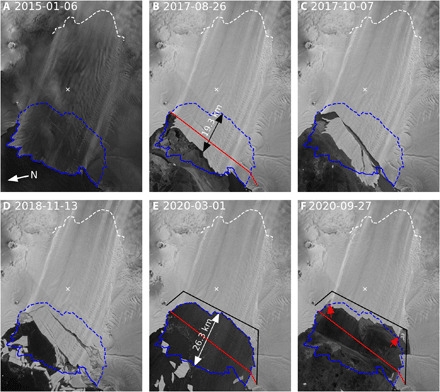
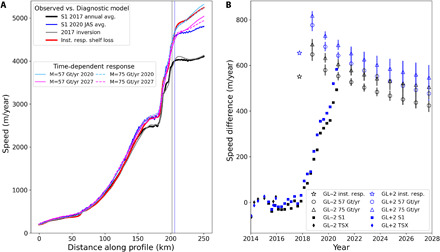
Speedup of Pine Island Glacier over the past several decades has made it Antarctica's largest contributor to sea-level rise. The past speedup is largely due to grounding-line retreat in response to ocean-induced thinning that reduced ice-shelf buttressing. While speeds remained fairly steady from 2009 to late 2017, our Copernicus Sentinel 1A/B-derived velocity data show a >12% speedup over the past 3 years, coincident with a 19-km retreat of the ice shelf. We use an ice-flow model to simulate this loss, finding that accelerated calving can explain the recent speedup, independent of the grounding-line, melt-driven processes responsible for past speedups. If the ice shelf's rapid retreat continues, it could further destabilize the glacier far sooner than would be expected due to surface- or ocean-melting processes.


Figures

Fig. 1
Fig. 1. PIG location map and changes in flow speed over the past decade.
(A) Locations of points where speed is sampled (GL−2 and GL+2), moorings were deployed (PIG N and PIG S), and centerline profile (gray) over a 2019 velocity map of PIG. Black box indicates area shown in Fig. 2. (B) Time series of speed at points ~2 km upstream (GL−2) and downstream (GL+2) of the grounding line derived from SAR data collected by the TerraSAR-X/TanDEM-X (TSX) and Copernicus Sentinel 1A/B (S1) missions. The 90-day moving average of mean 450 m-650 m depth ocean temperatures from moorings located toward the north (PIG N) and south (PIG S) ends of the shelf front are shown (17, 18). (C) Speeds along centerline profile. Dashed, color-coded lines indicate locations of the GL±2 points.
Fig. 2
Fig. 2. Recent changes in PIG’s ice shelf extent.
Sentinel 1A/B images for (A) January 2015, (B) August 2017, (C) October 2017, (D) November 2018, (E) March 2020, and (F) September 2020. The dates are central dates for mosaics created from data collected over 6- or 12-day intervals. The dashed white line shows the grounding line used in the model for the main trunk. For reference, blue lines show the ice front position digitized from the 2015 (solid) and March 2020 (dashed) images. Red (2017) and black (2020) lines show the shelf-front positions used in the model, with the area between them representing the simulated calving event. A white “x” marks the spot where ephemeral grounding has been observed (this grounding does not occur in the simulations) (24, 25). The black and white arrows show the extent of the retreat from January 2015 and August 2017, respectively, to March 2020. The red arrows show areas where the margins lost contact with the sidewalls between March and September 2020.
Fig. 3
Fig. 3. Model and observed response to loss of the outer section of the PIG ice shelf.
(A) Simulated and observed speeds along the profile shown in Fig. 1. The simulated speeds before and after the instantaneous calving event are shown relative to the observed 2017 and July–September (JAS) 2020 speeds. The simulated speeds in 2020 and 2027 for basal melting of 57 and 75 Gt/year are shown. Color-coded vertical lines indicate locations of the GL±2 points along the profile. (B) Observed speed deviations relative to the observed March 2009 to September 2017 average speed. The simulated results are the differences between the models with and without the calving event. The time-dependent simulations show ensemble averages for the 30 random melt functions, with the vertical bars indicating the ±1-σ variation. The date of the simulated shelf removal is September 2017.

References

    1. Hughes T. J., The weak underbelly of the West Antarctic Ice Sheet. J. Glaciol. 27, 518–525 (1981).
    1. Rignot E., Vaughan D., Schmeltz M., Dupont T., MacAyeal D., Acceleration of Pine Island and Thwaites glaciers, West Antarctica. Ann. Glaciol. 34, 189–194 (2002).
    1. Joughin I., Rignot E., Rosanova C. E., Lucchitta B. K., Bohlander J., Timing of recent accelerations of pine island glacier, Antarctica. Geophys. Res. Lett. 30, 1706 (2003).
    1. Rignot E., Changes in West Antarctic ice stream dynamics observed with ALOS PALSAR data. Geophys. Res. Lett. 35, L12505 (2008).
    1. Mouginot J., Rignot E., Scheuchl B., Sustained increase in ice discharge from the Amundsen Sea Embayment, West Antarctica, from 1973 to 2013. Geophys. Res. Lett. 41, 1576–1584 (2014).