. 2021 Jun 11;12(1):3554.
doi: 10.1038/s41467-021-23267-w.

Distinct clinical and immunological profiles of patients with evidence of SARS-CoV-2 infection in sub-Saharan Africa

Collaborators, Affiliations

Distinct clinical and immunological profiles of patients with evidence of SARS-CoV-2 infection in sub-Saharan Africa

Ben Morton et al. Nat Commun. .

Abstract

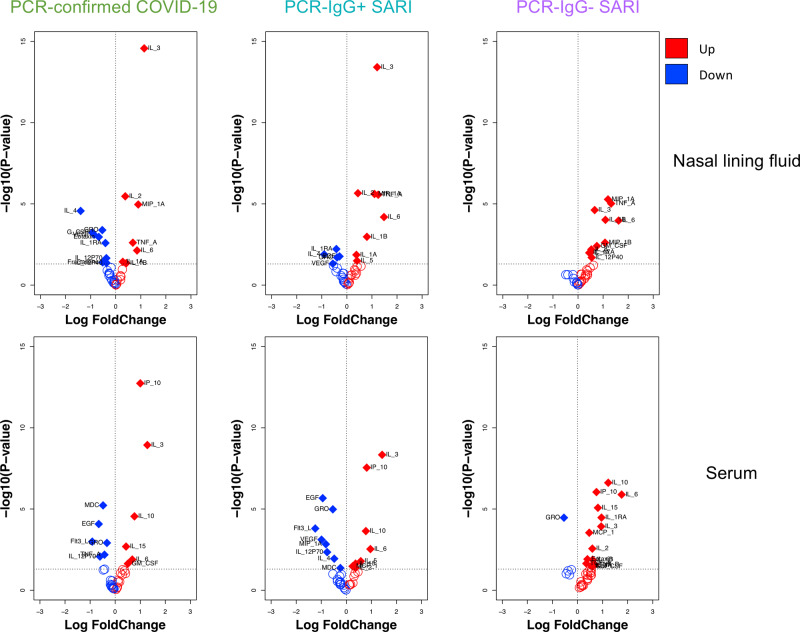
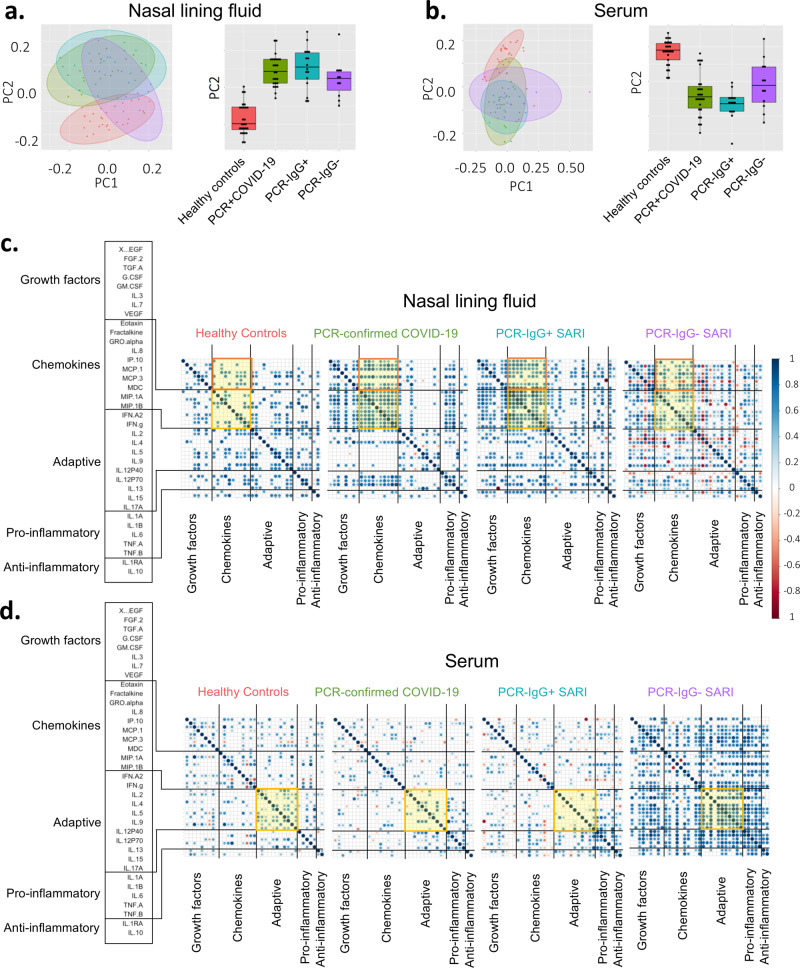
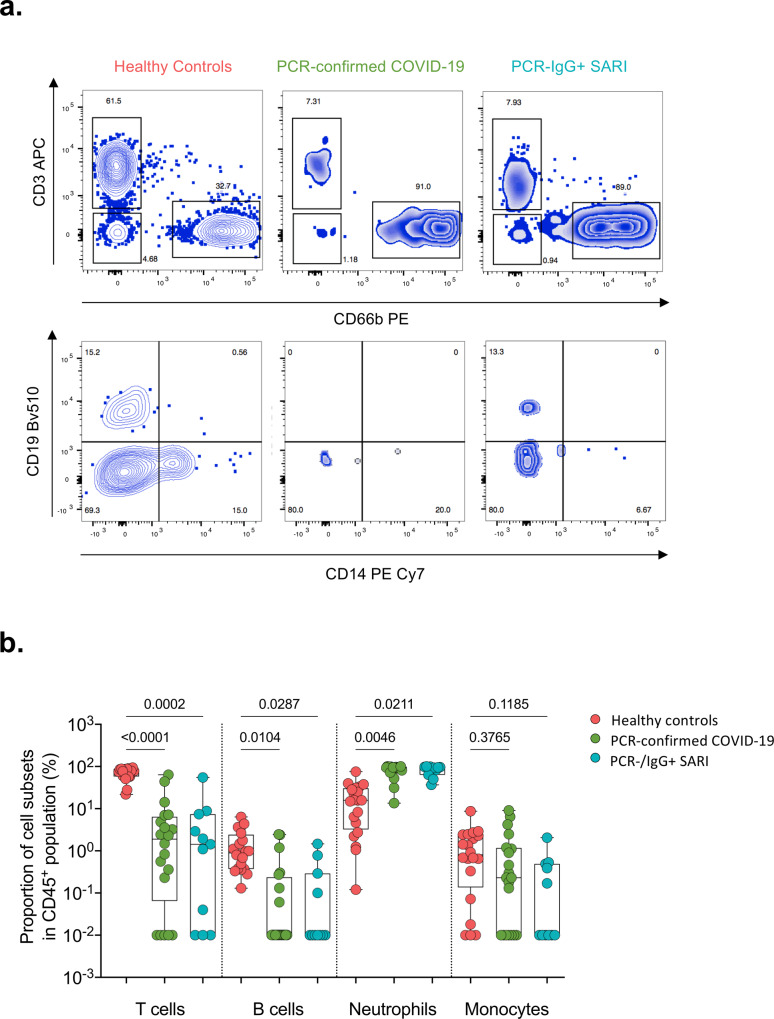
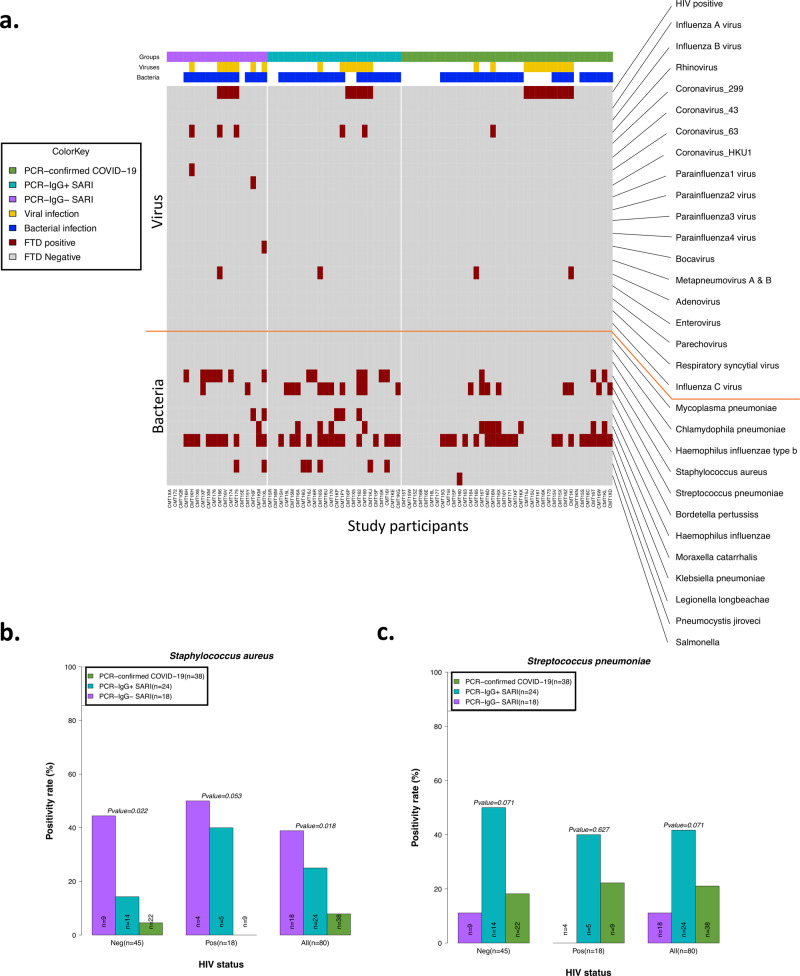
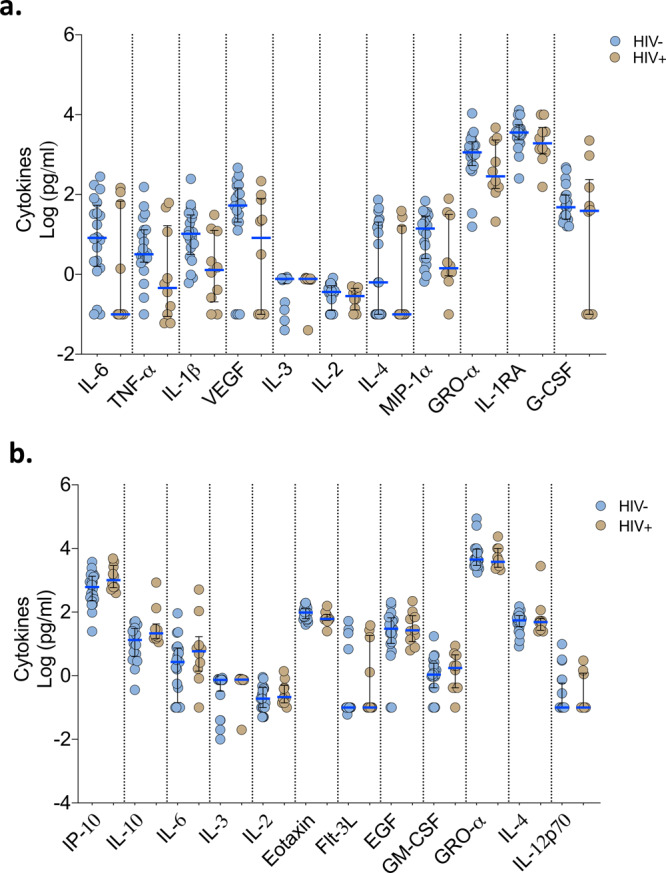
Although the COVID-19 pandemic has left no country untouched there has been limited research to understand clinical and immunological responses in African populations. Here we characterise patients hospitalised with suspected (PCR-negative/IgG-positive) or confirmed (PCR-positive) COVID-19, and healthy community controls (PCR-negative/IgG-negative). PCR-positive COVID-19 participants were more likely to receive dexamethasone and a beta-lactam antibiotic, and survive to hospital discharge than PCR-negative/IgG-positive and PCR-negative/IgG-negative participants. PCR-negative/IgG-positive participants exhibited a nasal and systemic cytokine signature analogous to PCR-positive COVID-19 participants, predominated by chemokines and neutrophils and distinct from PCR-negative/IgG-negative participants. PCR-negative/IgG-positive participants had increased propensity for Staphylococcus aureus and Streptococcus pneumoniae colonisation. PCR-negative/IgG-positive individuals with high COVID-19 clinical suspicion had inflammatory profiles analogous to PCR-confirmed disease and potentially represent a target population for COVID-19 treatment strategies.


Conflict of interest statement

The authors declare no competing interests

Figures

Fig. 1
Fig. 1. Study recruitment timeline and SARS-CoV-2 diagnosis.
a Suspected and SARS-CoV-2 RT-qPCR-confirmed COVID-19 patients recruited at Queen Elizabeth Central Hospital, Blantyre (positive (red) and negative (blue)) reported as cases/week compared to the national data (light grey). National data include SARS-CoV-2 RT-qPCR-confirmed symptomatic and non-symptomatic COVID-19. b SARS-CoV-2 Spike protein 2 (S2) and nucleoprotein (NP) IgG antibodies in PCR-negative and -positive individuals. The data are reported as the ratio of OD in the test samples to the assay threshold control. For all boxplots, box boundaries correspond to 25th and 75th percentiles; whiskers extend to a maximum or minimum greatest value. Data were analysed using Mann–Whitney test, two-sided (PCR positive, n = 38; PCR negative, n = 45). SARS-CoV-2 severe acute respiratory syndrome coronavirus 2, COVID-19 coronavirus disease of 2019, PCR polymerase chain reaction, IgG immunoglobulin, SARI severe acute respiratory infection. Source data are provided as a Source Data file.
Fig. 2
Fig. 2. Cytokine concentrations in nasal lining fluid and serum.
Volcano plots showing differential cytokine concentrations in nasal lining fluid and serum of PCR-confirmed COVID-19, PCR−/IgG+ SARI and PCR−/IgG− SARI patients compared to health controls. The horizontal dotted line represents a cut-off for statistical significance, while the vertical dotted line represents a cut-off point for determining whether the levels of the cytokines were higher (right, red) or lower (left, blue) compared to healthy controls. Data were analysed using empirical Bayes moderated two-sided t-tests and adjusted p values are reported (healthy controls, n = 25; PCR-confirmed COVID-19, n = 25; PCR−/IgG+ SARI, n = 16; PCR−/IgG− SARI, n = 11). SARS-CoV-2 severe acute respiratory syndrome coronavirus 2, COVID-19 coronavirus disease of 2019, PCR polymerase chain reaction, IgG immunoglobulin G, SARI severe acute respiratory infection. Source data are provided as a Source Data file.
Fig. 3
Fig. 3. Nasal and serum cytokine profiles.
Principal component analysis (PCA) of the 38 analytes (37 cytokines and sCD40L) in a nasal lining fluid and b serum of healthy controls, PCR-confirmed COVID-19, PCR−/IgG+ SARI and PCR−/IgG− SARI patients, showing similarity of nasal cytokine responses between PCR-confirmed COVID-19 and PCR−/IgG+ SARI patients. Correlogram of cytokine interactions in c nasal lining fluid and d serum among the different study groups, showing induction of similar immune process in PCR-confirmed COVID-19 and PCR−/IgG+ SARI patients. For all boxplots, box boundaries correspond to 25th and 75th percentiles; whiskers extend to a maximum of 1.5× the interquartile range, with values outside the box and whiskers being outliers. Healthy controls, n = 25; PCR-confirmed COVID-19, n = 25; PCR−/IgG+ SARI, n = 16; PCR−/IgG− SARI, n = 11. SARS-CoV-2 severe acute respiratory syndrome coronavirus 2, COVID-19 coronavirus disease of 2019, PCR polymerase chain reaction, IgG immunoglobulin G, SARI severe acute respiratory infection, PC1 principal component 1, PC2 principal component 2. Source data are provided as a Source Data file.
Fig. 4
Fig. 4. Nasal cell composition in healthy controls, confirmed and suspected COVID-19 patients.
a Representative flow cytometry plots for cellular composition in the nasal mucosa of healthy controls, PCR-confirmed COVID-19 and PCR−/IgG+ SARI patients. b Proportions of T cells, B cells, neutrophils and monocytes in nasal mucosa of healthy controls and COVID-19 patients. For all boxplots, box boundaries correspond to 25th and 75th percentiles; whiskers extend to a maximum or minimum greatest value. Data were analysed using Kruskal–Wallis test, two-sided (healthy controls, n = 20; PCR-confirmed COVID-19, n = 20; PCR−/IgG+ SARI, n = 11). SARS-CoV-2 severe acute respiratory syndrome coronavirus 2, COVID-19 coronavirus disease of 2019, PCR polymerase chain reaction, IgG immunoglobulin G, SARI severe acute respiratory infection. Source data are provided as a Source Data file.
Fig. 5
Fig. 5. Co-colonisation/infection status of suspected and confirmed COVID-19 patients.
a Profile of co-colonisation/infection pathogens in nasopharyngeal/throat swabs. Prevalence of b Staphylococcus aureus and c Streptococcus pneumoniae co-colonisation in suspected and confirmed COVID-19. The horizontal bars represent the median and interquartile range (IQR). Data were analysed using Kruskal–Wallis test (PCR-confirmed COVID-19, n = 39; PCR−/IgG+ SARI, n = 23; PCR−/IgG− SARI, n = 22). COVID-19 coronavirus disease of 2019. Source data are provided as a Source Data file.
Fig. 6
Fig. 6. Cytokine concentrations in nasal lining fluid and serum based on HIV-co-infection status.
PCR-confirmed COVID-19 and PCR−/IgG+ SARI patients were combined (n = 41) into one COVID-19 patient group. Only cytokines that showed differential responses between patients with healthy controls were included in the analysis. a Cytokine concentrations between HIV-infected and uninfected COVID-19 patients in nasal lining fluid. b Cytokine concentrations between HIV-infected and uninfected COVID-19 patients in serum. The horizontal bars represent the median (blue line) and interquartile range (IQR) (black lines). Data were analysed using Kruskal–Wallis test (HIV−, n = 20; HIV+, n = 10). COVID-19 coronavirus disease of 2019, PCR polymerase chain reaction, SARI severe acute respiratory infection. Source data are provided as a Source Data file.

Update of

References

    1. Government S. A. Update on Covid-19. https://sacoronavirus.co.za (2020).
    1. Kuehn BM. Africa succeeded against COVID-19’s first wave, but the second wave brings new challenges. JAMA. 2021;325:327–328. doi: 10.1001/jama.2020.24288. - DOI - PubMed
    1. Andrews B, et al. Effect of an early resuscitation protocol on in-hospital mortality among adults with sepsis and hypotension: a randomized clinical trial. JAMA. 2017;318:1233–1240. doi: 10.1001/jama.2017.10913. - DOI - PMC - PubMed
    1. Mallett S, et al. At what times during infection is SARS-CoV-2 detectable and no longer detectable using RT-PCR-based tests? A systematic review of individual participant data. BMC Med. 2020;18:346. doi: 10.1186/s12916-020-01810-8. - DOI - PMC - PubMed
    1. Chi Y, et al. Serum cytokine and chemokine profile in relation to the severity of coronavirus disease 2019 in China. J. Infect. Dis. 2020;222:746–754. doi: 10.1093/infdis/jiaa363. - DOI - PMC - PubMed

Publication types