. 2021 Jun 11;12(1):3564.
doi: 10.1038/s41467-021-23666-z.

Reliable identification of protein-protein interactions by crosslinking mass spectrometry

Affiliations

Reliable identification of protein-protein interactions by crosslinking mass spectrometry

Swantje Lenz et al. Nat Commun. .

Abstract

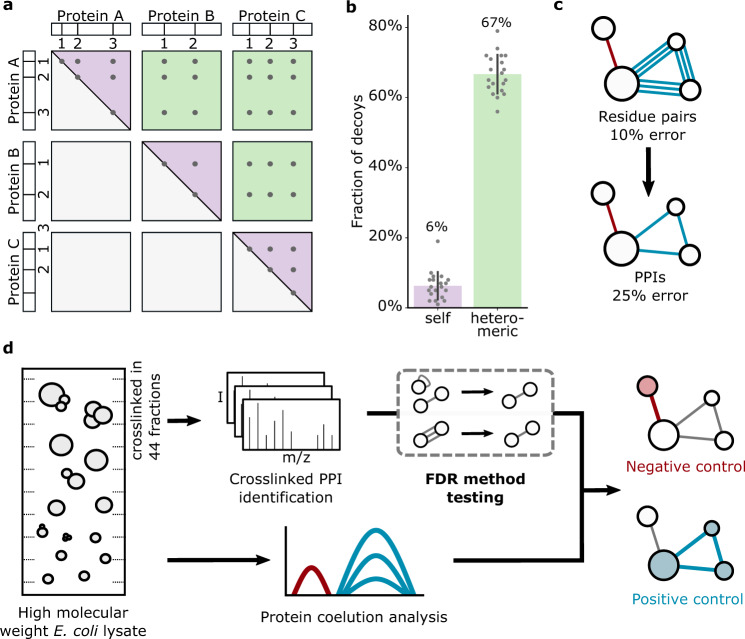
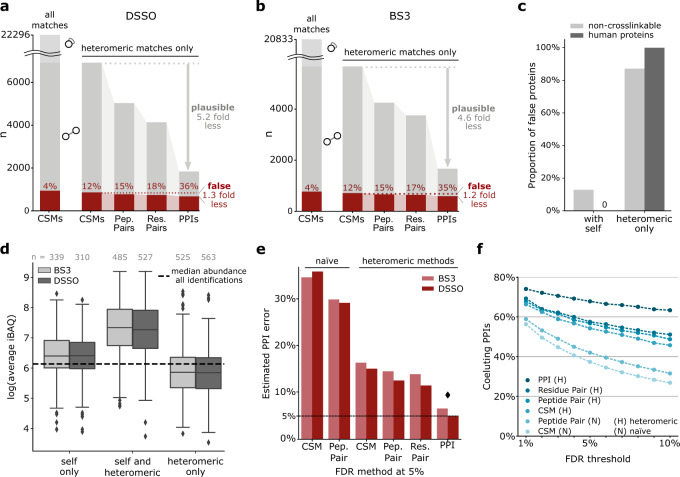
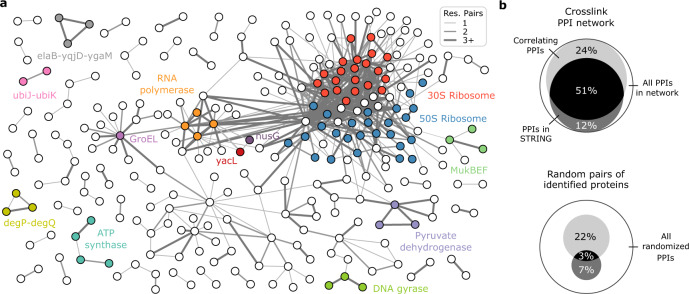
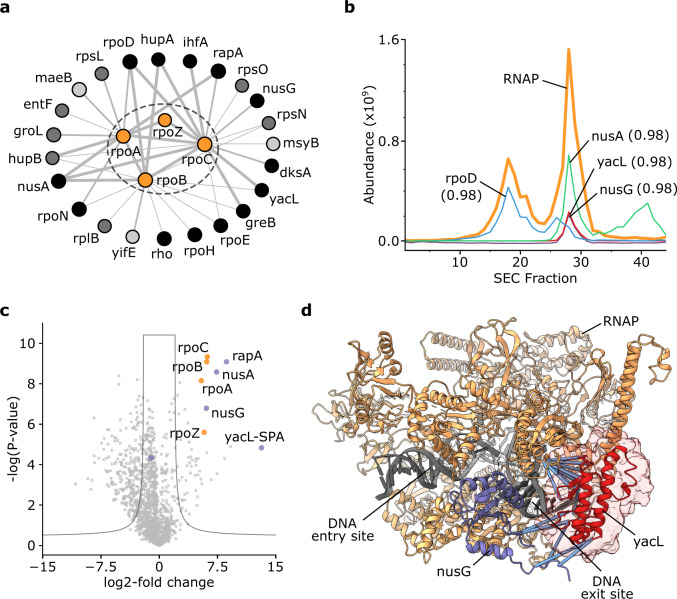
Protein-protein interactions govern most cellular pathways and processes, and multiple technologies have emerged to systematically map them. Assessing the error of interaction networks has been a challenge. Crosslinking mass spectrometry is currently widening its scope from structural analyses of purified multi-protein complexes towards systems-wide analyses of protein-protein interactions (PPIs). Using a carefully controlled large-scale analysis of Escherichia coli cell lysate, we demonstrate that false-discovery rates (FDR) for PPIs identified by crosslinking mass spectrometry can be reliably estimated. We present an interaction network comprising 590 PPIs at 1% decoy-based PPI-FDR. The structural information included in this network localises the binding site of the hitherto uncharacterised protein YacL to near the DNA exit tunnel on the RNA polymerase.


Conflict of interest statement

The authors declare no competing interests.

Figures

Fig. 1
Fig. 1. Considerations for crosslinked PPI-FDR and experimental workflow.
a For matches within the same protein sequence (with a non-directional crosslinker), a crosslink from A1 to A2 is indistinguishable from A2 to A1 (theoretically possible search space shown as purple triangles). In contrast, heteromeric matches are not symmetrical, and therefore occupy a larger random space (green squares). b Fraction of decoys in random picks of 100 self and 100 heteromeric CSMs from the search output before any FDR filtering (random picks, n = 20, i.e. ten per crosslinker dataset). Error bars show standard deviation from the mean. Source data are provided as a Source Data file. c Schematic showing error increase when merging crosslinked residue pairs to PPIs. Proteins are indicated as circles; blue and red lines represent true and false linkages, respectively. d Experimental workflow. E. coli lysate was separated and crosslinked in individual high molecular weight fractions, pooled again to simulate a complex mixture and analyzed by mass spectrometry. Quantitative proteomics of uncrosslinked fractions provided protein coelution data.
Fig. 2
Fig. 2. Comparative analysis of different methods of FDR estimation in crosslinking MS.
a, b False identifications as a function of merging heteromeric CSMs passing a naïve decoy-based CSM-FDR of 5% for a DSSO and b BS3, respectively. When merging crosslink data from CSMs to PPIs, the number of identifications decreases and the fraction of false identifications increases. CSMs rarely corroborated each other in false PPIs while plausible PPIs were supported by multiple CSMs. Heteromeric CSMs are indicted by circles connected with a straight line; self-CSMs by a circle with curved line. c Proportion of proteins involved in false PPIs with self-links or with only heteromeric crosslinks, of non-crosslinkable E. coli proteins and the entrapment database. d Proteins found exclusively in heteromeric PPIs had a lower abundance than all identified proteins and thus a low chance to be detected. Boxplots depict the median (middle line), upper and lower quartiles (boxes), 1.5 times of the interquartile range (whiskers) as well as outliers (single points). e PPI error resulting from a 5% FDR threshold of FDR approaches performed in other studies (Supplementary Table 1). Each bar is from a separate FDR calculation. Diamond denotes the method leading to the PPI error closest to 5%. f Fraction of protein pairs with similar elution profiles (correlation coefficient > 0.5) among the PPIs passing a given FDR threshold, applying different published FDR methods (Supplementary Table 1). Averages of BS3 and DSSO data are shown (Also presented sepearately in Supplementary Fig. 4). Source data for panels a, b and d are provided as a Source Data file.
Fig. 3
Fig. 3. Heteromeric PPI-FDR leads to high fidelity PPI network in E. coli lysate.
a Crosslinking MS-derived PPI network of soluble high molecular weight E. coli proteome. Selected proteins (circles) and protein complexes are highlighted. The proteins AceA and TnaA were removed for clarity. b Characterization of the obtained PPI network in comparison to random PPIs from proteins identified in coelution data. Shown are the overlaps with STRING database and coelution data (correlation coefficient > 0.5).
Fig. 4
Fig. 4. The uncharacterised protein YacL binds to RNA polymerase.
a PPI subnetwork of RNAP. Line thickness between proteins (circles) increases with frequency of observed crosslinks (i.e. one, two, three and more crosslinked residue pairs). Colour scheme for RNAP binders: light grey = coelution correlation > 0.5, dark grey = STRING database combined score ≥ 150, black = both of the previous categories. b Elution traces of RNAP (average abundance of its subunits) and selected RNAP binders with their minimal elution correlation coefficient to any RNAP constituent. c Volcano plot showing the affinity enrichment of SPA-tagged YacL, which co-enriches RNAP (orange) and a number of proteins found crosslinked to the RNAP in the YacL affinity-enrichment experiment (violet). d RNAP with bound NusG (PDB 6C6U [10.2210/pdb6c6u/pdb]) and the region of Crosslinking MS-defined accessible interaction space with 14 satisfied restraints for YacL (I-TASSER model, placed for visualisation purposes) highlighted. Crosslinks between YacL and NusG or RNAP are highlighted in blue.

References

    1. O’Reilly FJ, Rappsilber J. Cross-linking mass spectrometry: methods and applications in structural, molecular and systems biology. Nat. Struct. Mol. Biol. 2018;25:1000–1008. doi: 10.1038/s41594-018-0147-0. - DOI - PubMed
    1. Chavez JD, Keller A, Zhou B, Tian R, Bruce JE. Cellular interactome dynamics during paclitaxel treatment. Cell Rep. 2019;29:2371–2383.e5. doi: 10.1016/j.celrep.2019.10.063. - DOI - PMC - PubMed
    1. Steigenberger B, Pieters RJ, Heck AJR, Scheltema RA. PhoX: an IMAC-enrichable cross-linking reagent. ACS Cent. Sci. 2019;5:1514–1522. doi: 10.1021/acscentsci.9b00416. - DOI - PMC - PubMed
    1. Chen Z-L, et al. A high-speed search engine pLink 2 with systematic evaluation for proteome-scale identification of cross-linked peptides. Nat. Commun. 2019;10:3404. doi: 10.1038/s41467-019-11337-z. - DOI - PMC - PubMed
    1. Mendes ML, et al. An integrated workflow for crosslinking mass spectrometry. Mol. Syst. Biol. 2019;15:e8994. doi: 10.15252/msb.20198994. - DOI - PMC - PubMed

Publication types

MeSH terms