. 2021 Jun 11;12(1):3558.
doi: 10.1038/s41467-021-23829-y.

The functional organization of excitatory synaptic input to place cells

Affiliations

The functional organization of excitatory synaptic input to place cells

Michael D Adoff et al. Nat Commun. .

Abstract

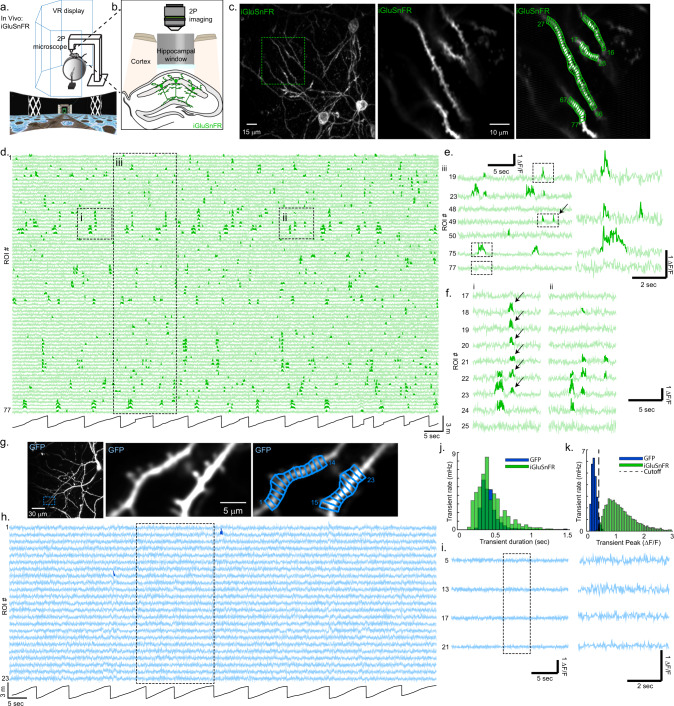
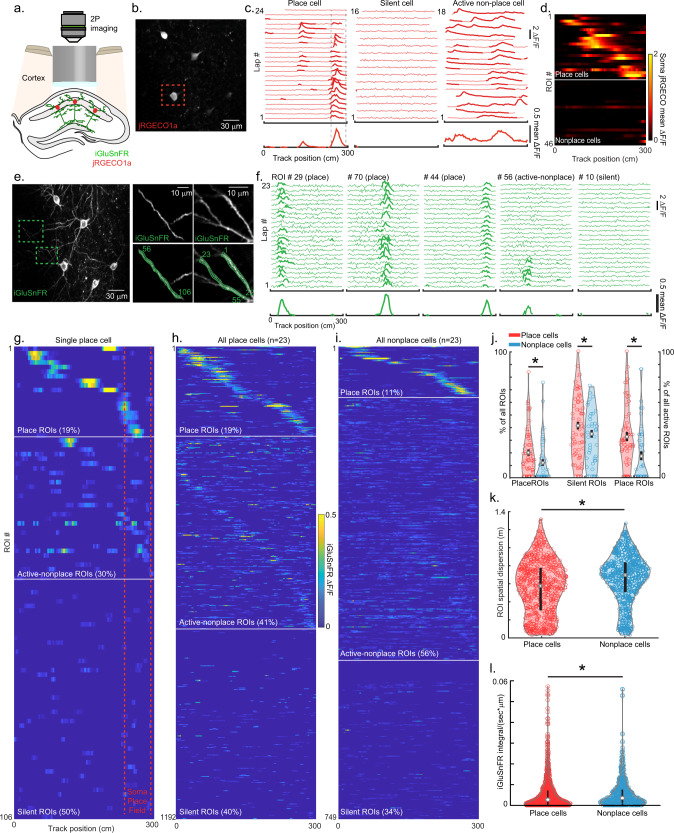
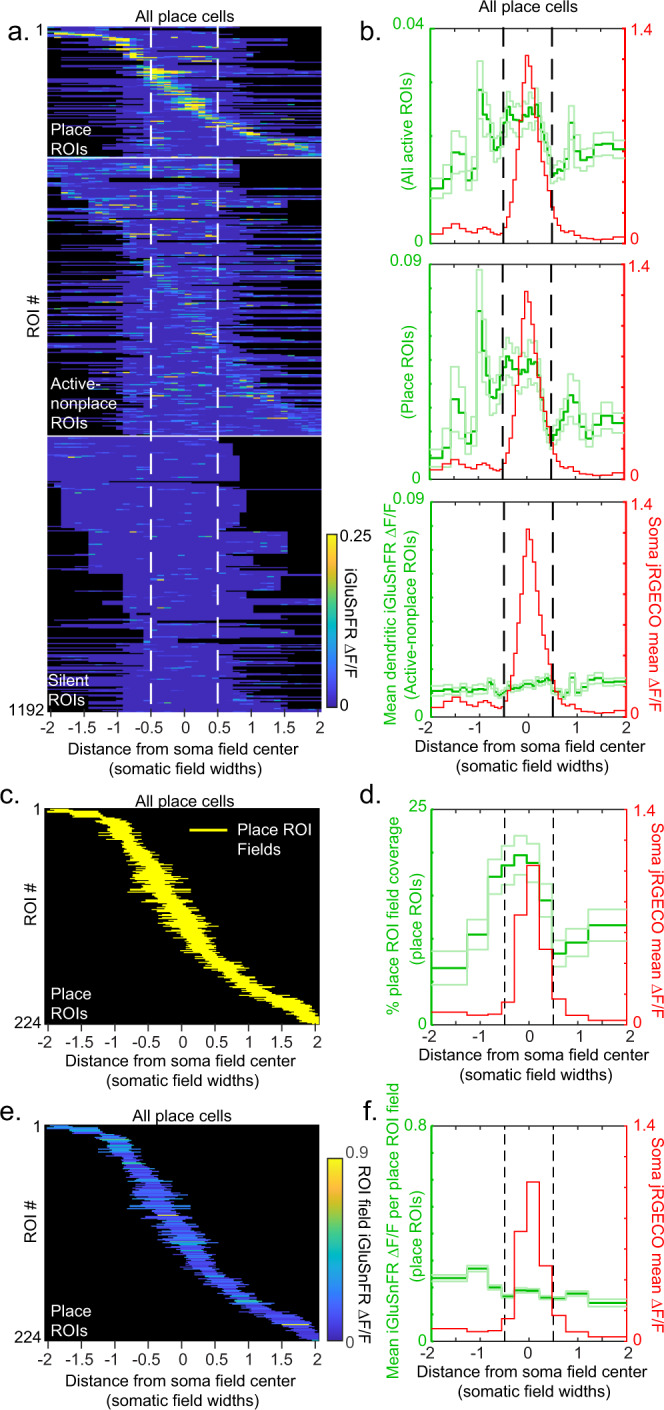
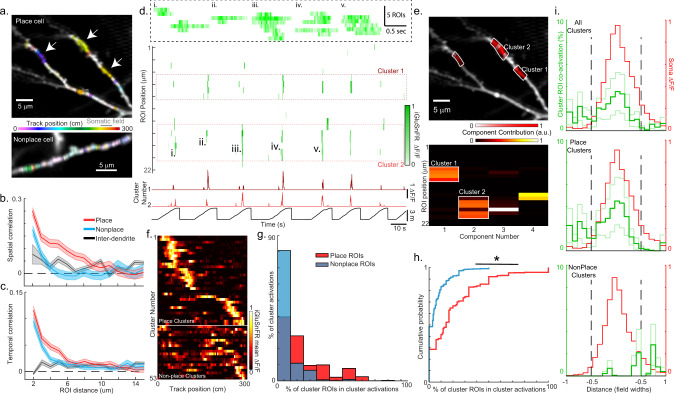
Hippocampal place cells contribute to mammalian spatial navigation and memory formation. Numerous models have been proposed to explain the location-specific firing of this cognitive representation, but the pattern of excitatory synaptic input leading to place firing is unknown, leaving no synaptic-scale explanation of place coding. Here we used resonant scanning two-photon microscopy to establish the pattern of synaptic glutamate input received by CA1 place cells in behaving mice. During traversals of the somatic place field, we found increased excitatory dendritic input, mainly arising from inputs with spatial tuning overlapping the somatic field, and functional clustering of this input along the dendrites over ~10 µm. These results implicate increases in total excitatory input and co-activation of anatomically clustered synaptic input in place firing. Since they largely inherit their fields from upstream synaptic partners with similar fields, many CA1 place cells appear to be part of multi-brain-region cell assemblies forming representations of specific locations.


Conflict of interest statement

The authors declare no competing interests.

Figures

Fig. 1
Fig. 1. Optical recording of excitatory input to CA1 neuron dendrites during spatial behaviors.
a Schematic of behavioral apparatus (top) and an example of the virtual linear track (bottom). b Schematic of hippocampal imaging window used to image CA1 pyramidal neurons expressing iGluSnFR with 2P microscopy during spatial behaviors in VR. c Left, example z-projection image of CA1 pyramidal neurons expressing iGluSnFR and imaged during behavior. Middle, mean image from time series acquired at a single imaging plane (from the region shown at the left). Right, same as middle, but with 77 1-µm ROIs shown in green. Similar results were obtained in 54 sessions from 11 mice. d iGluSnFR ΔF/F vs. time traces for each ROI shown in (c, right) acquired during linear track navigation (track position at the bottom, black). Significant transients highlighted in bold. e Left, expanded scale of a subset of traces shown in region iii from panel (d); arrow, example transients restricted to 1 ROI. Right, expanded scale of traces shown dashed at the left. f Left, expanded scale of traces shown in region i from panel (d) showing synchronous transients occurring over adjacent ROIs 18–23, marked with arrows. Right, expanded scale of traces shown in region ii from panel (d) showing transients in only some of the ROIs that were synchronously active in region i. Panel (g) same as panel (c), but neurons expressing GFP. Similar results were obtained in 13 sessions from 4 mice. Panel (h) same as panel (d), but from ROIs shown in panel (g, right). i Left, expanded scale of traces shown in the dashed region in panel (h). Right, expanded scale of traces shown dashed at the left. j, k. Histograms of durations (j) and peaks (k) of all significant iGluSnFR or GFP fluorescence transients from all 1 µm ROIs from all CA1 dendritic imaging sessions during behavior. Significant iGluSnFR transient amplitude cutoff threshold shown by a dashed line. GFP: n = 19 dendrites from 13 independent sessions from 4 mice. iGluSnFr: n = 109 dendrites from 54 independent sessions from 11 mice. Source data are provided as a Source Data file. VR virtual reality, 2P two-photon microscopy, ROI region of interest.
Fig. 2
Fig. 2. Spatial tuning of excitatory synaptic inputs to place and nonplace cells.
a Schematic of experiments using 2P microscopy to image CA1 pyramidal neuron somatic firing patterns with jRGECO1a (red) and excitatory synaptic inputs to dendrites with iGluSnFR (green) during spatial behaviors in VR. b Example image of jRGECO1a fluorescence from labeled CA1 pyramidal neurons imaged during behavior. c Somatic jRGECO1a ΔF/F versus track position for each traversal of a single session (top) and mean ΔF/F versus position across all traversals (bottom) for three different neurons from different mice. Place cell at the left (cell highlighted in panel (b)) with place field track location between dashed lines, silent cell in the middle, and active–nonplace cell at the right. Significant transients highlighted in bold. d Mean somatic jRGECO1a ΔF/F versus track position across all traversals of a single session for all recorded neurons (each row represents single-neuron mean ΔF/F). Plotted via cross-validation within each cell category. e Left, example z-projection image of iGluSnFR fluorescence from labeled CA1 pyramidal neurons imaged during behavior (same neurons and field of view as shown in panel (b). Right, top, mean images from time series acquired at two different single-imaging planes (from regions shown at the left). Right, bottom, same as top, but with 106 1-µm ROIs shown in green. Similar results were obtained in 54 sessions from 11 mice. f iGluSnFR ΔF/F vs track position for each traversal of a single session (top) and mean ΔF/F versus position across all traversals (mean ROI map, bottom) for five example ROIs shown in panel(e, right), from place cell shown in panels (b, c). Significant transients highlighted in bold. Place-ROIs: 29, 44, 70; Silent-ROI: 10, Active–nonplace-ROI: 56. g Mean iGluSnFR ΔF/F versus track position across all traversals of a single session (mean ROI map) for all ROIs (each row represents a single ROI mean ΔF/F) shown in (e, right), from place cell shown in panels (b, c). Somatic place field track location between dashed lines. The percentage of ROIs in each ROI category also shown. Plotted via cross-validation within each ROI category. h, i. Same as panel (g), but for all ROIs from all 62 branches of all 23 place cells (h) or all 41 branches of all 23 nonplace cells (i). j Percentage of ROIs in each ROI category for place vs nonplace cells. Each circle represents a single branch. Mean ± bci across branches. (*p < 3.2e−3, likelihood ratio test, two-sided). n = 62 dendrites from 23 place cells from 35 independent sessions from 11 mice; n = 41 dendrites from 23 nonplace cells from 24 independent sessions from 11 mice. k Spatial dispersion of iGluSnFR transients in each ROI for all ROIs in place cells vs. nonplace cells (*p = 1.24e−4, likelihood ratio test, two-sided). l Mean amount of excitatory input per ROI per second (integral of all significant iGluSnFR transients in each ROI divided by recording time) for all ROIs in place cells vs. nonplace cells (*p = 9.1e−4, Rank-sum test, two-sided, place<nonplace). Source data are provided as a Source Data file for panels (jl).
Fig. 3
Fig. 3. Total excitatory input is greater in the somatic place field versus out.
a Mean iGluSnFR ΔF/F versus position from somatic place field center (in units of somatic place field width) across all traversals of a single session for all ROIs (each row represents single ROI mean ΔF/F) from all 62 branches of all 23 place cells (same ROIs as shown in Fig. 2h). Mean somatic place field between dashed lines. Plotted via cross-validation within each ROI category. b Mean total excitatory input (green) as a function of distance from the center of the mean somatic place field (red) for all active ROIs (top), all place-ROIs (middle), and all active–nonplace-ROIs (bottom). Mean (dark green) ± SE (light green). c, d. All place-ROI fields (yellow) versus position from somatic place field center (each yellow dash is a separate place-ROI field) (c) and percentage of place-ROIs with place-ROI field coverage (green) of binned positions from the center of mean somatic place field (red; (d), bin size different than in b). e, f. All place-ROI fields colored by their (mean) ROI field ΔF/F versus position from somatic place field center (e), and mean ΔF/F per place-ROI field (green) versus position from the center of mean somatic place field (red; (f), bin size different than in (b). Source data are provided as a Source Data file for b, d, and f.
Fig. 4
Fig. 4. Excitatory inputs are more temporally co-active and anatomically clustered in the somatic place field versus out.
a Dendritic segments from a place cell (top) and nonplace cell (bottom) with ROIs colored according to the center of mass of each ROI’s mean ΔF/F map. The brightness indicates peak ΔF/F value in the mean ΔF/F map divided by the spatial dispersion. Track location of somatic place field for place cell (top) shown in gray. Similar results were obtained from 23 place cells and 23 nonplace cells from 11 mice. b Spatial correlation (Pearson’s correlation) between the mean ΔF/F maps of all pairs of active ROIs on a single branch versus the dendritic distance between the pairs of ROIs, averaged over all branches from place (red) or nonplace (blue) cells. Inter-dendrite spatial correlation versus Euclidean distance for pairs of ROIs that belonged to different branches co-recorded in the same field averaged over all pairs of branches from all dendritic iGluSnFR recordings (black). Shaded regions, SEM. c Temporal correlation versus dendritic distance plots calculated as in panel (b), except significant transient-only traces were used instead of mean ΔF/F maps. Shaded regions, SEM. d Matrix of significant iGluSnFR ΔF/F transient vs time traces (green, 100 ms bins) for 22 neighboring ROIs from the top branch shown in panel (a, top) acquired during linear track navigation (track position at the bottom, black). ROIs for the 2 functional clusters from panel (e, bottom) outlined in red dashed boxes and the associated cluster ΔF/F vs time traces shown in red (bottom). The expanded time base for five events (i–v) shown in the black dashed box inset. Note that cluster activations (nonzero cluster ΔF/F) could occur as coactivation of all cluster ROIs, some of the cluster ROIs (often nonadjacent), or just one cluster ROI. e Bottom, non-negative independent components for the matrix shown in (d) (top), with 2 functional clusters highlighted in white. Top, Dendritic segments shown in (a), but ROIs belonging to 3 different functional clusters are highlighted in white. Similar results were obtained from 23 place cells and 23 nonplace cells from 11 mice. f Mean cluster iGluSnFR ΔF/F versus track position across all traversals of a single session for all functional clusters (each row represents single-cluster mean ΔF/F) from all place and nonplace cells. Plotted via cross-validation within each cluster category. g Histogram of percent of place (red) or active–nonplace (blue) ROIs that were part of a cluster that was co-active during a cluster activation (nonzero cluster ΔF/F). h Cumulative probability from histograms shown in panel (g). *p = 2.7e−117, Rank-sum test, two-sided. i Mean cluster ROI coactivation (green, percentage of cluster activations with > 70% cluster ROI coactivation) as a function of distance from the center of the mean somatic place field (red) for all clusters (top), all place clusters (middle), and all active–nonplace clusters (bottom). Mean (dark green) ± SE (light green). Source data are provided as a Source Data file for b, c, g, h, and i.

References

    1. O’Keefe J, Dostrovsky J. The hippocampus as a spatial map. Preliminary evidence from unit activity in the freely-moving rat. Brain Res. 1971;34:171–175. doi: 10.1016/0006-8993(71)90358-1. - DOI - PubMed
    1. Zhao, X., Wang, Y., Spruston, N. & Magee, J. C. Membrane potential dynamics underlying context-dependent sensory responses in the hippocampus. Nat. Neurosci.23, 881–891 (2020). - PubMed
    1. Weber, S. N. & Sprekeler, H. Learning place cells, grid cells and invariances with excitatory and inhibitory plasticity. eLife10.7554/eLife.34560 (2018). - PMC - PubMed
    1. Sheffield ME, Dombeck DA. Dendritic mechanisms of hippocampal place field formation. Curr. Opin. Neurobiol. 2019;54:1–11. doi: 10.1016/j.conb.2018.07.004. - DOI - PubMed
    1. Lee D, Lin BJ, Lee AK. Hippocampal place fields emerge upon single-cell manipulation of excitability during behavior. Science. 2012;337:849–853. doi: 10.1126/science.1221489. - DOI - PubMed

Publication types