. 2021 Jun 11;12(1):3589.
doi: 10.1038/s41467-021-23707-7.

Maps and metrics of insecticide-treated net access, use, and nets-per-capita in Africa from 2000-2020

Affiliations

Maps and metrics of insecticide-treated net access, use, and nets-per-capita in Africa from 2000-2020

Amelia Bertozzi-Villa et al. Nat Commun. .

Abstract

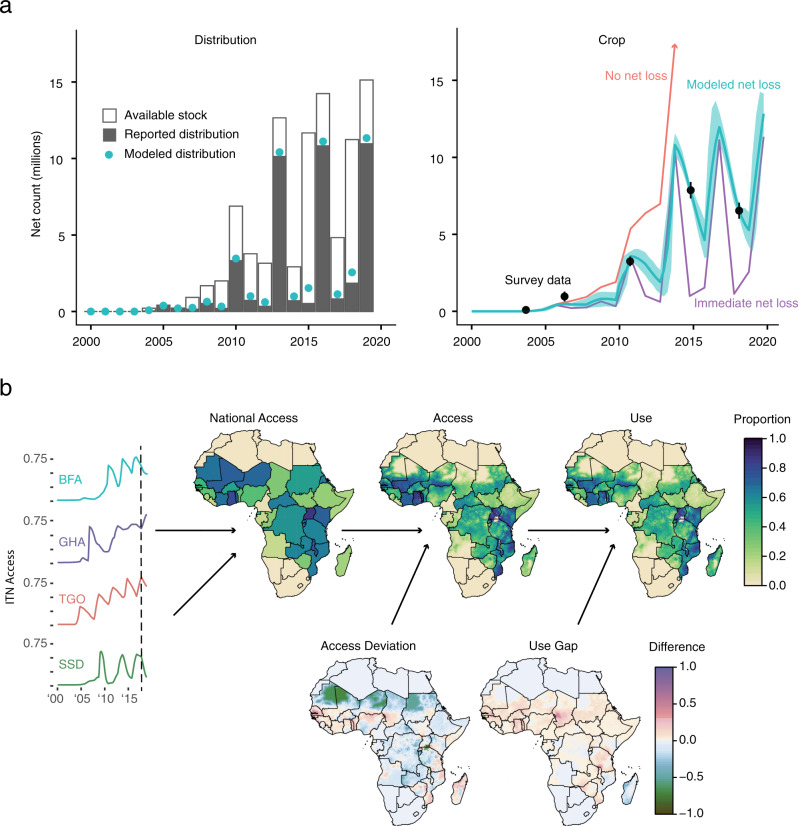
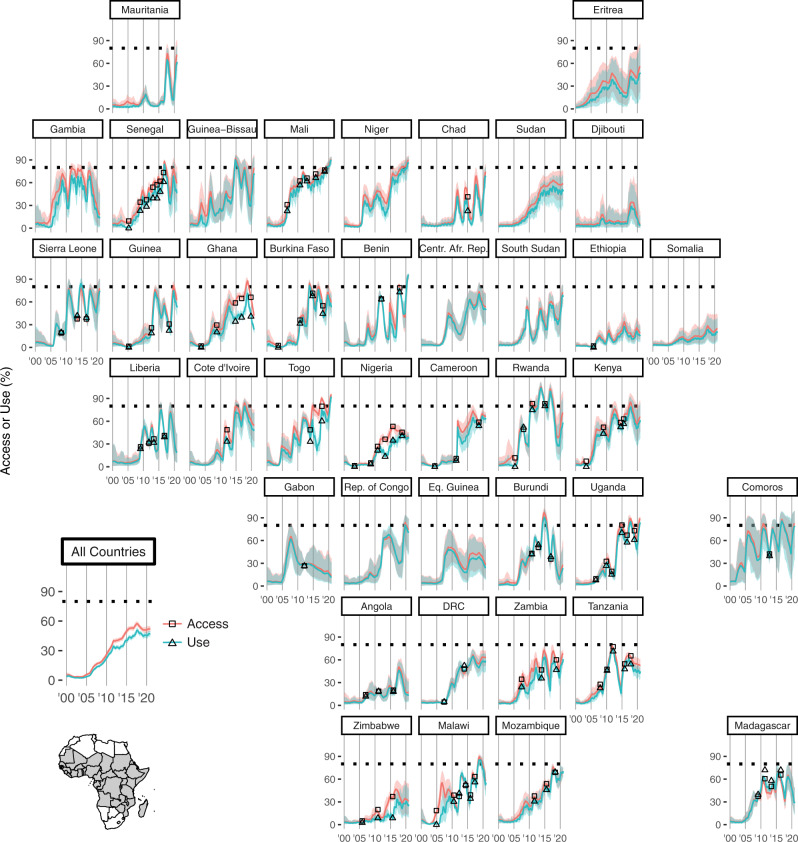
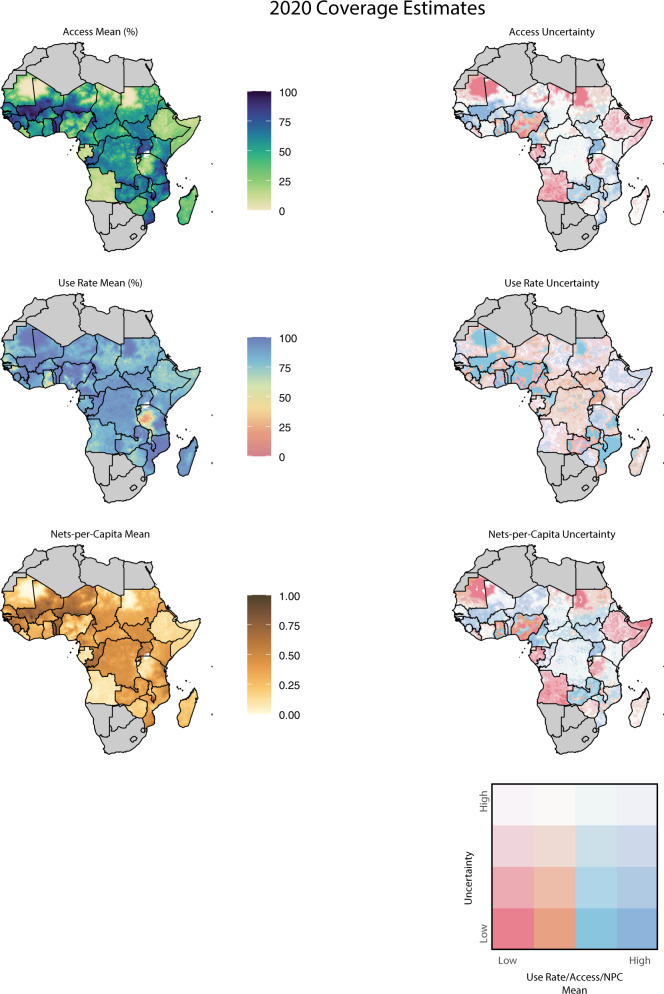
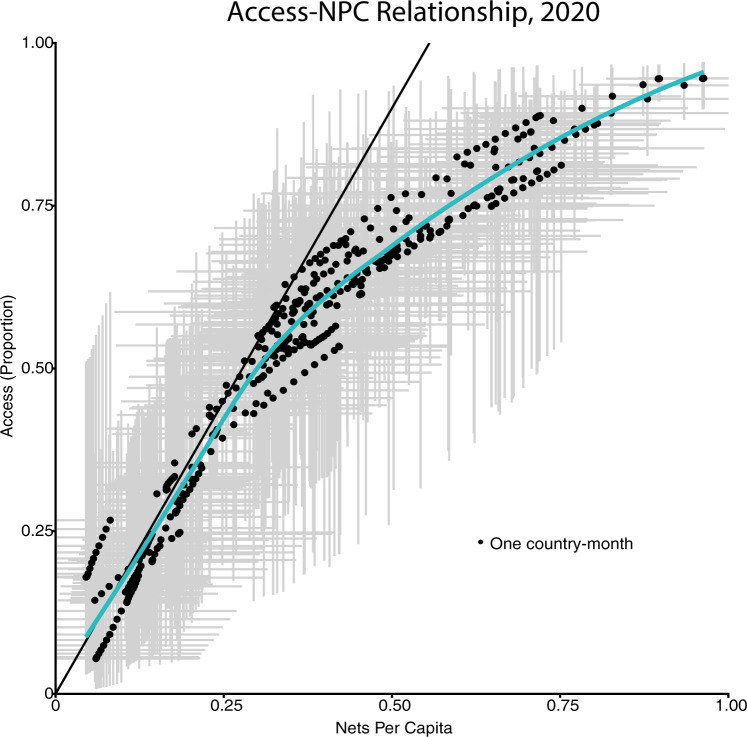
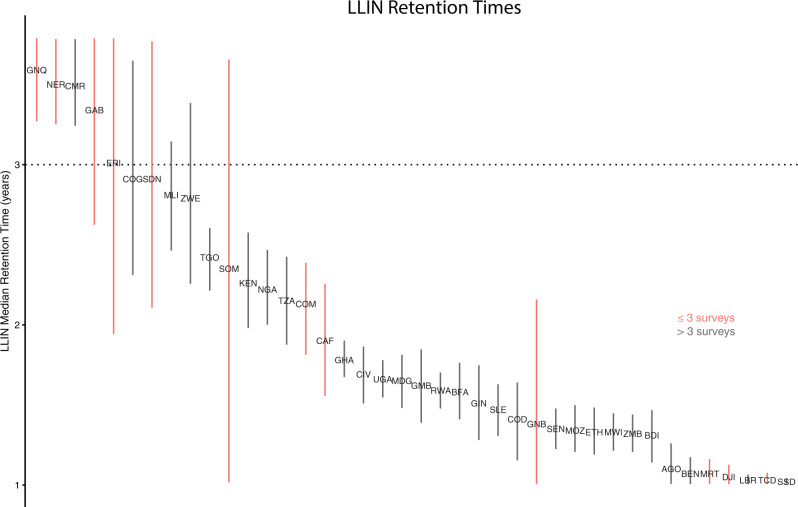
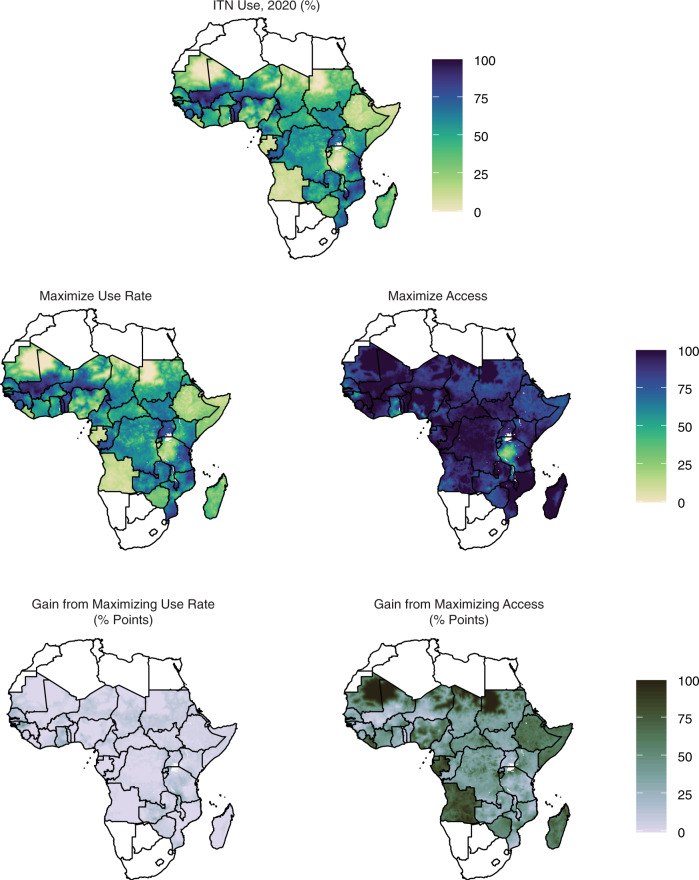
Insecticide-treated nets (ITNs) are one of the most widespread and impactful malaria interventions in Africa, yet a spatially-resolved time series of ITN coverage has never been published. Using data from multiple sources, we generate high-resolution maps of ITN access, use, and nets-per-capita annually from 2000 to 2020 across the 40 highest-burden African countries. Our findings support several existing hypotheses: that use is high among those with access, that nets are discarded more quickly than official policy presumes, and that effectively distributing nets grows more difficult as coverage increases. The primary driving factors behind these findings are most likely strong cultural and social messaging around the importance of net use, low physical net durability, and a mixture of inherent commodity distribution challenges and less-than-optimal net allocation policies, respectively. These results can inform both policy decisions and downstream malaria analyses.


Conflict of interest statement

The authors declare no competing interests.

Figures

Fig. 1
Fig. 1. Insecticide-treated net (ITN) model summaries.
a Mechanistic “stock-and-flow” model. For each country (Burkina Faso shown for reference), the number of nets distributed must be no less than the reported distribution count and no more than the available stock (solid bars, left). Net loss follows an S-shaped curve whose steepness is fitted according to survey data (right). If nets were never discarded, net crop would increase cumulatively with every distribution (red line), whereas if nets were discarded immediately, net crop would equal net distribution (purple line). The fitted curve (blue line and 95% confidence interval) balances these two extremes. b Geostatistical regression model. After net crop time series are converted to net access time series, geospatial regression models are run on the difference metrics of “access deviation” and “use gap.” Final maps of ITN access are calculated by adding national access and access deviation, while final maps of ITN use are calculated by adding access and use gap. Maps of nets-per-capita are calculated similarly to access. BFA Burkina Faso, GHA Ghana, TGO Togo, SSD South Sudan. These four access time series are shown as examples, but 40 countries are included in the analysis.
Fig. 2
Fig. 2. National-level insecticide-treated net access and use time series.
National-level mean estimates of access (red curves) and use (blue curves) among the population at risk are shown at a monthly time scale. The dotted lime indicates 80%, commonly used as a benchmark for universal coverage. Squares and triangles indicate nationally representative survey values of access and use, respectively. Only surveys that include spatial information are shown here; surveys included in the stock-and-flow model but not the geospatial model can be found in Supplementary Table 1.l. Shaded areas represent 95% conrfidence intervals. Spikes in coverage indicate mass net distribution campaigns, with coverage subsequently declining due to attrition. The seasonality of use is evident in the curvature of the blue lines. Centr. Afr. Rep. Central African Republic, Rep. of Congo Republic of Congo, DRC Democratic Republic of the Congo.
Fig. 3
Fig. 3. Maps of insecticide-treated net access, use rate, and nets-per-capita (NPC) in 2020, with associated uncertainty.
Access is defined as the proportion of the population that could sleep under a net, assuming one net per two people. The use rate is defined as use among those with access. The uncertainty maps use a bivariate scale to convey information about both mean estimates and magnitude of uncertainty. Quantiles of 95% confidence interval width are represented by saturation level, with the most uncertain values having the lowest saturation. Quantiles of mean values are represented by hue, with low values in pink and high values in dark blue. For example, access estimates are most uncertain in the Democratic Republic of the Congo and Zimbabwe in 2020, but there is considerable certainty that much of northern Mozambique is in the third quartile of use rate.
Fig. 4
Fig. 4. Relationship between access and nets-per-capita (NPC) in 2020.
Each dot represents a modeled country-month, with black dots indicating mean values and gray bars indicating 95% confidence intervals for each metric. The solid line has a slope of 1.8, showing the relationship between NPC and access presumed by population-based net procurement decisions. The blue curve shows a Loess fit through the estimated points. The expected linear relationship between NPC and access holds well at low coverage levels, but the true relationship tapers off at NPC values greater than 0.25 and access over 0.5. This plateauing of access despite high numbers of nets distributed per capita suggests inefficiencies or redundancies in net distribution at these coverage levels, such that those who should be receiving nets are still left without access.
Fig. 5
Fig. 5. Long-lasting insecticide-treated net (LLIN) median retention times.
Stock-and-flow estimates of median LLIN retention time by country, ordered from highest to lowest . Countries are labeled by IS03 code. Country labels are positioned at mean parameter values, while vertical bars indicate 95% confidence interval width. Countries with fewer surveys have less stable model fits (see Supplementary Section 1.6); those having fewer than three surveys are indicated in red. The lower bound of LLIN retention time was capped at 1 year during model fitting. Supplementary Table 1.7 shows all data for this figure in numerical format and maps ISO3 codes to country names.
Fig. 6
Fig. 6. Magnitude of change in insecticide-treated net (ITN) use possible from increasing use rate versus increasing access.
The top row shows estimated ITN use in 2020. The second row shows what use could be if access remained unchanged and the use rate were set to 100% (left), compared to if the use rate remained unchanged and access was set to 100% (right). The final row shows the magnitude gain in use from each of these two scenarios. With few exceptions, increasing access has a larger impact than increasing the use rate.

References

    1. Bhatt S, et al. The effect of malaria control on Plasmodium falciparum in Africa between 2000 and 2015. Nature. 2015;526:207–211. doi: 10.1038/nature15535. - DOI - PMC - PubMed
    1. Yukich JO, et al. Costs and consequences of large-scale vector control for malaria. Malar. J. 2008;7:258. doi: 10.1186/1475-2875-7-258. - DOI - PMC - PubMed
    1. Wisniewski J, Acosta A, Kolaczinski J, Koenker H, Yukich J. Systematic review and meta-analysis of the cost and cost-effectiveness of distributing insecticide-treated nets for the prevention of malaria. Acta Tropica. 2020;202:105229. doi: 10.1016/j.actatropica.2019.105229. - DOI - PubMed
    1. Kilian A, Koenker H, Paintain L. Estimating population access to insecticide-treated nets from administrative data: correction factor is needed. Malar. J. 2013;12:1–10. doi: 10.1186/1475-2875-12-1. - DOI - PMC - PubMed
    1. Koenker H, et al. Assessing whether universal coverage with insecticide-treated nets has been achieved: Is the right indicator being used? Malar. J. 2018;17:355. doi: 10.1186/s12936-018-2505-0. - DOI - PMC - PubMed

Publication types