. 2021 Jun 11;12(1):3576.
doi: 10.1038/s41467-021-23855-w.

Comprehensive micro-scaled proteome and phosphoproteome characterization of archived retrospective cancer repositories

Affiliations

Comprehensive micro-scaled proteome and phosphoproteome characterization of archived retrospective cancer repositories

Corinna Friedrich et al. Nat Commun. .

Abstract

Formalin-fixed paraffin-embedded (FFPE) tissues are a valuable resource for retrospective clinical studies. Here, we evaluate the feasibility of (phospho-)proteomics on FFPE lung tissue regarding protein extraction, quantification, pre-analytics, and sample size. After comparing protein extraction protocols, we use the best-performing protocol for the acquisition of deep (phospho-)proteomes from lung squamous cell and adenocarcinoma with >8,000 quantified proteins and >14,000 phosphosites with a tandem mass tag (TMT) approach. With a microscaled approach, we quantify 7,000 phosphosites, enabling the analysis of FFPE biopsies with limited tissue amounts. We also investigate the influence of pre-analytical variables including fixation time and heat-assisted de-crosslinking on protein extraction efficiency and proteome coverage. Our improved workflows provide quantitative information on protein abundance and phosphosite regulation for the most relevant oncogenes, tumor suppressors, and signaling pathways in lung cancer. Finally, we present general guidelines to which methods are best suited for different applications, highlighting TMT methods for comprehensive (phospho-)proteome profiling for focused clinical studies and label-free methods for large cohorts.


Conflict of interest statement

The authors declare no competing interests.

Figures

Fig. 1
Fig. 1. SDS-SP3 protocol performs best in terms of total identified proteins and identified NSCLC disease-related proteins.
a Comparison of three sample preparation protocols for FFPE proteome analysis. Deparaffinized FFPE lung tissues were lysed with different buffers containing either SDS, SDC, or RapiGest, and detergents were removed before digestion and LC-MS/MS analysis. b Overlap of proteins identified in DTR, SDC, and SDS-SP3 treated samples with NSCLC-relevant proteins highlighted as quality control. * marks proteins only identified but not quantified in any of the groups (27). c Proteins identified from a 1 µg single-shot injection from the samples processed with the three protein extraction protocols, the black bar is showing the mean of the group. Source data are provided as a Source Data file. d Boxplots plots showing the distribution of coefficients of variation (CV) per protein across four replicates for each protocol with boxplots. The plot depicts the 25th and 75th quartile (box), the median (thick black line), the minimum and maximum (whiskers, Q1-1.5*IQR, Q3 + 1.5*IQR), and outliers (dots). Source data are provided as a Source Data file.
Fig. 2
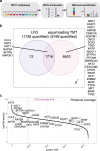
Fig. 2. Deep FFPE proteome coverage with TMT11 labeling and two-dimensional liquid chromatography.
a TMT multiplexing combined with high pH offline fractionation allows for deeper LC-MS/MS coverage while spending less measuring time per individual sample. Multiplexed, TMT-labeled peptide samples are loaded in equal total quantities per TMT-channel and fractionated via two dimensions of liquid chromatography before MS analysis. Increased MS time requirements per TMT experiment for 28 injections are compensated here by multiplexed analysis of up to 11 samples. b Venn diagram showing the overlap of quantified proteins from LFQ and equal loading TMT quantification. NSCLC-relevant markers are shown as quality control. Only unique proteins and no isoforms were counted as quantified proteins. * marks proteins only identified but not quantified with either method (0). c Log10 reporter ion intensity distribution over all proteins that were quantified in equal loading TMT. The LFQ coverage limit is shown in magenta.
Fig. 3
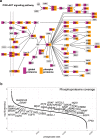
Fig. 3. Phosphoproteome analysis with equal loading TMT11 provides a comprehensive overview of cancer-relevant pathways.
a Most key components of the PI3K-AKT signaling pathway were covered by equal loading TMT on a global proteome (shown in magenta) and phosphoproteome (shown in orange) level. PI3K-Akt signaling pathway was adapted from KEGG pathway hsa04151. b Log10 reporter ion intensity distribution over all phosphosites that were quantified in equal loading TMT. Lung cancer-relevant phosphoproteins are indicated by gene names. A coverage of 15,015 and 15,486 phosphosites was achieved for the two replicates (overlap of 14,133 phosphosites).
Fig. 4
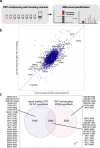
Fig. 4. Deep proteome coverage even from small sample amounts by using a TMT booster sample.
a TMT11 combined with a boosting channel allows for microscaled deep proteome and phosphoproteome analysis of FFPE samples with low sample amounts (20 µg per sample). b Correlation of log2 fold changes of equal loading TMT and micoscaled TMT experiments in FFPE lung cancer samples shows similar quantification results (Pearson correlation coefficient r = 0.67, p < 0.01). NSCLC-relevant proteins are highlighted, all other proteins are shown in blue. Source data are provided as a Source Data file. c Venn diagram showing the overlap in quantified phosphosites between equal loading TMT and microscaled TMT with highlighted phosphosites on NSCLC-relevant proteins and oncogenes. * marks phosphosites not quantified with either method (0).
Fig. 5
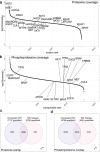
Fig. 5. Deep proteome and phosphoproteome from FFPE needle biopsies.
a Log10 reporter ion intensity distribution over all proteins that were quantified in TMT biopsies. Source data are provided as a Source Data file. b Log10 reporter ion intensity distribution over all phosphosites that were quantified in TMT biopsies. Source data are provided as a Source Data file. c Venn diagram showing the overlap of quantified proteins between microscaled TMT and TMT biopsies. Only unique proteins and no isoforms were counted as quantified proteins. * marks proteins not quantified with either method (0). d Venn diagram showing the overlap of quantified phosphosites between microscaled TMT and TMT biopsies. * marks phosphosites not quantified with either method (0).
Fig. 6
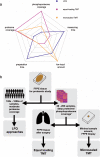
Fig. 6. Guidelines for LFQ, equal loading TMT, and microscaled TMT proteome/phosphoproteome analysis in different settings.
a A spider plot showing the strengths and weaknesses of the three quantification methods presented in this study (LFQ in blue, equal loading TMT in magenta, and microscaled TMT in orange). From the inside to the outside the nodes represent quantities for the proteome between 1000 and 8000 proteins, for the phosphoproteome between 1000 and 14,000 phosphosites, for the mass spectrometry measuring time 7 and 1 h, for the low input material between 200 and 20 µg of total protein, and for the sample preparation time 50–10 h in the laboratory. For detailed values see supplementary Fig. 12B. b Flowchart for choosing a suitable quantification method for retrospective FFPE studies depending on the desired throughput and available sample amount. *Equal loading and microscaled TMT proteome analyses are recommended for 20–200 samples, microscaled TMT phosphoproteome analysis is recommended for 20–50 samples.

References

    1. Zhang H, et al. Integrated proteogenomic characterization of human high-grade serous ovarian cancer. Cell. 2016;166:755–765. doi: 10.1016/j.cell.2016.05.069. - DOI - PMC - PubMed
    1. Mertins P, et al. Proteogenomics connects somatic mutations to signalling in breast cancer. Nature. 2016;534:55–62. doi: 10.1038/nature18003. - DOI - PMC - PubMed
    1. Vasaikar S, et al. Proteogenomic analysis of human colon cancer reveals new therapeutic opportunities. Cell. 2019;177:1035–1049.e19. doi: 10.1016/j.cell.2019.03.030. - DOI - PMC - PubMed
    1. Treue D, et al. Proteogenomic systems analysis identifies targeted therapy resistance mechanisms in EGFR-mutated lung cancer. Int. J. Cancer. 2018;144:545–557. doi: 10.1002/ijc.31845. - DOI - PubMed
    1. Mertins P, et al. Ischemia in tumors induces early and sustained phosphorylation changes in stress kinase pathways but does not affect global protein levels. Mol. Cell. Proteom. 2014;13:1690–1704. doi: 10.1074/mcp.M113.036392. - DOI - PMC - PubMed

Publication types