. 2021 Nov 5;22(6):bbab221.
doi: 10.1093/bib/bbab221.

A new method to accurately identify single nucleotide variants using small FFPE breast samples

Affiliations

A new method to accurately identify single nucleotide variants using small FFPE breast samples

Angelo Fortunato et al. Brief Bioinform. .

Abstract

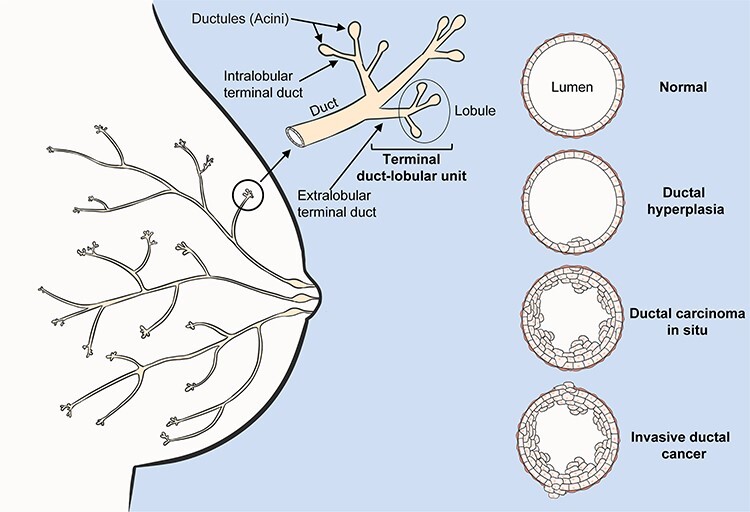
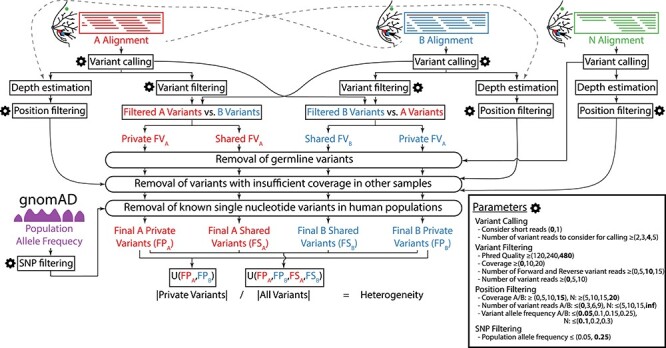
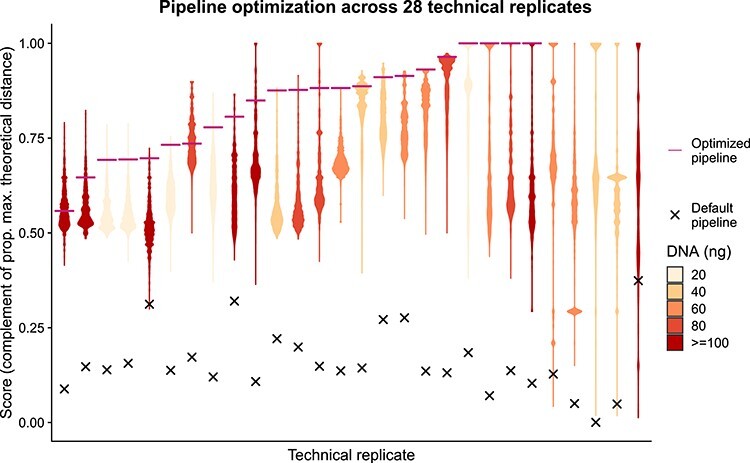
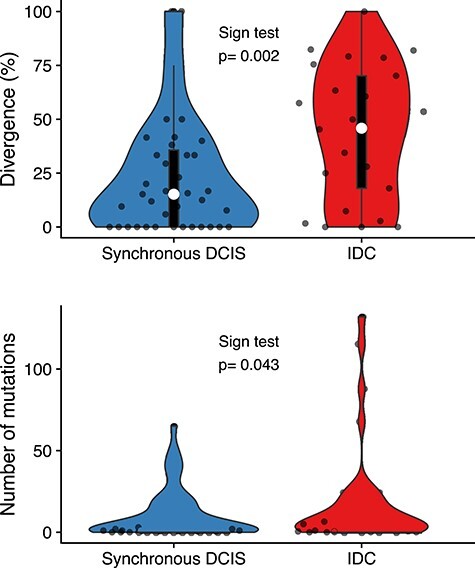
Most tissue collections of neoplasms are composed of formalin-fixed and paraffin-embedded (FFPE) excised tumor samples used for routine diagnostics. DNA sequencing is becoming increasingly important in cancer research and clinical management; however it is difficult to accurately sequence DNA from FFPE samples. We developed and validated a new bioinformatic pipeline to use existing variant-calling strategies to robustly identify somatic single nucleotide variants (SNVs) from whole exome sequencing using small amounts of DNA extracted from archival FFPE samples of breast cancers. We optimized this strategy using 28 pairs of technical replicates. After optimization, the mean similarity between replicates increased 5-fold, reaching 88% (range 0-100%), with a mean of 21.4 SNVs (range 1-68) per sample, representing a markedly superior performance to existing tools. We found that the SNV-identification accuracy declined when there was less than 40 ng of DNA available and that insertion-deletion variant calls are less reliable than single base substitutions. As the first application of the new algorithm, we compared samples of ductal carcinoma in situ of the breast to their adjacent invasive ductal carcinoma samples. We observed an increased number of mutations (paired-samples sign test, P < 0.05), and a higher genetic divergence in the invasive samples (paired-samples sign test, P < 0.01). Our method provides a significant improvement in detecting SNVs in FFPE samples over previous approaches.

Keywords: DCIS; NGS; exome; heterogeneity.


Figures

Figure 1
Figure 1
Breast cancer anatomy. Schematic representation of mammary gland anatomy and cancer development. The majority of breast tumors develop in the terminal duct lobular unit, 80% starting among ductal cells. Initially, the duct suffers a benign hypertrophic growth of cells that can progress into ductal carcinoma in situ (DCIS). In this phase the neoplasm is confined within the duct’s lumen and it is still clinically benign. Cancer cells can cross the duct wall’s boundaries, invading nearby tissues (IDC) and metastasizing.
Figure 2
Figure 2
Flowchart of the algorithm used to estimate the genetic heterogeneity between two samples and details of its optimization. Inputs: aligned sequences (BAM files) of the two samples (A, in red; and B, in blue) and their healthy tissue control (N, in green), population allele frequency data from the gnomAD database (single nucleotide polymorphisms, SNPs, in purple), and user-specified configuration parameters (gear icon). Outputs: estimate of the genetic heterogeneity between samples A and B and set of variants (level of detail user-specified). All parameters that control this pipeline are detailed in the Parameters box, accompanied by the range of values assayed during optimization between parentheses and the final set of optimized values in bold. The key step of this algorithm is the generation of two sets of private and common variants by comparing the variants in the two samples twice, alternatively filtering one of the sets and using all variants from the other.
Figure 3
Figure 3
Empirical optimization of the variant postprocessing algorithm. Each violin plot summarizes the distribution of optimization scores of 5 308 416 combinations of values of the 13 parameters that control the pipeline for one of the 28 technical replicates (same DNA sample processed twice independently). The optimization score indicates the two-dimensional euclidean distance to the theoretical optimum value of similarity between technical replicates (1) and proportion of final common variants that have a population allele frequency below 0.05 (1) relative to the maximum possible distance. After parameter optimization the similarity between the technical replicates was on average 88%, range 0–100% (x = score before optimization; —: score after optimization; colors indicate the amount (ng) of DNA used as template).
Figure 4
Figure 4
Mutational burden and genetic divergence. The average of the number of mutations of synchronous DCIS samples (10.40 ± 15.31 SD) is lower than the IDC samples (18.05 ± 31.48 SD) and there is a statistically significant difference between the two groups, paired-samples sign test, P < 0.05. We found a statistically significant difference in genetic divergence comparing two regions of synchronous DCIS (21.48% ± 17.54 SD) versus the divergence between synchronous DCIS IDC samples (44.51% ± 29.04 SD) within the same patient, paired-sample sign test and Mann–Whitney U test, P < 0.01. White circle = median, box limits indicate the 25th and 75th percentiles; whiskers extend 1.5 times the interquartile range from the 25th and 75th percentiles; curves represent density and extend to extreme values. Data points are plotted as dots.

References

    1. Marusyk A, Polyak K. Tumor heterogeneity: causes and consequences. Biochim Biophys Acta 2010;1805:105–17. - PMC - PubMed
    1. McGranahan N, Swanton C. Biological and therapeutic impact of intratumor heterogeneity in cancer evolution. Cancer Cell 2015;27:15–26. - PubMed
    1. Andor N, Graham TA, Jansen M, et al. . Pan-cancer analysis of the extent and consequences of intratumor heterogeneity. Nat Med 2016;22:105–13. - PMC - PubMed
    1. Morris LG, Riaz N, Desrichard A, et al. . Pan-cancer analysis of intratumor heterogeneity as a prognostic determinant of survival. Oncotarget 2016;7:10051–63. - PMC - PubMed
    1. Bedard PL, Hansen AR, Ratain MJ, et al. . Tumour heterogeneity in the clinic. Nature 2013;501:355–64. - PMC - PubMed

Publication types