

Performance of nanoScan PET/CT and PET/MR for quantitative imaging of 18F and 89Zr as compared with ex vivo biodistribution in tumor-bearing mice
- PMID: 34117946
- PMCID: PMC8197690
- DOI: 10.1186/s13550-021-00799-2
Performance of nanoScan PET/CT and PET/MR for quantitative imaging of 18F and 89Zr as compared with ex vivo biodistribution in tumor-bearing mice
Abstract
Introduction: The assessment of ex vivo biodistribution is the preferred method for quantification of radiotracers biodistribution in preclinical models, but is not in line with current ethics on animal research. PET imaging allows for noninvasive longitudinal evaluation of tracer distribution in the same animals, but systemic comparison with ex vivo biodistribution is lacking. Our aim was to evaluate the potential of preclinical PET imaging for accurate tracer quantification, especially in tumor models.
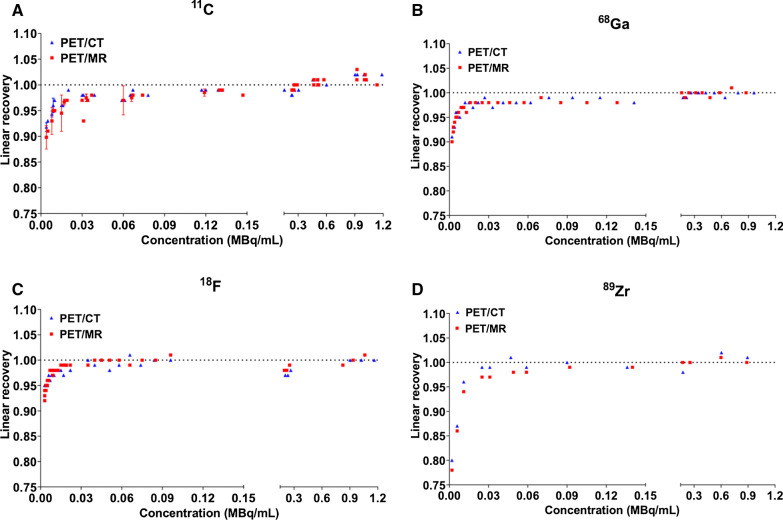
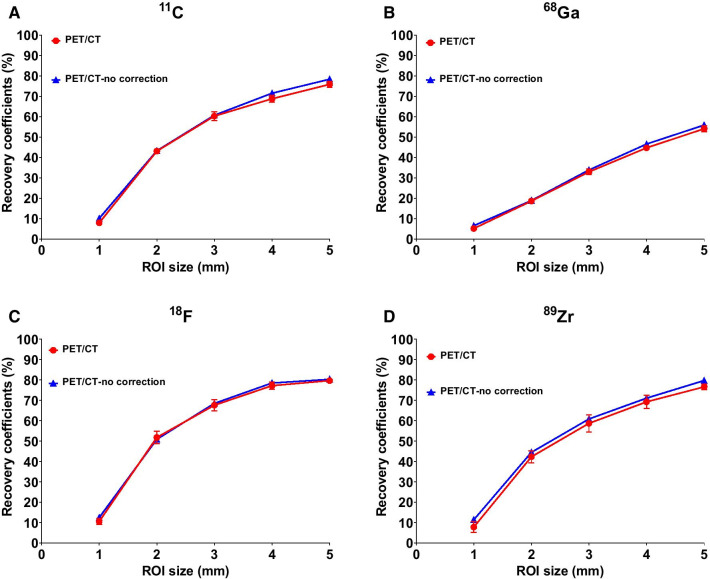
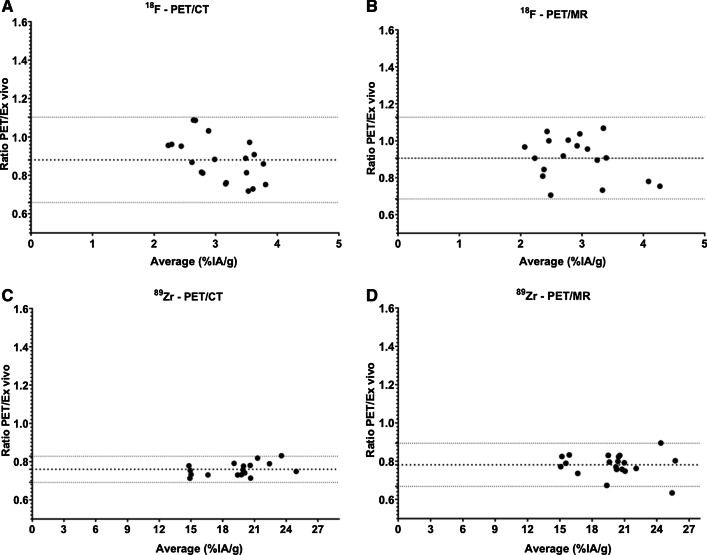
Methods: NEMA NU 4-2008 phantoms were filled with 11C, 68Ga, 18F, or 89Zr solutions and scanned in Mediso nanoPET/CT and PET/MR scanners until decay. N87 tumor-bearing mice were i.v. injected with either [18F]FDG (~ 14 MBq), kept 50 min under anesthesia followed by imaging for 20 min, or with [89Zr]Zr-DFO-NCS-trastuzumab (~ 5 MBq) and imaged 3 days post-injection for 45 min. After PET acquisition, animals were killed and organs of interest were collected and measured in a γ-counter to determine tracer uptake levels. PET data were reconstructed using TeraTomo reconstruction algorithm with attenuation and scatter correction and regions of interest were drawn using Vivoquant software. PET imaging and ex vivo biodistribution were compared using Bland-Altman plots.
Results: In phantoms, the highest recovery coefficient, thus the smallest partial volume effect, was obtained with 18F for both PET/CT and PET/MR. Recovery was slightly lower for 11C and 89Zr, while the lowest recovery was obtained with 68Ga in both scanners. In vivo, tumor uptake of the 18F- or 89Zr-labeled tracer proved to be similar irrespective whether quantified by either PET/CT and PET/MR or ex vivo biodistribution with average PET/ex vivo ratios of 0.8-0.9 and a deviation of 10% or less. Both methods appeared less congruent in the quantification of tracer uptake in healthy organs such as brain, kidney, and liver, and depended on the organ evaluated and the radionuclide used.
Conclusions: Our study suggests that PET quantification of 18F- and 89Zr-labeled tracers is reliable for the evaluation of tumor uptake in preclinical models and a valuable alternative technique for ex vivo biodistribution. However, PET and ex vivo quantification require fully described experimental and analytical procedures for reliability and reproducibility.
Keywords: Ex vivo biodistribution; PET-CT; PET-MRI; Preclinical imaging; Quantification.
Conflict of interest statement
The authors do not have any conflict of interest.
Figures

References
Grants and funding
LinkOut - more resources
Full Text Sources
Research Materials
