. 2021 Oct 1;1863(10):183677.
doi: 10.1016/j.bbamem.2021.183677. Epub 2021 Jun 9.

Nonlinear material and ionic transport through membrane nanotubes

Affiliations

Nonlinear material and ionic transport through membrane nanotubes

D V Ivchenkov et al. Biochim Biophys Acta Biomembr. .

Abstract

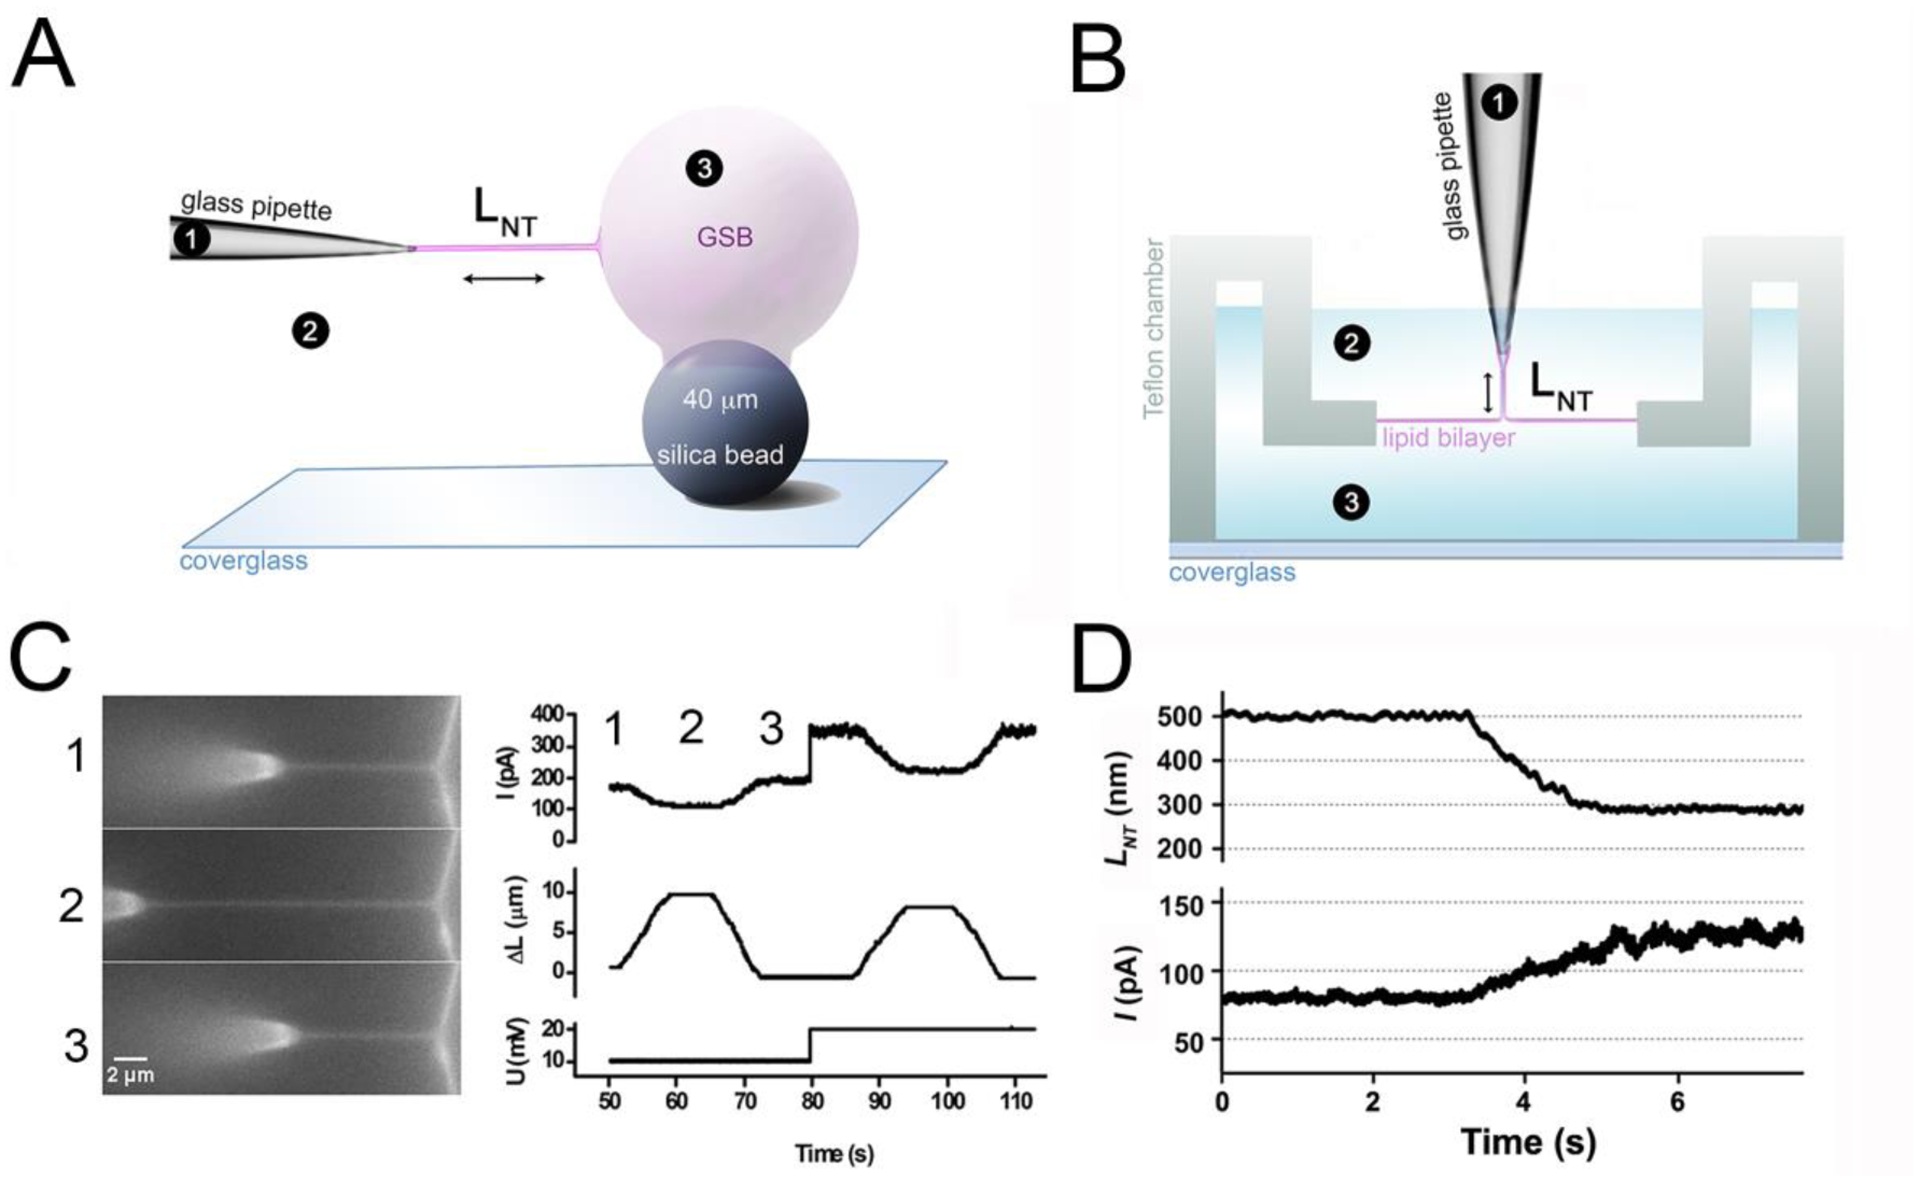
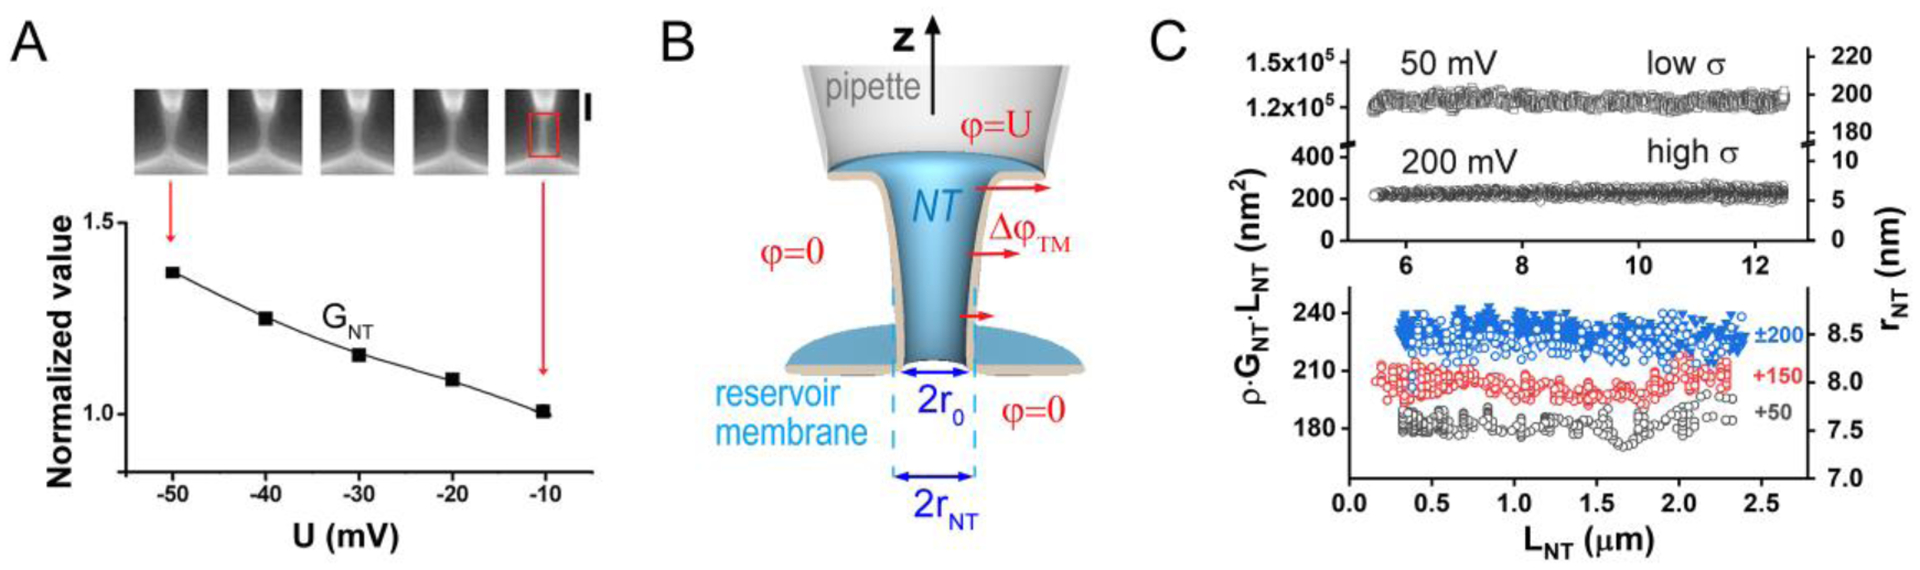
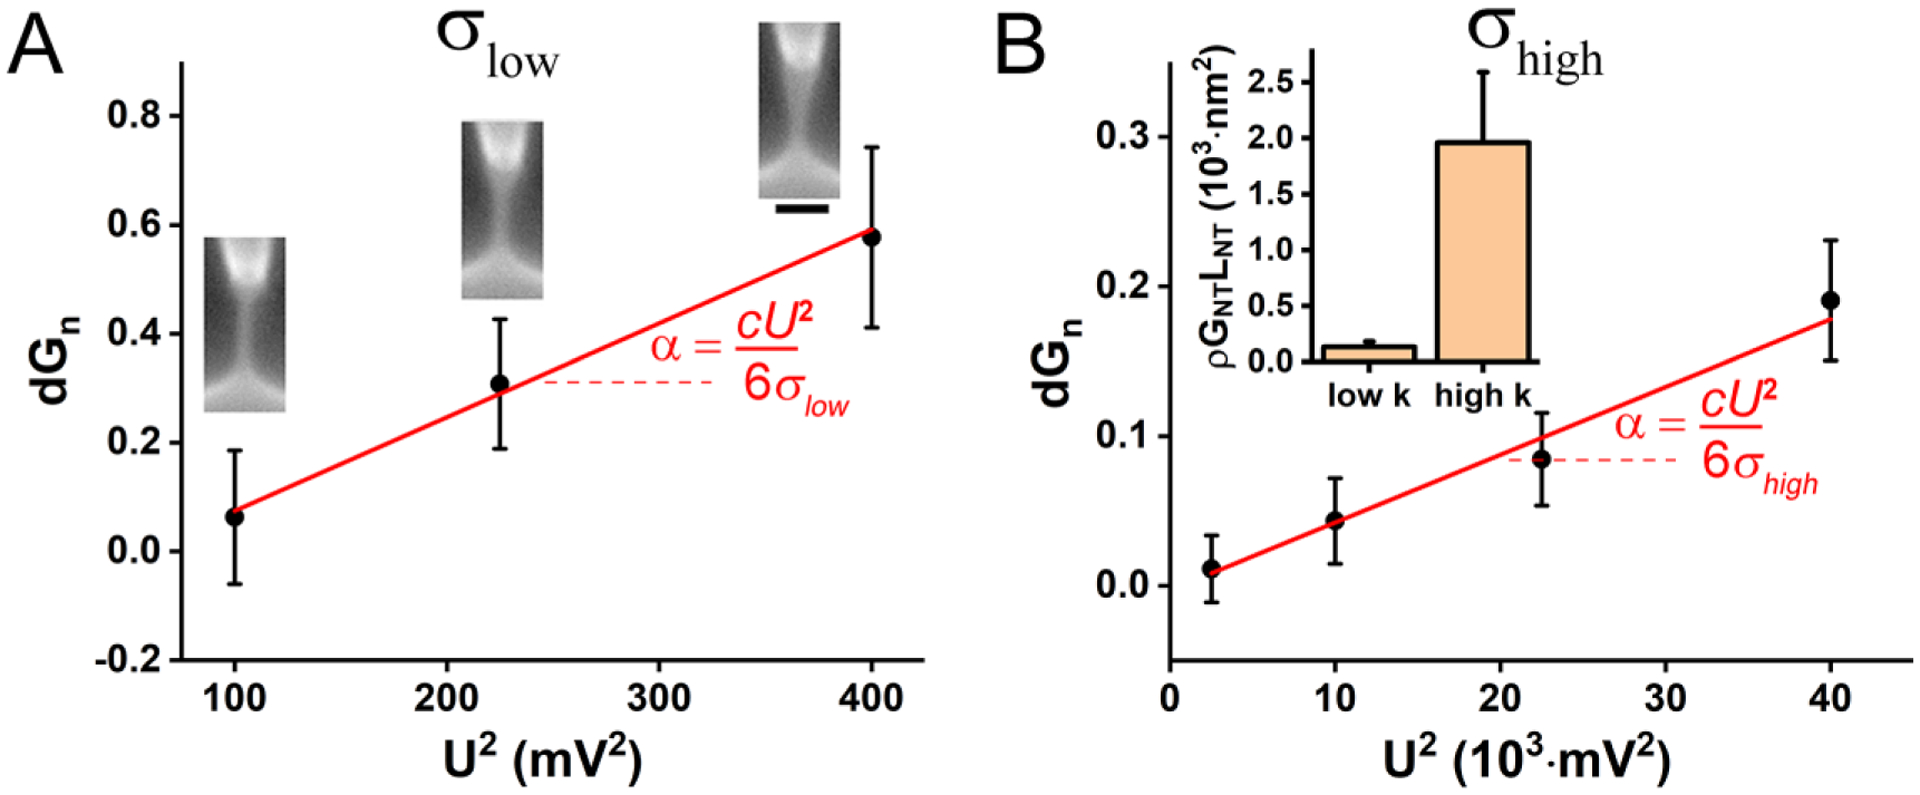
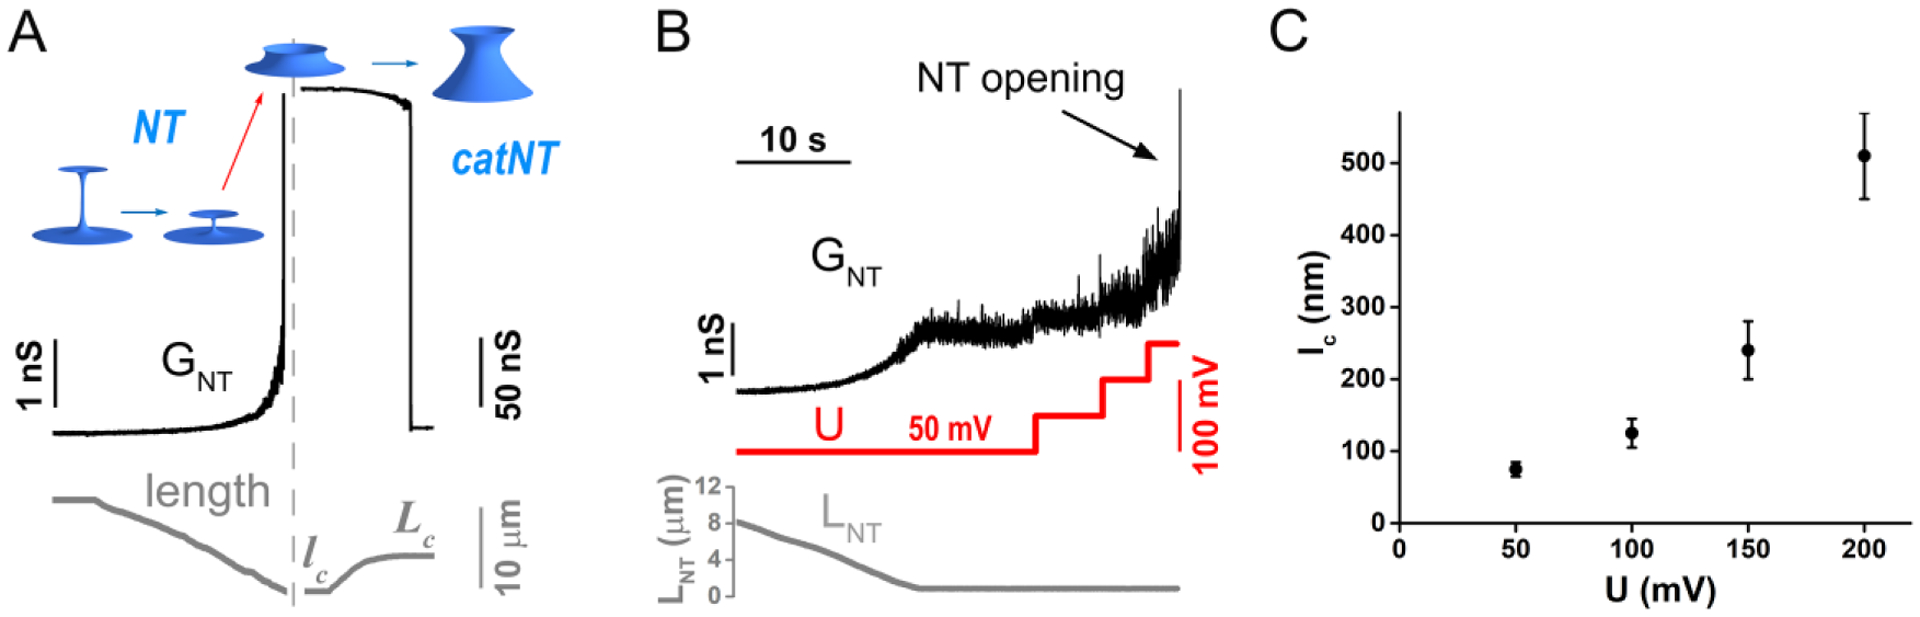
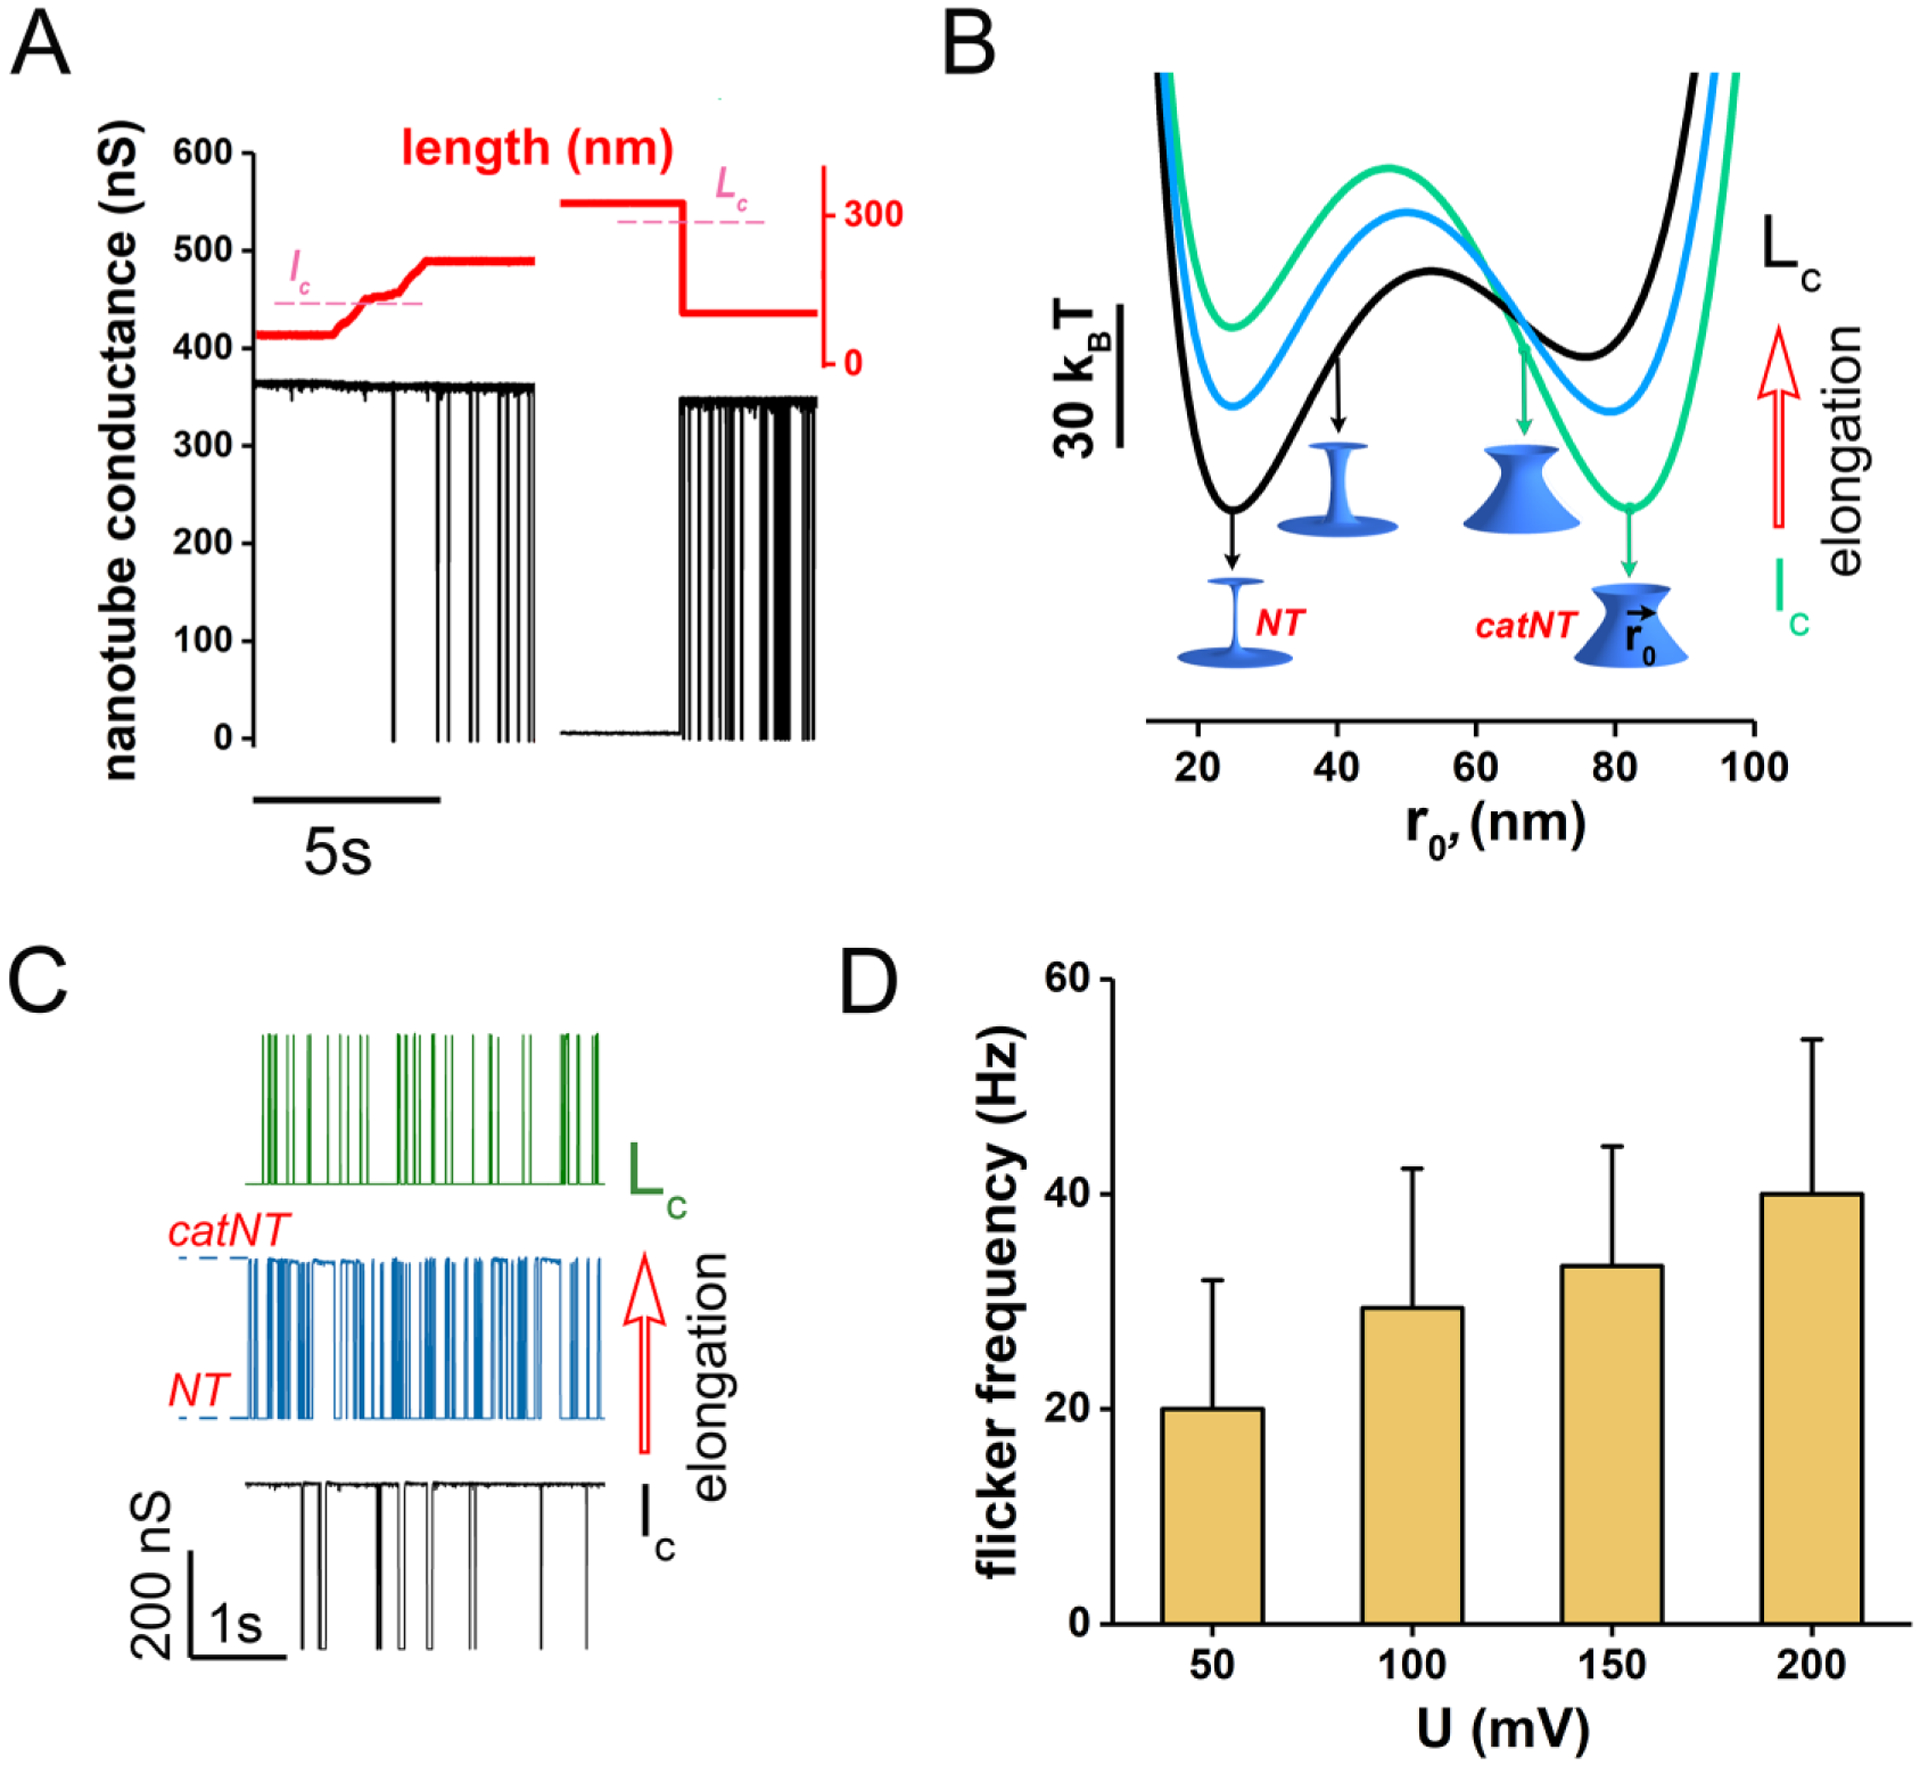
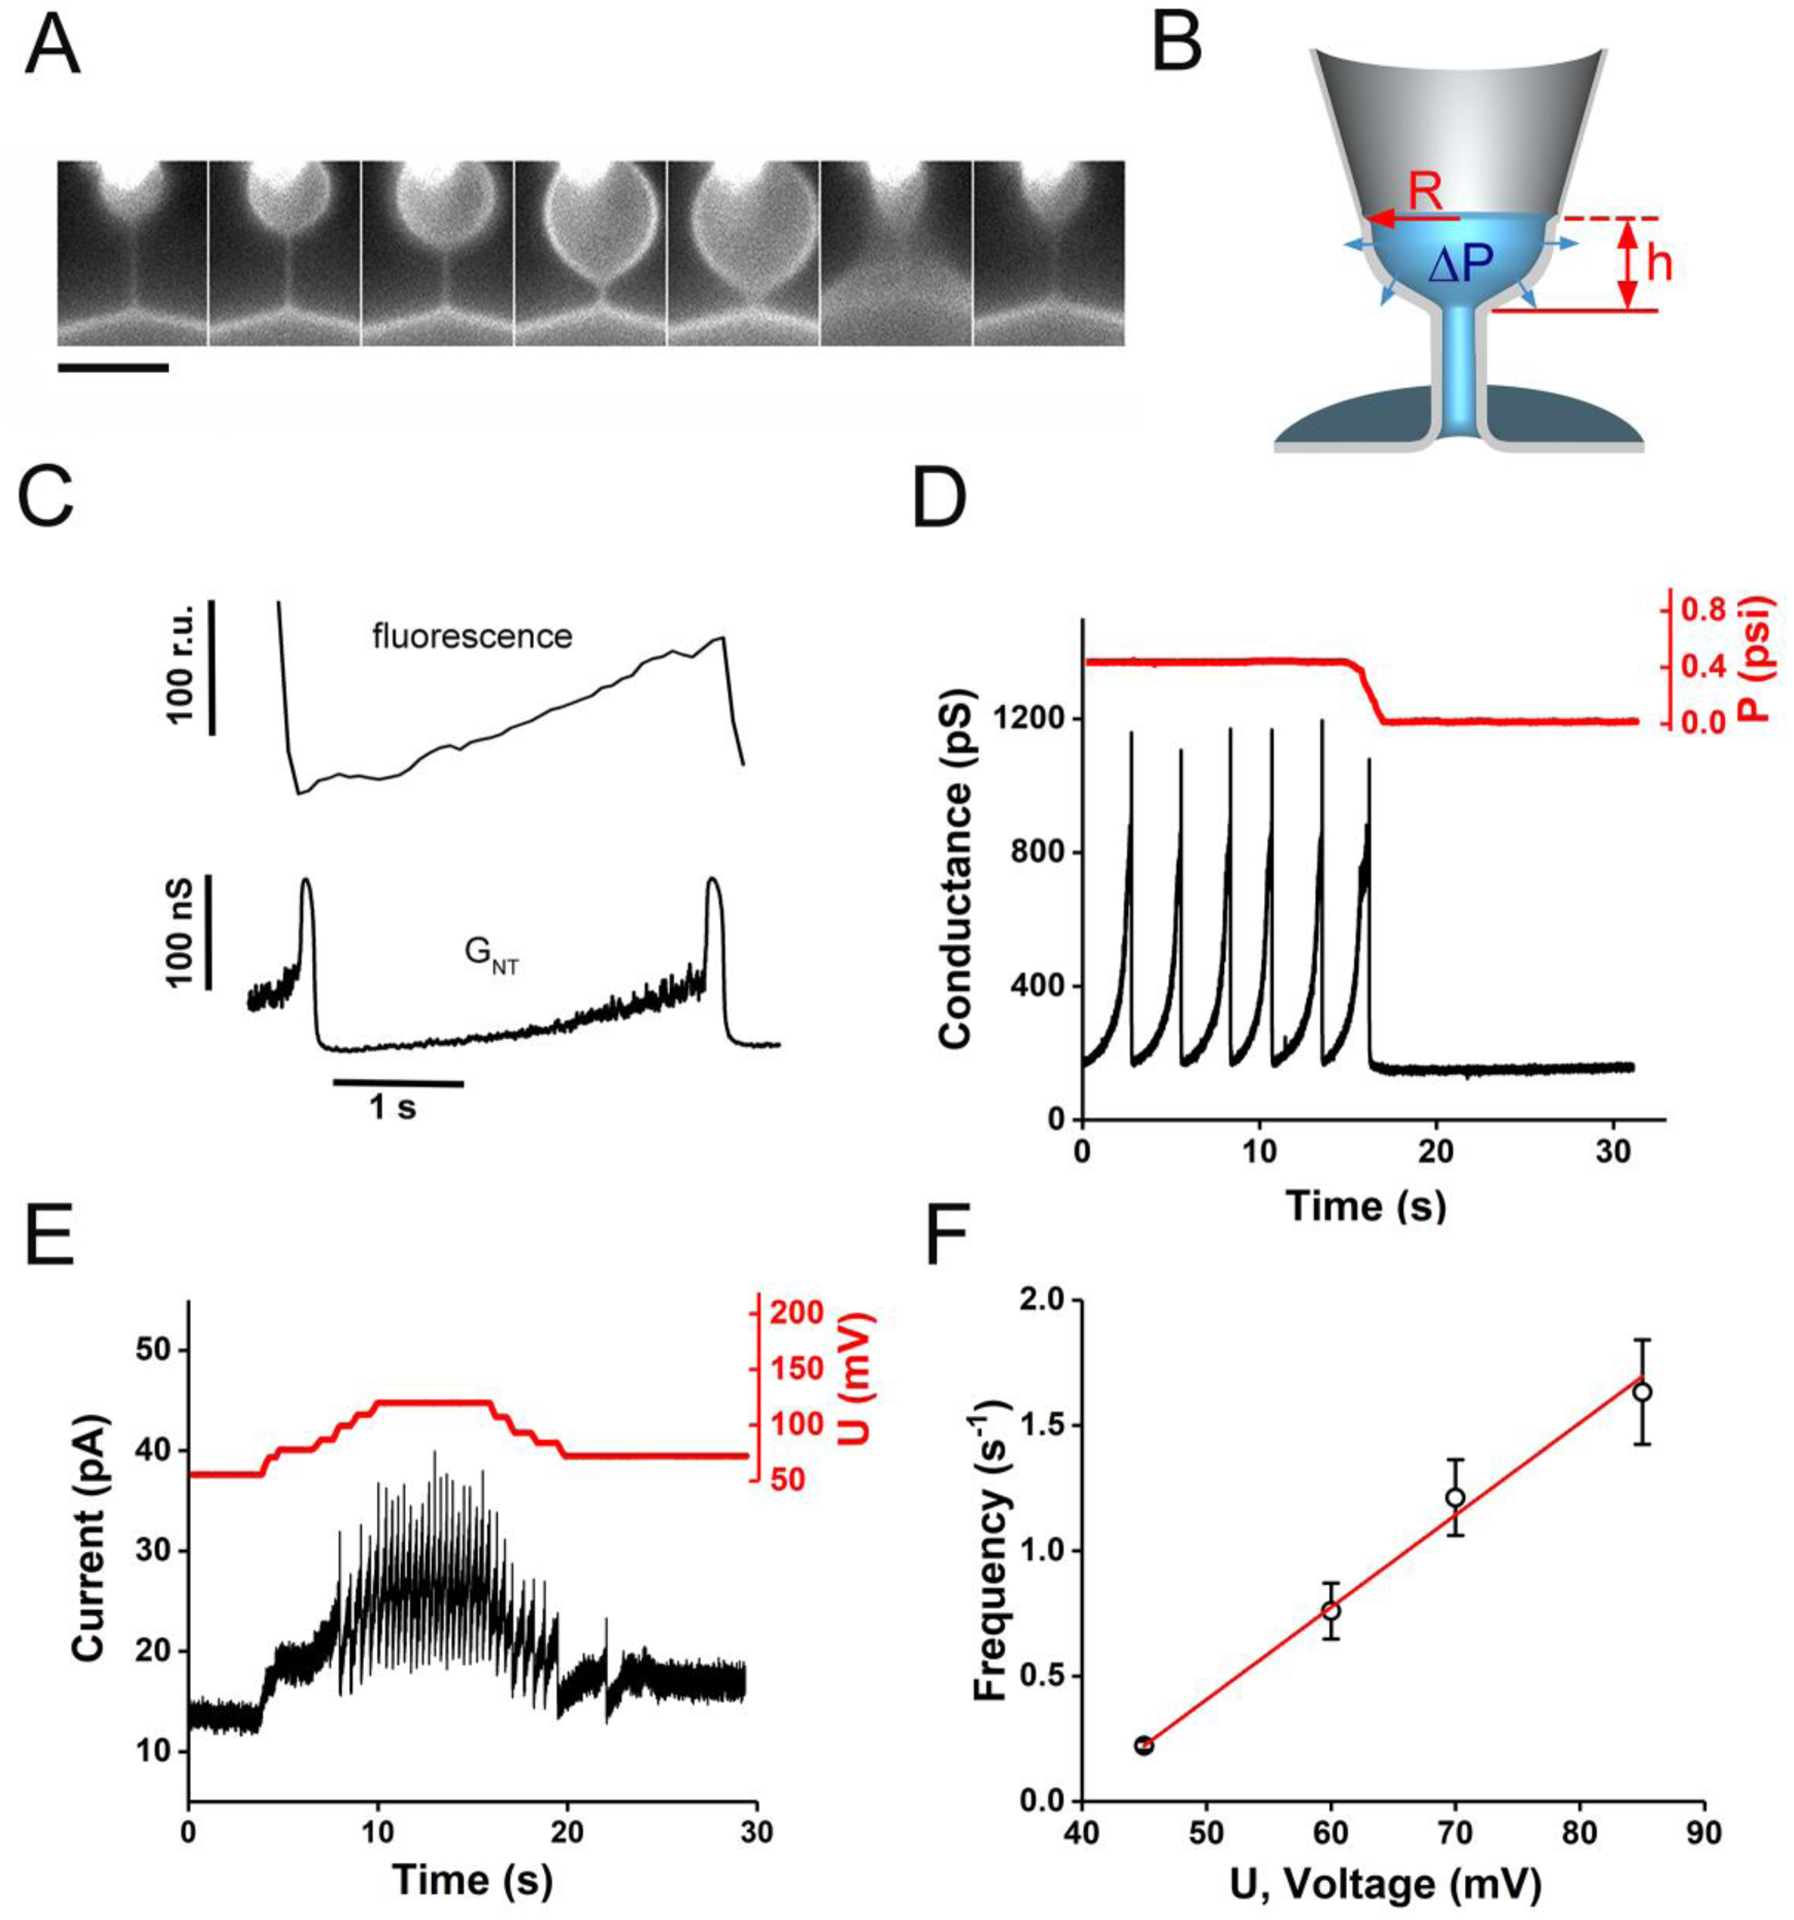
Membrane nanotubes (NTs) and their networks play an important role in intracellular membrane transport and intercellular communications. The transport characteristics of the NT lumen resemble those of conventional solid-state nanopores. However, unlike the rigid pores, the soft membrane wall of the NT can be deformed by forces driving the transport through the NT lumen. This intrinsic coupling between the NT geometry and transport properties remains poorly explored. Using synchronized fluorescence microscopy and conductance measurements, we revealed that the NT shape was changed by both electric and hydrostatic forces driving the ionic and solute fluxes through the NT lumen. Far from the shape instability, the strength of the force effect is determined by the lateral membrane tension and is scaled with membrane elasticity so that the NT can be operated as a linear elastic sensor. Near shape instabilities, the transport forces triggered large-scale shape transformations, both stochastic and periodic. The periodic oscillations were coupled to a vesicle passage along the NT axis, resembling peristaltic transport. The oscillations were parametrically controlled by the electric field, making NT a highly nonlinear nanofluidic circuitry element with biological and technological implications.

Keywords: Electro-actuation; Membrane elasticity; Membrane nanotube; Nanofluidic transport; Shape bistability.


Conflict of interest statement

Declaration of interests

The authors declare that they have no known competing financial interests or personal relationships that could have appeared to influence the work reported in this paper.

Figures

Figure 1.
Figure 1.
Formation of lipid membrane NTs. A, B Cartoons depicting the NTs in the GSB (A) and planar lipid bilayer (B) systems. The NT connects the glass patch-pipette to the corresponding reservoir membrane. The holding potential U is applied to the electrode placed in the patch-pipette (compartment 1), the electrode also operates as a measuring electrode collecting the current through the NT lumen [17]. Compartments 2 and 3 are electrically isolated from compartment 1 and held at zero potential. In the GSB system, the GSB interior is connected to the external media via a low-resistance conductive path forming in the GSB-silica bead contact [22]. A calibrated nanoactuator is used to control the position of the patch-pipette and thus the NT length, LNT [17] B. An example of synchronized fluorescence microscopy and conductance measurements [22]. The movement of the patch-pipette produces changes in the NT length. The corresponding changes in the ionic current through the NT lumen are shown on the right. The NT conductance is obtained from the current/voltage dependence as described elsewhere [17]. D. Changes of the NT current upon submicron decrease of the NT length in the planar bilayer system.
Figure 2.
Figure 2.
Field-effect on the shape and conductance of cylindrical NT. A. Application of increasing holding potential (U) causes the NT dilation seen in the fluorescence microscopy images (above) and as the increase of the NT conductance with the voltage amplitude. Membrane fluorescence (Rh-DOPE) is shown, scale bar 2 μm. B. Schematic illustration of the NT dilation by the transmembrane voltage φ(z) decreasing along the NT axis from the maximal value U to zero. The widening is maximal at φ(z)=U and gradually decreases to zero at φ(z)=0; rc is the radius of unperturbed cylindrical NT, rNT is the radius of a cylindrical NT having the same length, luminal volume, and conductance as the voltage-expanded NT. C. Upper graph: dependence of GNT·LNT (left y-axis) and rNT (right y-axis) on LNT measured for the NTs pulled from the GSB (low σ) and planar lipid bilayer (high σ) reservoirs. Lower graph: the dependence of GNT·LNT (left y-axis) and rNT (right y-axis) on LNT measured at different U (+50 mV black, +150 mV red, ±200 mV blue, with open circles and filled triangles showing the effect of positive and negative voltage respectively).
Figure 3.
Figure 3.
Relative increase of the NT conductance dGn=GNT(U)GNT(0)GNT(0) by the electric field bias (U) driving the ionic current through the NT lumen. A. The conductance increase in the GSB system. The fluorescence images illustrate the NT dilation by the field. Membrane fluorescence (Rh-DOPE) is shown, scale bar 2 μm. (B) The conductance increase and in the planar lipid bilayer system. The inset shows the mean values of ρGcLNT measured for the lipid membranes with low and high bending rigidity k.
Figure 4.
Figure 4.
The transformation of the NT to wider catNT induced by the electric field A. Decrease of the NT length towards the critical length lc triggers spontaneous transformation (opening) of the NT to a wider catNT. The increase of the catNT length from lc towards Lc causes the reverse transformation [35]. B. The conductance (GNT, black) changes during the decrease of the NT length (LNT, grey) followed by the stepwise application of progressively higher holding potential (U, red) leading to the NT opening. C. Dependence the NT length at which the opening (B) occurred on the holding potential U.
Figure 5.
Figure 5.
Field-controlled conductance oscillations of the shape-bistable nanotube. A. Appearance of the large conductance oscillations upon driving the nanotube into the shape bistability region by either increasing the catNT length (left) or decreasing the NT length (right). B. The energy diagram illustrating the shape bistability of the nanotube [35]. The energy is parameterized by the luminal radius r0 measured at the narrowest cross-section of the nanotube. A symmetric system was considered for simplicity, with the endrings’ diameter of 240 nm and the cylindrical NT diameter of 20 nm. Two energy minima corresponding to the NT and catNT are seen. The energy branches corresponding to the variations of the NT and catNT shapes (depicted by the blue shapes) were calculated as described in the text. Black, blue and green curves illustrate energy profile alteration with the length change from sub-lc to sub-Lc. C. Spontaneous conductance oscillations within the bistability region. Black, blue and green graphs show the conductance behavior characteristic for the free energy profiles of the corresponding colors shown in (B). D. Voltage dependence of the oscillation frequency.
Figure 6.
Figure 6.
Periodic oscillations of the NT shape and conductance coupled to pressure-driven transport through the NT lumen. A. Fluorescence microscopy images illustrating appearance, growth and collapse of the membrane vesicle driven by the hydrostatic pressure applied to the patch-pipette interior. Membrane fluorescence (Rh-DOPE) is shown, scale bar 10 μm. B. The cartoon illustrates the vesicle growth from the patch-pipette tip (of radius Rp) under the hydrostatic pressure (ΔP) action. The spherical segment of height h parameterizes the vesicle size. C. Changes of the ionic current through the NT lumen and total membrane fluorescence of the NT and vesicle system during the vesicle passage through the NT axis as shown in (A). D. The dependence of the NT conductance (black) on the hydrostatic pressure difference ΔP (red). The conductance oscillation seen under high ΔP disappear upon the pressure reduction. E. The electric field application affects both the appearance and the frequency of the conductance oscillations. F. The dependence of the frequency (f) of the conductance oscillations on U for short NT (1.33Lc<LNT<2Lc) with hydrostatic pressure approaching the critical value 2σ0R, experimental mean values (black) and the linear fit (red, Eq. 15 with f=1/T was used) are shown.

Similar articles

Cited by

References

    1. Nehls S, Snapp EL, Cole NB, Zaal KJ, Kenworthy AK, Roberts TH, Ellenberg J, Presley JF, Siggia E, Lippincott-Schwartz J, Dynamics and retention of misfolded proteins in native ER membranes., Nat. Cell Biol 2 (2000) 288–295. 10.1038/35010558. - DOI - PubMed
    1. Dayel MJ, Hom EF, Verkman AS, Diffusion of green fluorescent protein in the aqueous-phase lumen of endoplasmic reticulum., Biophys. J 76 (1999) 2843–2851. 10.1016/S0006-3495(99)77438-2. - DOI - PMC - PubMed
    1. Holcman D, Parutto P, Chambers JE, Fantham M, Young LJ, Marciniak SJ, Kaminski CF, Ron D, Avezov E, Single particle trajectories reveal active endoplasmic reticulum luminal flow, Nat. Cell Biol 20 (2018) 1118–1125. 10.1038/s41556-018-0192-2. - DOI - PMC - PubMed
    1. Shnyrova AV, Frolov VA, Zimmerberg J, Domain-Driven Morphogenesis of Cellular Membranes, Curr. Biol 19 (2009). 10.1016/j.cub.2009.07.063. - DOI - PMC - PubMed
    1. Zurzolo C, Tunneling nanotubes: Reshaping connectivity., Curr. Opin. Cell Biol 71 (2021) 139–147. 10.1016/j.ceb.2021.03.003. - DOI - PubMed

Publication types