

Candidate gene screening for lipid deposition using combined transcriptomic and proteomic data from Nanyang black pigs
- PMID: 34118873
- PMCID: PMC8201413
- DOI: 10.1186/s12864-021-07764-2
Candidate gene screening for lipid deposition using combined transcriptomic and proteomic data from Nanyang black pigs
Abstract
Background: Lower selection intensities in indigenous breeds of Chinese pig have resulted in obvious genetic and phenotypic divergence. One such breed, the Nanyang black pig, is renowned for its high lipid deposition and high genetic divergence, making it an ideal model in which to investigate lipid position trait mechanisms in pigs. An understanding of lipid deposition in pigs might improve pig meat traits in future breeding and promote the selection progress of pigs through modern molecular breeding techniques. Here, transcriptome and tandem mass tag-based quantitative proteome (TMT)-based proteome analyses were carried out using longissimus dorsi (LD) tissues from individual Nanyang black pigs that showed high levels of genetic variation.
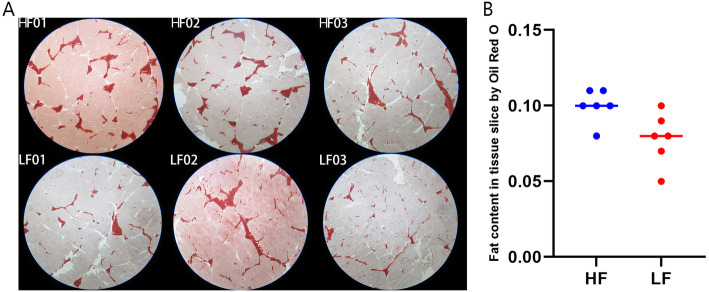
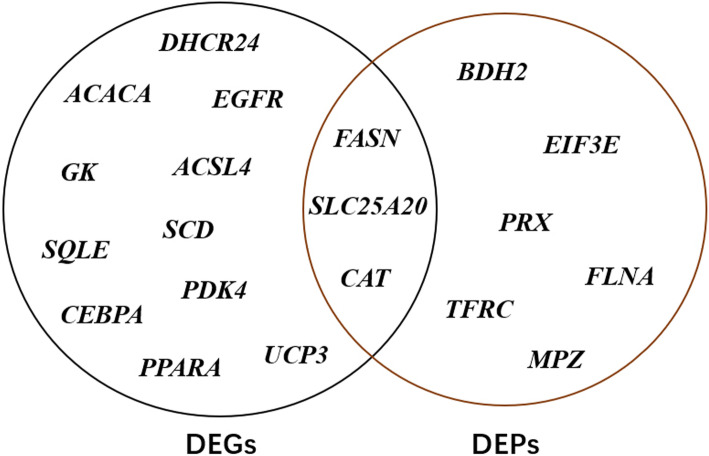
Results: A large population of Nanyang black pigs was phenotyped using multi-production trait indexes, and six pigs were selected and divided into relatively high and low lipid deposition groups. The combined transcriptomic and proteomic data identified 15 candidate genes that determine lipid deposition genetic divergence. Among them, FASN, CAT, and SLC25A20 were the main causal candidate genes. The other genes could be divided into lipid deposition-related genes (BDH2, FASN, CAT, DHCR24, ACACA, GK, SQLE, ACSL4, and SCD), PPARA-centered fat metabolism regulatory factors (PPARA, UCP3), transcription or translation regulators (SLC25A20, PDK4, CEBPA), as well as integrin, structural proteins, and signal transduction-related genes (EGFR).
Conclusions: This multi-omics data set has provided a valuable resource for future analysis of lipid deposition traits, which might improve pig meat traits in future breeding and promote the selection progress in pigs, especially in Nanyang black pigs.
Keywords: Genetic divergence; Lipid deposition; Multi-omics; Nanyang black pig; Phenotypic divergence; Proteome; Transcriptome.
Conflict of interest statement
The authors declare that they have no competing interests.
Figures


Similar articles
-
Identification of differentially expressed genes in longissimus dorsi muscle between Wei and Yorkshire pigs using RNA sequencing.Genes Genomics. 2018 Apr;40(4):413-421. doi: 10.1007/s13258-017-0643-3. Epub 2017 Dec 19. Genes Genomics. 2018. PMID: 29892843
-
Identification of candidate genes that specifically regulate subcutaneous and intramuscular fat deposition using transcriptomic and proteomic profiles in Dingyuan pigs.Sci Rep. 2022 Feb 18;12(1):2844. doi: 10.1038/s41598-022-06868-3. Sci Rep. 2022. PMID: 35181733 Free PMC article.
-
TMT-labeled quantitative proteomic analyses on the longissimus dorsi to identify the proteins underlying intramuscular fat content in pigs.J Proteomics. 2020 Feb 20;213:103630. doi: 10.1016/j.jprot.2019.103630. Epub 2019 Dec 24. J Proteomics. 2020. PMID: 31881348
-
TRIENNIAL GROWTH AND DEVELOPMENT SYMPOSIUM: Molecular mechanisms related to bovine intramuscular fat deposition in the longissimus muscle.J Anim Sci. 2017 May;95(5):2284-2303. doi: 10.2527/jas.2016.1160. J Anim Sci. 2017. PMID: 28727015 Review.
-
Advances in the discovery of genetic elements underlying longissimus dorsi muscle growth and development in the pig.Anim Genet. 2023 Dec;54(6):709-720. doi: 10.1111/age.13365. Epub 2023 Oct 5. Anim Genet. 2023. PMID: 37796678 Review.
Cited by
-
Skeletal muscle lncRNA profile associated with fatty acids in Nellore beef cattle.Sci Rep. 2025 Jul 18;15(1):26109. doi: 10.1038/s41598-025-11179-4. Sci Rep. 2025. PMID: 40681601 Free PMC article.
-
Differences in histomorphology and expression of key lipid regulated genes of four adipose tissues from Tibetan pigs.PeerJ. 2023 Jan 9;11:e14556. doi: 10.7717/peerj.14556. eCollection 2023. PeerJ. 2023. PMID: 36643642 Free PMC article.
-
Transcriptome Profiling of Different Developmental Stages on Longissimus Dorsi to Identify Genes Underlying Intramuscular Fat Content in Wannanhua Pigs.Genes (Basel). 2023 Apr 12;14(4):903. doi: 10.3390/genes14040903. Genes (Basel). 2023. PMID: 37107661 Free PMC article.
-
Comparison of Growth Performance, Carcass Properties, Fatty Acid Profile, and Genes Involved in Fat Metabolism in Nanyang and Landrace Pigs.Genes (Basel). 2024 Jan 30;15(2):186. doi: 10.3390/genes15020186. Genes (Basel). 2024. PMID: 38397176 Free PMC article.
-
Genome-Wide Analysis Reveals Copy Number Variant Gene TGFBR3 Regulates Pig Back Fat Deposition.Animals (Basel). 2024 Sep 12;14(18):2657. doi: 10.3390/ani14182657. Animals (Basel). 2024. PMID: 39335247 Free PMC article.
References
-
- Hausman GJ, Dodson MV, Ajuwon K, Azain M, Barnes KM, Guan LL, Jiang Z, Poulos SP, Sainz RD, Smith S, Spurlock M, Novakofski J, Fernyhough ME, Bergen WG. Board-invited review: the biology and regulation of preadipocytes and adipocytes in meat animals. J Anim Sci. 2009;87(4):1218–1246. doi: 10.2527/jas.2008-1427. - DOI - PubMed
MeSH terms
LinkOut - more resources
Full Text Sources
Molecular Biology Databases
Research Materials
Miscellaneous
