

Linking genomic and physiological characteristics of psychrophilic Arthrobacter to metagenomic data to explain global environmental distribution
- PMID: 34118971
- PMCID: PMC8196931
- DOI: 10.1186/s40168-021-01084-z
Linking genomic and physiological characteristics of psychrophilic Arthrobacter to metagenomic data to explain global environmental distribution
Abstract
Background: Microorganisms drive critical global biogeochemical cycles and dominate the biomass in Earth's expansive cold biosphere. Determining the genomic traits that enable psychrophiles to grow in cold environments informs about their physiology and adaptive responses. However, defining important genomic traits of psychrophiles has proven difficult, with the ability to extrapolate genomic knowledge to environmental relevance proving even more difficult.
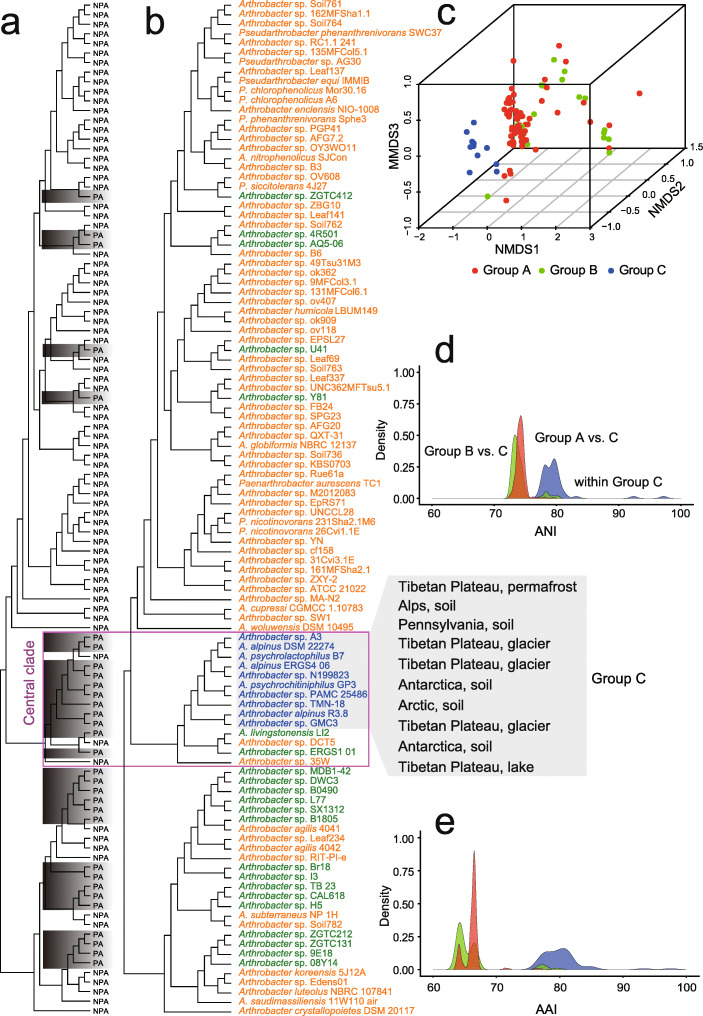
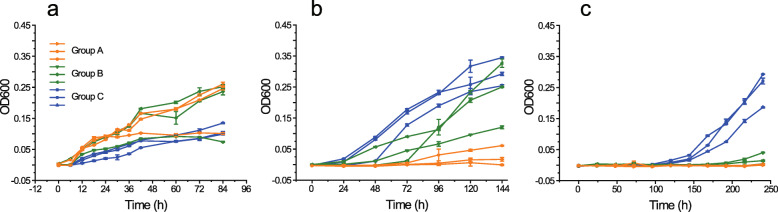
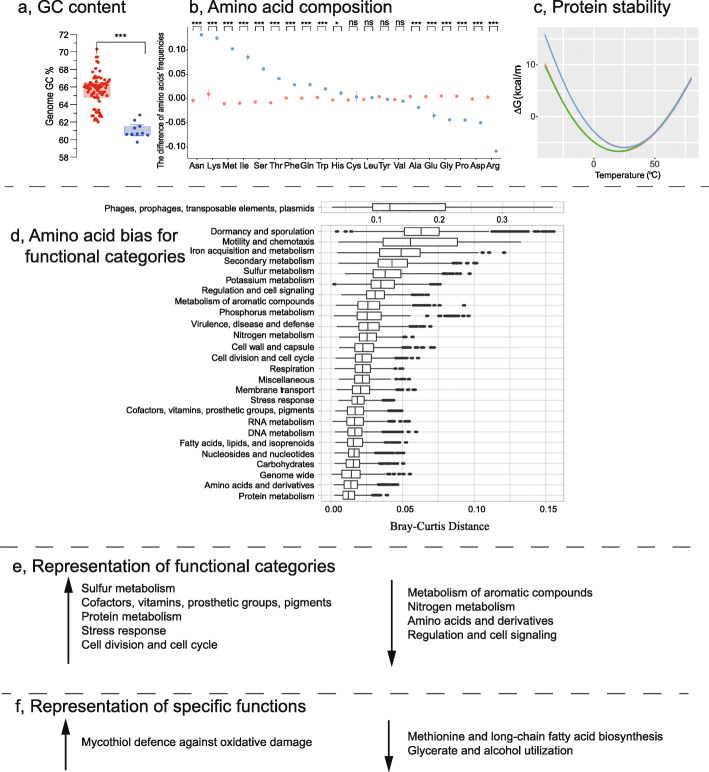
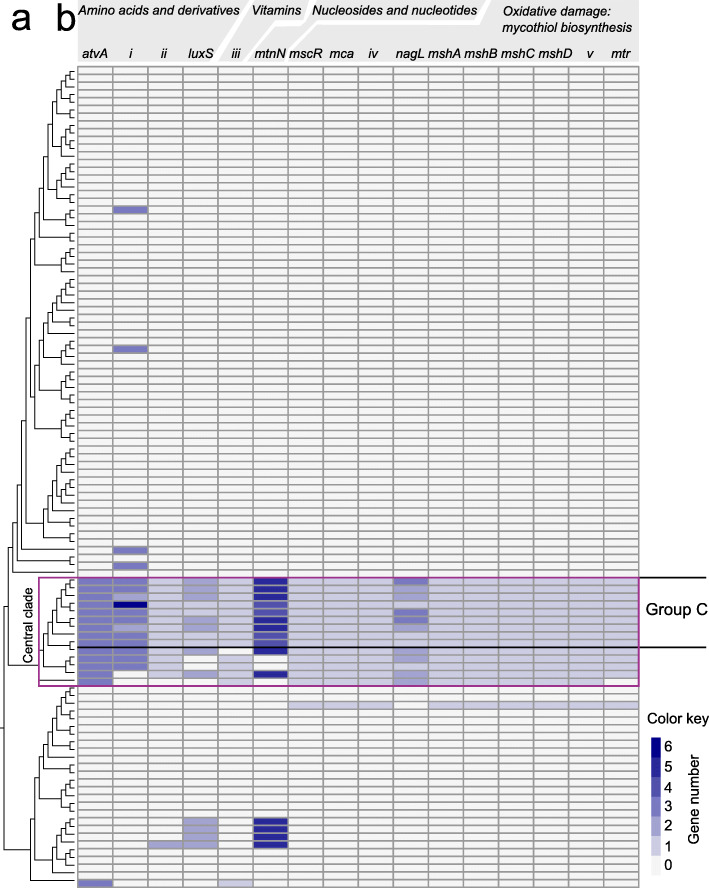
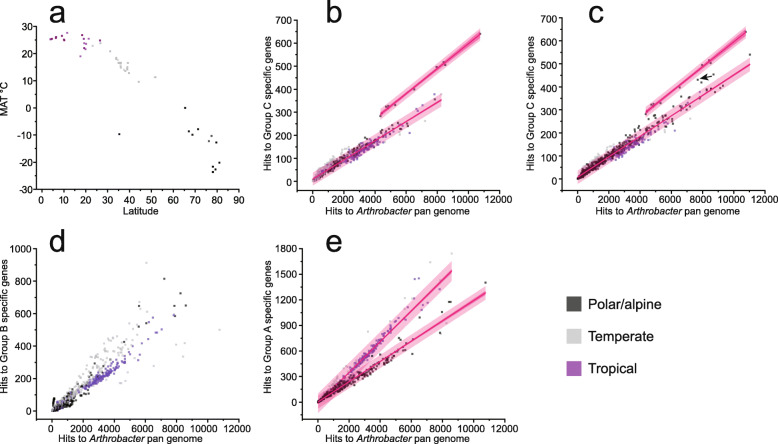
Results: Here we examined the bacterial genus Arthrobacter and, assisted by genome sequences of new Tibetan Plateau isolates, defined a new clade, Group C, that represents isolates from polar and alpine environments. Group C had a superior ability to grow at -1°C and possessed genome G+C content, amino acid composition, predicted protein stability, and functional capacities (e.g., sulfur metabolism and mycothiol biosynthesis) that distinguished it from non-polar or alpine Group A Arthrobacter. Interrogation of nearly 1000 metagenomes identified an over-representation of Group C in Canadian permafrost communities from a simulated spring-thaw experiment, indicative of niche adaptation, and an under-representation of Group A in all polar and alpine samples, indicative of a general response to environmental temperature.
Conclusion: The findings illustrate a capacity to define genomic markers of specific taxa that potentially have value for environmental monitoring of cold environments, including environmental change arising from anthropogenic impact. More broadly, the study illustrates the challenges involved in extrapolating from genomic and physiological data to an environmental setting. Video Abstract.
Keywords: Alpine environment; Genomics; Metagenomics; Microbial adaptation; Polar environment; Psychrophiles.
Conflict of interest statement
The authors declare that they have no competing interests.
Figures
Similar articles
-
Genomics-based identification of a cold adapted clade in Deinococcus.BMC Biol. 2024 Jul 2;22(1):145. doi: 10.1186/s12915-024-01944-8. BMC Biol. 2024. PMID: 38956546 Free PMC article.
-
Genomic analyses reveal a low-temperature adapted clade in Halorubrum, a widespread haloarchaeon across global hypersaline environments.BMC Genomics. 2023 Aug 31;24(1):508. doi: 10.1186/s12864-023-09597-7. BMC Genomics. 2023. PMID: 37653415 Free PMC article.
-
Biotechnological uses of enzymes from psychrophiles.Microb Biotechnol. 2011 Jul;4(4):449-60. doi: 10.1111/j.1751-7915.2011.00258.x. Epub 2011 Mar 24. Microb Biotechnol. 2011. PMID: 21733127 Free PMC article. Review.
-
Genomic and phenotypic insights into the ecology of Arthrobacter from Antarctic soils.BMC Genomics. 2015 Feb 5;16(1):36. doi: 10.1186/s12864-015-1220-2. BMC Genomics. 2015. PMID: 25649291 Free PMC article.
-
Psychrophilic enzymes: hot topics in cold adaptation.Nat Rev Microbiol. 2003 Dec;1(3):200-8. doi: 10.1038/nrmicro773. Nat Rev Microbiol. 2003. PMID: 15035024 Review.
Cited by
-
Genomic basis of environmental adaptation in the widespread poly-extremophilic Exiguobacterium group.ISME J. 2024 Jan 8;18(1):wrad020. doi: 10.1093/ismejo/wrad020. ISME J. 2024. PMID: 38365240 Free PMC article.
-
Biomineralization in Cave Bacteria-Popcorn and Soda Straw Crystal Formations, Morphologies, and Potential Metabolic Pathways.Front Microbiol. 2022 Jul 1;13:933388. doi: 10.3389/fmicb.2022.933388. eCollection 2022. Front Microbiol. 2022. PMID: 35847116 Free PMC article.
-
Comparative Genomic Analyses of the Genus Nesterenkonia Unravels the Genomic Adaptation to Polar Extreme Environments.Microorganisms. 2022 Jan 21;10(2):233. doi: 10.3390/microorganisms10020233. Microorganisms. 2022. PMID: 35208688 Free PMC article.
-
Genomics-based identification of a cold adapted clade in Deinococcus.BMC Biol. 2024 Jul 2;22(1):145. doi: 10.1186/s12915-024-01944-8. BMC Biol. 2024. PMID: 38956546 Free PMC article.
-
Seven genome sequences of airborne, bacterial isolates from Antarctica.Microbiol Resour Announc. 2024 Jun 11;13(6):e0112923. doi: 10.1128/mra.01129-23. Epub 2024 May 15. Microbiol Resour Announc. 2024. PMID: 38747591 Free PMC article.
References
-
- Cavicchioli R, Ripple WJ, Timmis KN, Azam F, Bakken LR, Baylis M, Behrenfeld MJ, Boetius A, Boyd PW, Classen AT, Crowther TW, Danovaro R, Foreman CM, Huisman J, Hutchins DA, Jansson JK, Karl DM, Koskella B, Mark Welch DB, Martiny JBH, Moran MA, Orphan VJ, Reay DS, Remais JV, Rich VI, Singh BK, Stein LY, Stewart FJ, Sullivan MB, van Oppen MJH, Weaver SC, Webb EA, Webster NS. Scientists’ warning to humanity: microorganisms and climate change. Nat Rev Microbiol. 2019;17(9):569–586. doi: 10.1038/s41579-019-0222-5. - DOI - PMC - PubMed
Publication types
MeSH terms
LinkOut - more resources
Full Text Sources
