

RANKL from bone marrow adipose lineage cells promotes osteoclast formation and bone loss
- PMID: 34121311
- PMCID: PMC8406405
- DOI: 10.15252/embr.202152481
RANKL from bone marrow adipose lineage cells promotes osteoclast formation and bone loss
Abstract
Receptor activator of NF-κB ligand (RANKL) is essential for osteoclast formation and bone remodeling. Nevertheless, the cellular source of RANKL for osteoclastogenesis has not been fully uncovered. Different from peripheral adipose tissue, bone marrow (BM) adipose lineage cells originate from bone marrow mesenchymal stromal cells (BMSCs). Here, we demonstrate that adiponectin promoter-driven Cre expression (AdipoqCre ) can target bone marrow adipose lineage cells. We cross the AdipoqCre mice with ranklfl/fl mice to conditionally delete RANKL from BM adipose lineage cells. Conditional deletion of RANKL increases cancellous bone mass of long bones in mice by reducing the formation of trabecular osteoclasts and inhibiting bone resorption but does not affect cortical bone thickness or resorption of calcified cartilage. AdipoqCre ; ranklfl/fl mice exhibit resistance to estrogen deficiency and rosiglitazone (ROS)-induced trabecular bone loss but show bone loss induced by unloading. BM adipose lineage cells therefore represent an essential source of RANKL for the formation of trabecula osteoclasts and resorption of cancellous bone during remodeling under physiological and pathological conditions. Targeting bone marrow adiposity is a promising way of preventing pathological bone loss.
Keywords: RANKL; bone marrow adipose lineage cell; bone remodeling; osteoclast.
© 2021 The Authors.
Conflict of interest statement
The authors declare that they have no conflict of interest.
Figures

FACS analysis of tdTomato+ cells in the bone marrow cells (percentages represent average values).
Immunofluorescence staining of aggrecan and DAPI of femur sections from AdipoqCre; R26tdTomato mice. Scale bar = 200/100/50 µm in left/ upper right/ bottom right images. CB: cortical bone, TB: trabecular bone.
Immunofluorescence staining of RANKL and Hoechst in bone marrow cells from AdipoqCre; R26tdTomato mice. Scale bar = 50 µm.
qPCR results of Rankl in BMAT and peripheral adipose tissues, including epididymal (eWAT), inguinal (iWAT), and interscapular (iBAT) (n = 3 independent biological replicates). Data were compared using one‐way ANOVA (** indicates P < 0.01), and error bars are standard deviations.
Immunofluorescence staining of RANKL during in vitro adipogenesis of BMSCs from AdipoqCre; ranklfl/fl mice (Rankl −/−) and ranklfl/fl mice (Rankl +/+). Scale bar = 50 μm.
Western blotting analyses of RANKL in BMSCs during in vitro BMSCs adipogenesis (n = 3 independent biological replicates). Data were compared using an unpaired t‐test (** indicates P < 0.01), and error bars are standard deviations.

- A, B
Giemsa staining and statistical analysis of CFU‐F number of BMSCs from WT mice and tdTomato+ cells from AdipoqCre; R26tdTomato mice. Scale bar = 50 µm. Data were compared using an unpaired t‐test (** indicates P < 0.01), and error bars are standard deviations. n = 5 independent microscopic vision fields in (B).
- C, D
Adipogenic potential of BMSCs and tdTomato+ cells was assessed by oil red O staining, and PPARγ and Lpl were detected by qPCR. Scale bar = 50 µm. Data were compared using an unpaired t‐test, and error bars are standard deviations. n = 5 independent microscopic vision fields in (D).
- E, F
Osteogenic potential of BMSCs and tdTomato+ cells was assessed by the alizarin red staining, and Alp and Ocn were detected by qPCR. Scale bar = 50 µm. Data were compared using an unpaired t‐test (** indicates P < 0.01), and error bars are standard deviations. n = 5 independent microscopic vision fields in (F).
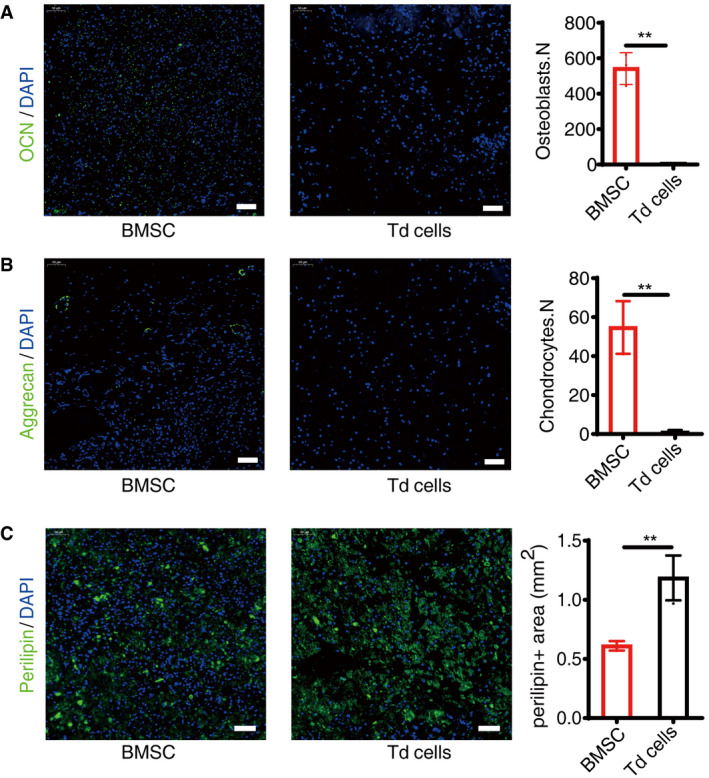
Immunofluorescence staining of OCN and statistical analyses of BMSCs and tdTomato+ cells (Td cells), scale bar = 50 µm. Images are representative of five independent biological replicates, n = 6 independent microscopic vision fields in the right panel. Data were compared using an unpaired t‐test (** indicates P < 0.01), and error bars are standard deviations.
Immunofluorescence staining of Aggrecan and statistical analyses of positive cells, scale bar = 50 µm. Images are representative of five independent biological replicates, n = 6 independent microscopic vision fields in the right panel. Data were compared using an unpaired t‐test (** indicates P < 0.01), and error bars are standard deviations.
Immunofluorescence staining of Perilipin and statistical analyses of positive cells, scale bar = 50 µm. Images are representative of five independent biological replicates, n = 6 independent microscopic vision fields in the right panel. Data were compared using an unpaired t‐test (** indicates P < 0.01), and error bars are standard deviations.
- A, B
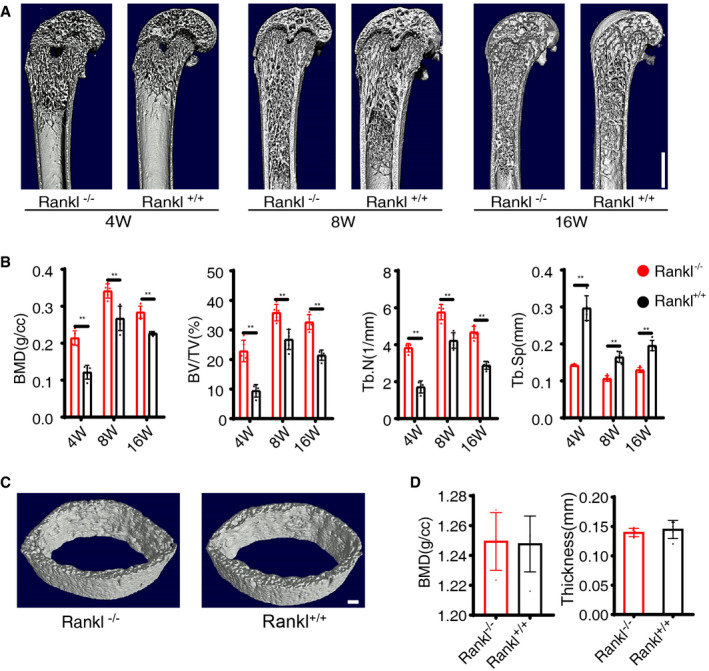
Micro‐CT and statistical analyses of BMD, BV/TV, Tb.N, and Tb.Sp in trabecular bone from AdipoqCre; ranklfl/fl (Rankl −/−) and ranklfl/fl (Rankl +/+) mice at 4 weeks, 8 weeks, and 16 weeks (n = 5 independent biological replicates). Scale bar = 1 mm. Data were compared using an unpaired t‐test (** indicates P < 0.01), and error bars are standard deviations.
- C
Micro‐CT images of cortical bone from Rankl −/− and Rankl +/+ mice at 8 weeks. Images are representative of five independent biological replicates. Scale bar = 1 mm.
- D
Micro‐CT analyses and statistical analyses of cortical bone from Rankl −/− and Rankl +/+ mice at 8 weeks (n = 5 independent biological replicates). Data were compared using an unpaired t‐test, and error bars are standard deviations.
- A
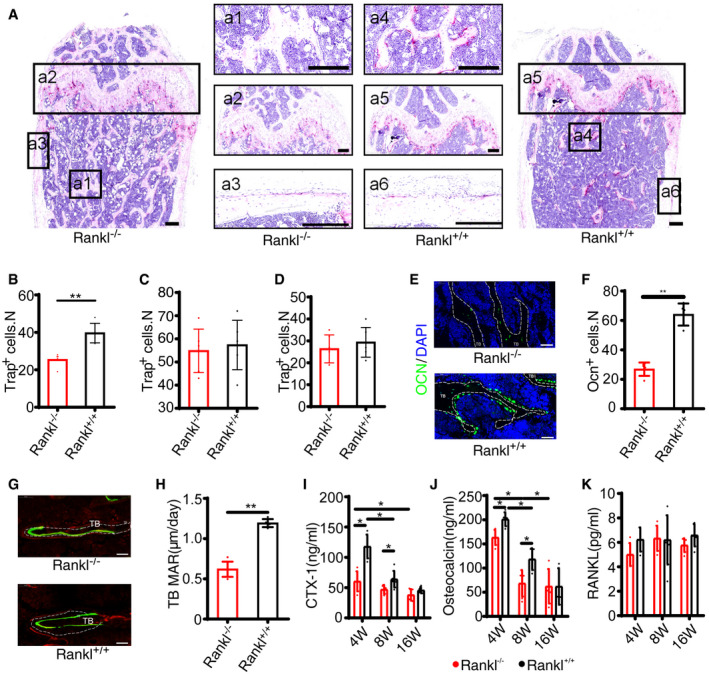
Representative images of TRAP staining of femur from AdipoqCre; ranklfl/fl (Rankl −/−) and ranklfl/fl (Rankl +/+) mice at 8 weeks. Scale bar = 200 μm. Panels a1 and a4 indicate trabecular bone, a2 and a5 stand for growth plate, and a3 and a6 denote cortical bone.
- B
Numbers of Trap+ cells on trabecular bone (a1 vs. a4, see (A)) (n = 6 independent microscopic vision fields from random mice samples). Data were compared using an unpaired t‐test (** indicates P < 0.01), and error bars are standard deviations.
- C
Numbers of Trap+ cells under the growth plate (a2 vs. a5, see (A)) (n = 6 independent microscopic vision fields from random mice samples). Data were compared using an unpaired t‐test, and error bars are standard deviations.
- D
Numbers of periosteal Trap+ cells (a3 vs. a6, see (A)) (n = 6 independent microscopic vision fields from random mice samples). Data were compared using an unpaired t‐test, and error bars are standard deviations.
- E
Immunofluorescence staining of osteocalcin from 8‐week‐old mice (n = 6 mice in Rankl −/− group and 4 mice in Rankl +/+ group). Scale bar = 50 μm. TB: trabecular bone.
- F
Statistical analyses of Ocn+ cells (n = 6 independent microscopic vision fields from random mice samples). Data were compared using an unpaired t‐test (** indicates P < 0.01), and error bars are standard deviations.
- G
Calcein staining of trabecular bone at 8 weeks. Scale bar = 50 μm. TB: trabecular bone. Images are representative of 6 independent biological replicates in Rankl −/− and 5 replicates in Rankl +/+ group.
- H
Mineral apposition rate (MAR) of trabecular bone at 8 weeks (n = 6 mice in Rankl −/− group and 5 mice in Rankl +/+ group). Data were compared using an unpaired t‐test (** indicates P < 0.01), and error bars are standard deviations.
- I–K
Serum CTX‐1, OCN, and bone marrow RANKL levels from Rankl −/− and Rankl +/+ mice at 4 weeks (n = 5 and 5), 8 weeks (n = 5 and 6), and 16 weeks (n = 5 and 5). Data were compared using an unpaired t‐test (* indicates P < 0.05, ** indicates P < 0.01), and error bars are standard deviations.

Safranin O/Fast green staining of AdipoqCre; ranklfl/fl (Rankl −/−) and ranklfl/fl (Rankl +/+) mice. Scale bar = 250 µm
X‐ray images of the head of 8‐week‐old mice. Scale bar = 2 mm.
Calcein staining and statistical analysis from periosteal side of cortical bone (n = 6 mice in Rankl −/− group and 5 mice in Rankl +/+ group). Scale bar = 50 µm. Data were compared using an unpaired t‐test, and error bars are standard deviations.
Calcein staining and statistical analysis from endosteal side of cortical bone (n = 6 mice in Rankl −/− group and 5 mice in Rankl +/+ group). Scale bar = 50 µm. Data were compared using an unpaired t‐test, and error bars are standard deviations.

- A, B
Micro‐CT and statistical analyses of BMD, BV/TV, Tb.N, and Tb.Sp in trabecular bone from AdipoqCre; rankfl/fl (Rank −/−) and rankfl/fl (Rank +/+) mice at 4 weeks, 8 weeks, and 16 weeks. Scale bar = 1 mm. Images are representative of 5 independent biological replicates, n = 5 independent microscopic vision fields in (B). Data were compared using an unpaired t‐test, and error bars are standard deviations.
- A, B
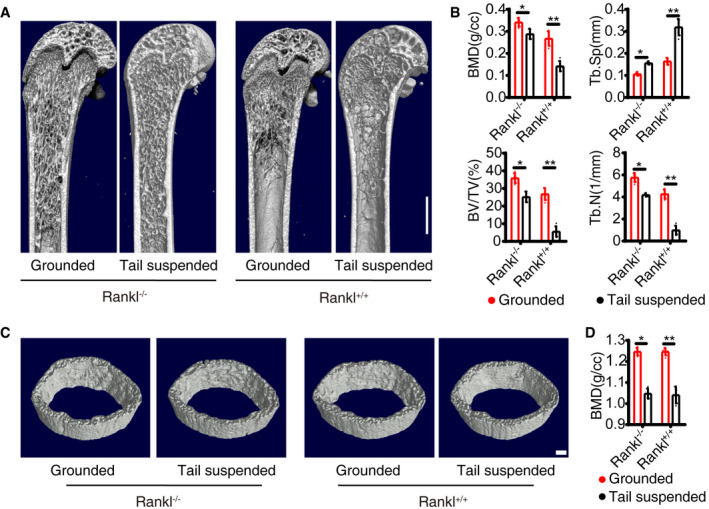
Micro‐CT analyses of trabecular bone from Grounded and Tail suspended model (n = 5 independent biological replicates). Scale bar = 1 mm. Data were compared using an unpaired t‐test (* indicates P < 0.05, ** indicates P < 0.01), and error bars are standard deviations.
- C, D
Micro‐CT analyses of cortical bone (n = 5 independent biological replicates). Scale bar = 1 mm. Data were compared using an unpaired t‐test (* indicates P < 0.05, ** indicates P < 0.01), and error bars are standard deviations.

- A, B
Immunofluorescence staining of adiponectin and statistical analyses of the number of adipose lineage cells. Scale bar = 100 µm. Images are representative of 5 independent biological replicates, n = 5 independent microscopic vision fields in (B). Data were compared using an unpaired t‐test (** indicates P < 0.01), and error bars are standard deviations. CB: cortical bone, TB: trabecular bone.
- C
H&E staining of the distal femur from AdipoqCre; ranklfl/fl (Rankl −/−) and ranklfl/fl (Rankl +/+) mice treated with Sham or OVX. Scale bar = 1 mm.
- D, F
ELISA analyses of serum CTX‐1, OCN, and bone marrow RANKL levels in Sham and OVX mice (n = 5 independent biological replicates). Data were compared using an unpaired t‐test (* indicates P < 0.05), and error bars are standard deviations.

- A, B
Micro‐CT analyses of sham and OVX model of AdipoqCre; ranklfl/fl (Rankl −/−) and ranklfl/fl (Rankl +/+) mice (n = 5 independent biological replicates). Scale bar = 1 mm. Data were compared using an unpaired t‐test (** indicates P < 0.01), and error bars are standard deviations.
- C, D
TRAP staining and statistical analyses of numbers of osteoclasts in Sham and OVX model (Images are representative of 5 independent biological replicates in (C), and n = 5 independent microscopic vision fields in (D)). Scale bar = 100 µm. Data were compared using an unpaired t‐test (** indicates P < 0.01), and error bars are standard deviations.
- E, F
Immunofluorescence staining of OCN and statistical analyses of the number of osteoblasts (Images are representative of 5 independent biological replicates in (E), and n = 5 independent microscopic vision fields in (F)). Scale bar = 50 µm. TB: trabecular bone. Data were compared using an unpaired t‐test (** indicates P < 0.01), and error bars are standard deviations.
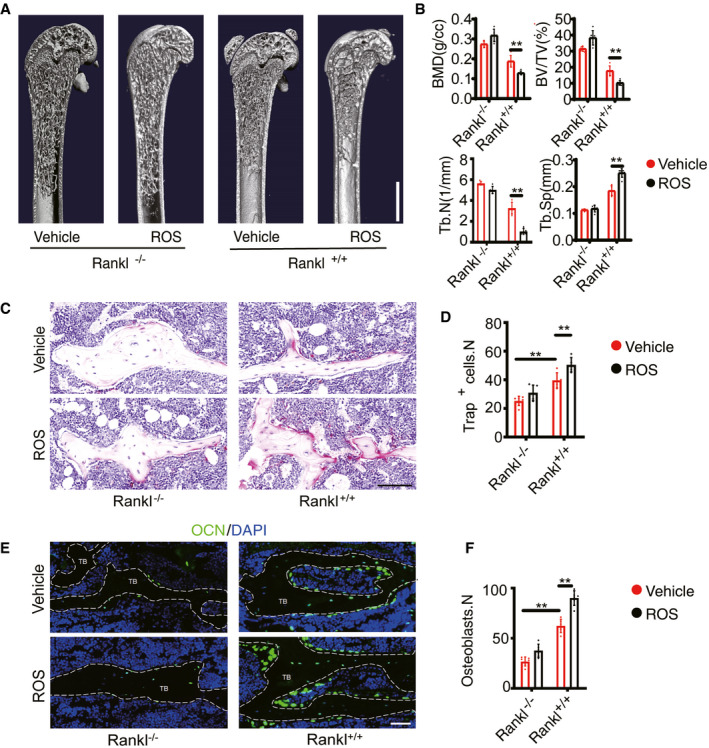
- A, B
Three‐dimensional CT analyses of BMD, BV/TV, Tb.N, and Tb.Sp in trabecular bone from Vehicle (n = 5 independent biological replicates) and ROS (n = 6 independent biological replicates) model of AdipoqCre; ranklfl/fl (Rankl −/−) and ranklfl/fl (Rankl +/+) mice. Scale bar = 1 mm. Data were compared using an unpaired t‐test (** indicates P < 0.01), and error bars are standard deviations.
- C, D
TRAP staining and statistical analyses of numbers of osteoclasts in the trabecular bone from vehicle (n = 6 and 5 independent biological replicates) and ROS (n = 6 and 6 independent biological replicates) treatment. Scale bar = 100 µm. Data were compared using an unpaired t‐test (** indicates P < 0.01), and error bars are standard deviations. n = 5 independent microscopic vision fields in (D).
- E, F
OCN staining and statistical analyses of the number of osteoblasts in femurs from vehicle (n = 6 and 5 independent biological replicates) and ROS (n = 6 and 6 independent biological replicates) treatment. Scale bar = 50 µm. TB: trabecular bone. Data were compared using an unpaired t‐test (** indicates P < 0.01), and error bars are standard deviations. n = 5 independent microscopic vision fields in (F).
Comment in
-
A critical relationship between bone and fat: the role of bone marrow adipose-derived RANKL in bone metabolism.EMBO Rep. 2021 Jul 5;22(7):e52986. doi: 10.15252/embr.202152986. Epub 2021 Jun 13. EMBO Rep. 2021. PMID: 34121307 Free PMC article.
References
-
- Aubert RE, Herrera V, Chen W, Haffner SM, Pendergrass M (2010) Rosiglitazone and pioglitazone increase fracture risk in women and men with type 2 diabetes. Diabetes Obes Metab 12: 716–721 - PubMed
-
- Boyle WJ, Simonet WS, Lacey DL (2003) Osteoclast differentiation and activation. Nature 423: 337–342 - PubMed
-
- Chen CH, Chen HA, Liao HT, Liu CH, Tsai CY, Chou CT (2010) Soluble receptor activator of nuclear factor‐kappaB ligand (RANKL) and osteoprotegerin in ankylosing spondylitis: OPG is associated with poor physical mobility and reflects systemic inflammation. Clin Rheumatol 29: 1155–1161 - PubMed
Publication types
MeSH terms
LinkOut - more resources
Full Text Sources
Miscellaneous
