

Immune-viral dynamics modeling for SARS-CoV-2 drug development
- PMID: 34121337
- PMCID: PMC8444857
- DOI: 10.1111/cts.13099
Immune-viral dynamics modeling for SARS-CoV-2 drug development
Abstract
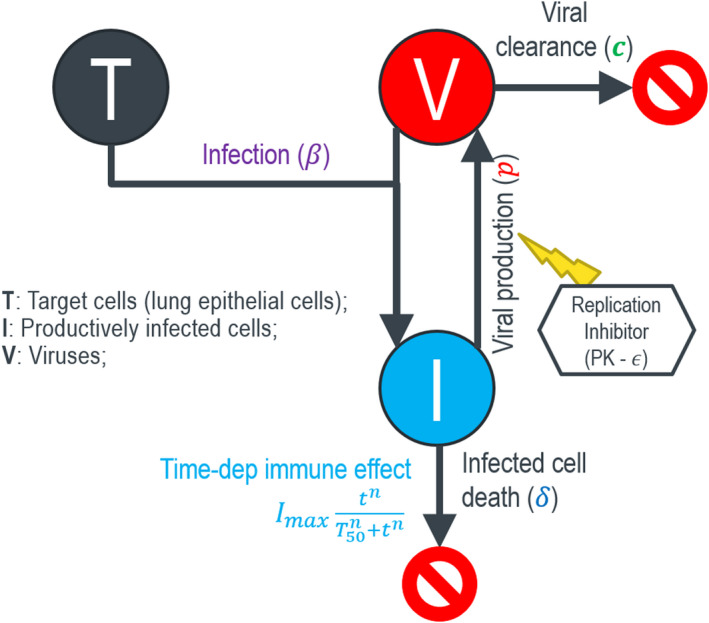
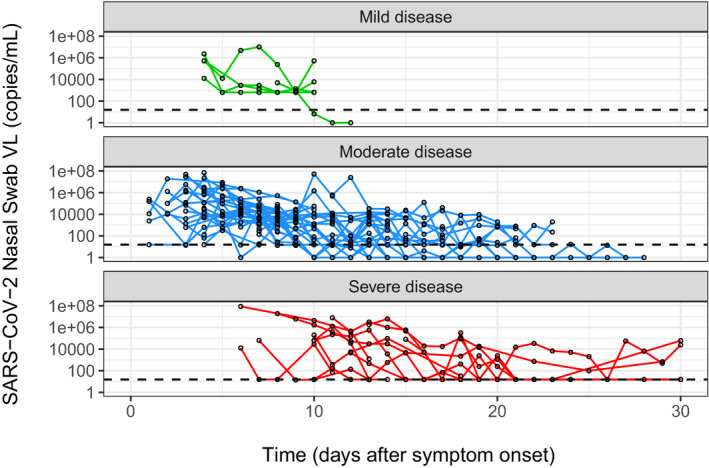
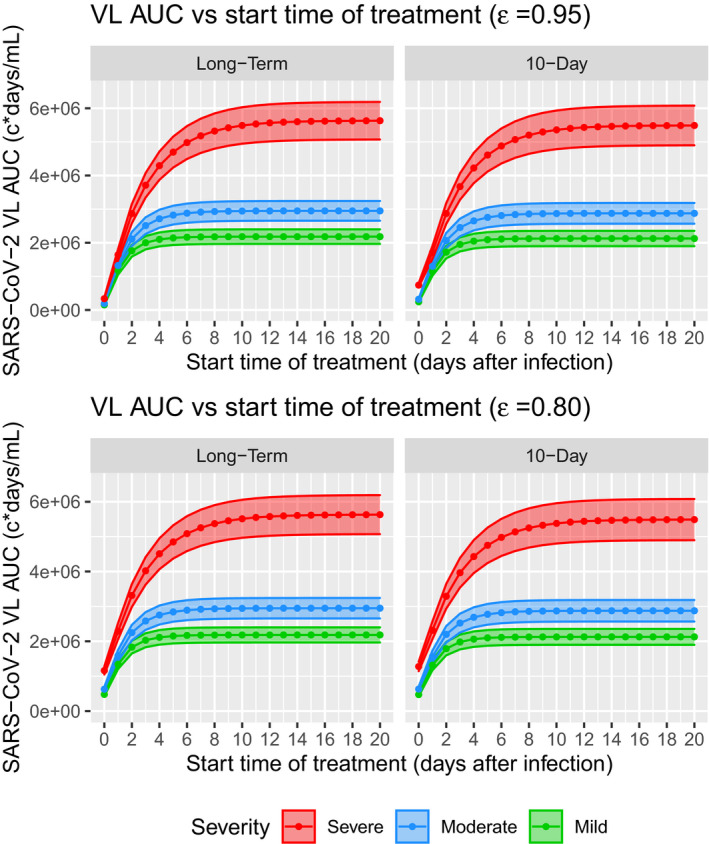
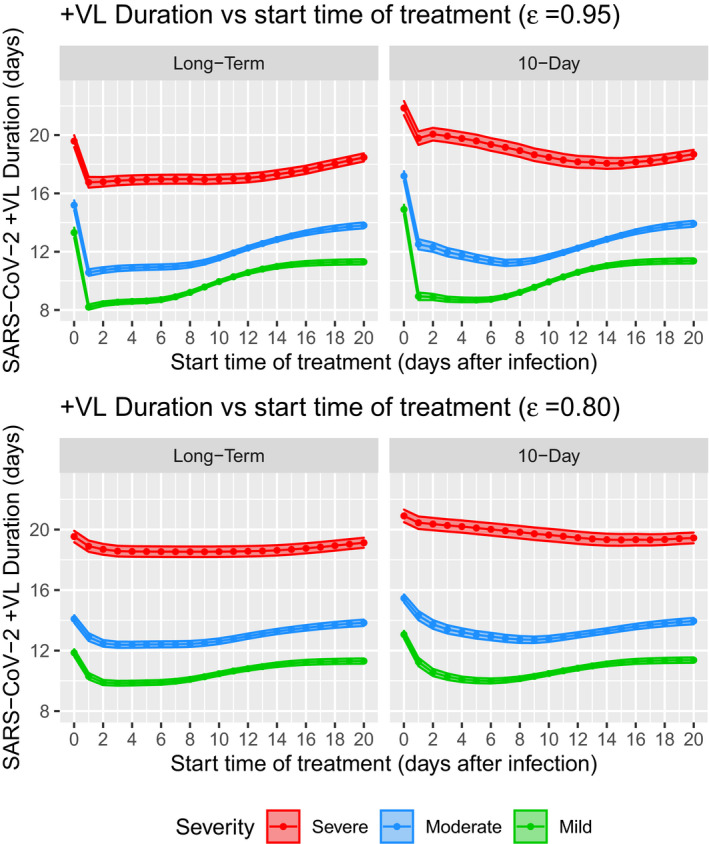
Coronavirus disease 2019 (COVID-19) global pandemic is caused by severe acute respiratory syndrome-coronavirus 2 (SARS-CoV-2) viral infection, which can lead to pneumonia, lung injury, and death in susceptible populations. Understanding viral dynamics of SARS-CoV-2 is critical for development of effective treatments. An Immune-Viral Dynamics Model (IVDM) is developed to describe SARS-CoV-2 viral dynamics and COVID-19 disease progression. A dataset of 60 individual patients with COVID-19 with clinical viral load (VL) and reported disease severity were assembled from literature. Viral infection and replication mechanisms of SARS-CoV-2, viral-induced cell death, and time-dependent immune response are incorporated in the model to describe the dynamics of viruses and immune response. Disease severity are tested as a covariate to model parameters. The IVDM was fitted to the data and parameters were estimated using the nonlinear mixed-effect model. The model can adequately describe individual viral dynamics profiles, with disease severity identified as a covariate on infected cell death rate. The modeling suggested that it takes about 32.6 days to reach 50% of maximum cell-based immunity. Simulations based on virtual populations suggested a typical mild case reaches VL limit of detection (LOD) by 13 days with no treatment, a moderate case by 17 days, and a severe case by 41 days. Simulations were used to explore hypothetical treatments with different initiation time, disease severity, and drug effects to demonstrate the usefulness of such modeling in informing decisions. Overall, the IVDM modeling and simulation platform enables simulations for viral dynamics and treatment efficacy and can be used to aid in clinical pharmacokinetic/pharmacodynamic (PK/PD) and dose-efficacy response analysis for COVID-19 drug development.
© 2021 Merck Sharp & Dohme Corp. Clinical and Translational Science published by Wiley Periodicals LLC on behalf of American Society for Clinical Pharmacology and Therapeutics.
Conflict of interest statement
Y.C., W.G., L.C., and J.A.S. are employees of Merck Sharp & Dohme Corp., a subsidiary of Merck & Co., Inc. (Kenilworth, NJ), and may own stock/stock options in the company.
Figures


Similar articles
-
Modeling the viral dynamics of SARS-CoV-2 infection.Math Biosci. 2020 Oct;328:108438. doi: 10.1016/j.mbs.2020.108438. Epub 2020 Aug 6. Math Biosci. 2020. PMID: 32771304 Free PMC article.
-
Compartmental Model Suggests Importance of Innate Immune Response to COVID-19 Infection in Rhesus Macaques.Bull Math Biol. 2021 May 26;83(7):79. doi: 10.1007/s11538-021-00909-0. Bull Math Biol. 2021. PMID: 34037874 Free PMC article.
-
Data-driven multi-scale mathematical modeling of SARS-CoV-2 infection reveals heterogeneity among COVID-19 patients.PLoS Comput Biol. 2021 Nov 24;17(11):e1009587. doi: 10.1371/journal.pcbi.1009587. eCollection 2021 Nov. PLoS Comput Biol. 2021. PMID: 34818337 Free PMC article.
-
Long Noncoding RNAs as Emerging Regulators of COVID-19.Front Immunol. 2021 Aug 2;12:700184. doi: 10.3389/fimmu.2021.700184. eCollection 2021. Front Immunol. 2021. PMID: 34408749 Free PMC article. Review.
-
A Prototype QSP Model of the Immune Response to SARS-CoV-2 for Community Development.CPT Pharmacometrics Syst Pharmacol. 2021 Jan;10(1):18-29. doi: 10.1002/psp4.12574. Epub 2020 Dec 21. CPT Pharmacometrics Syst Pharmacol. 2021. PMID: 33217169 Free PMC article. Review.
Cited by
-
Modeling suggests SARS-CoV-2 rebound after nirmatrelvir-ritonavir treatment is driven by target cell preservation coupled with incomplete viral clearance.J Virol. 2025 Mar 18;99(3):e0162324. doi: 10.1128/jvi.01623-24. Epub 2025 Feb 4. J Virol. 2025. PMID: 39902924 Free PMC article.
-
Modeling explains prolonged SARS-CoV-2 nasal shedding relative to lung shedding in remdesivir-treated rhesus macaques.iScience. 2022 Jun 17;25(6):104448. doi: 10.1016/j.isci.2022.104448. Epub 2022 May 25. iScience. 2022. PMID: 35634576 Free PMC article.
-
A multiscale model of the action of a capsid assembly modulator for the treatment of chronic hepatitis B.PLoS Comput Biol. 2025 May 6;21(5):e1012322. doi: 10.1371/journal.pcbi.1012322. eCollection 2025 May. PLoS Comput Biol. 2025. PMID: 40327725 Free PMC article.
-
Within-host evolution of SARS-CoV-2: how often are de novo mutations transmitted from symptomatic infections?Virus Evol. 2024 Feb 21;10(1):veae006. doi: 10.1093/ve/veae006. eCollection 2024. Virus Evol. 2024. PMID: 38425472 Free PMC article.
-
A quantitative systems pharmacology model of the pathophysiology and treatment of COVID-19 predicts optimal timing of pharmacological interventions.NPJ Syst Biol Appl. 2023 Apr 14;9(1):13. doi: 10.1038/s41540-023-00269-6. NPJ Syst Biol Appl. 2023. PMID: 37059734 Free PMC article.
References
-
- WHO . WHO Coronavirus (COVID‐19) Dashboard. https://covid19.who.int/.
-
- Wolfel R, Corman VM, Guggemos W, et al. Virological assessment of hospitalized patients with COVID‐2019. Nature. 2020;581(7809):465‐469. - PubMed
MeSH terms
Substances
LinkOut - more resources
Full Text Sources
Miscellaneous
