. 2021 Jul 1;321(1):F106-F119.
doi: 10.1152/ajprenal.00117.2021. Epub 2021 Jun 14.

Skeletal myopathy in CKD: a comparison of adenine-induced nephropathy and 5/6 nephrectomy models in mice

Affiliations

Skeletal myopathy in CKD: a comparison of adenine-induced nephropathy and 5/6 nephrectomy models in mice

Kyoungrae Kim et al. Am J Physiol Renal Physiol. .

Abstract

Preclinical animal models of chronic kidney disease (CKD) are critical to investigate the underlying mechanisms of disease and to evaluate the efficacy of novel therapeutics aimed to treat CKD-associated pathologies. The objective of the present study was to compare the adenine diet and 5/6 nephrectomy (Nx) CKD models in mice. Male and female 10-wk-old C57BL/6J mice (n = 5-9 mice/sex/group) were randomly allocated to CKD groups (0.2-0.15% adenine-supplemented diet or 5/6 Nx surgery) or the corresponding control groups (casein diet or sham surgery). Following the induction of CKD, the glomerular filtration rate was reduced to a similar level in both adenine and 5/6 Nx mice (adenine diet-fed male mice: 81.1 ± 41.9 µL/min vs. 5/6 Nx male mice: 160 ± 80.9 µL/min, P = 0.5875; adenine diet-fed female mice: 112.9 ± 32.4 µL/min vs. 5/6 Nx female mice: 107.0 ± 45.7 µL/min, P = 0.9995). Serum metabolomics analysis indicated that established uremic toxins were robustly elevated in both CKD models, although some differences were observed between CKD models (i.e., p-cresol sulfate). Dysregulated phosphate homeostasis was observed in the adenine model only, whereas Ca2+ homeostasis was disturbed in male mice with both CKD models. Compared with control mice, muscle mass and myofiber cross-sectional areas of the extensor digitorum longus and soleus muscles were ∼18-24% smaller in male CKD mice regardless of the model but were not different in female CKD mice (P > 0.05). Skeletal muscle mitochondrial respiratory function was significantly decreased (19-24%) in CKD mice in both models and sexes. These findings demonstrate that adenine diet and 5/6 Nx models of CKD have similar levels of renal dysfunction and skeletal myopathy. However, the adenine diet model demonstrated superior performance with regard to mortality (∼20-50% mortality for 5/6 Nx vs. 0% mortality for the adenine diet, P < 0.05 for both sexes) compared with the 5/6 Nx surgical model.NEW & NOTEWORTHY Numerous preclinical models of chronic kidney disease have been used to evaluate skeletal muscle pathology; however, direct comparisons of popular models are not available. In this study, we compared adenine-induced nephropathy and 5/6 nephrectomy models. Both models produced equivalent levels of muscle atrophy and mitochondrial impairment, but the adenine model exhibited lower mortality rates, higher consistency in uremic toxin levels, and dysregulated phosphate homeostasis compared with the 5/6 nephrectomy model.

Keywords: atrophy; cachexia; mitochondria; renal; uremia.


Conflict of interest statement

No conflicts of interest, financial or otherwise, are declared by the authors.

Figures

None
Graphical abstract
Figure 1.
Figure 1.
Comparison of adenine nephropathy and 5/6 nephrectomy (Nx) models. A: schematic overview of the study design for adenine-induced nephropathy and 5/6 Nx. Male and female C57BL/6J mice were allocated to control (casein diet and sham surgery) and chronic kidney disease (CKD; adenine diet and 5/6 Nx) groups. Glomerular filtration rate (GFR) and blood urea nitrogen (BUN) were assessed 4–7 days prior to euthanization. B: probability of survival throughout the study duration. C: body weights in control and CKD mice. D: GFR measured by FITC-inulin clearance. E: BUN measured using a commercial kit. GFR and BUN tests were conducted 8 wk after adenine diet in the group of diet-induced nephropathy and 4 wk after the second-step surgery in the group of 5/6 Nx. Values are represented as means ± SD; n =4–9 mice/group/sex. Data were analyzed using two-way ANOVA, and Tukey’s post hoc analysis was performed when appropriate. *P < 0.05, **P < 0.01, ***P < 0.001, and ****P < 0.0001 vs. control; ###P < 0.001 vs. adenine. FITC
Figure 2.
Figure 2.
Serum biochemical markers associated with dysregulated bone and mineral metabolism. Serum phosphate (A), fibroblast growth factor-23 (FGF23; B), calcium (C), and parathyroid hormone (PTH; D) were determined using a microplate spectrophotometer. Values are represented as means ± SD; n =3 or 4 mice/group/sex. Data were analyzed using a two-way ANOVA, and Tukey’s post hoc analysis was performed when appropriate. *P < 0.05, **P < 0.01, ***P < 0.001, and ****P < 0.0001 vs. control; ##P < 0.01 and ###P < 0.001 vs. adenine. Nx, nephrectomy.
Figure 3.
Figure 3.
Serum uremic toxins in adenine nephropathy and 5/6 nephrectomy (Nx) models. Serum metabolomics determined circulating uremic toxins derived from tryptophan metabolism measured via mass spectrometry (LC-MS/MS). A: kynurenine. B: kynurenic acid. C: xanthurenic acid. D: anthranilic acid. E: indoxyl sulfate. F: p-cresol sulfate. G: indole-3-acetate. H: tryptophan. I: serotonin. Values are represented as means ± SD; n =4 mice/group/sex. Data were analyzed using two-way ANOVA, and Tukey’s post hoc analysis was performed when appropriate. *P < 0.05, **P < 0.01, ***P < 0.001, and ****P < 0.0001 vs. control; #P < 0.05, ##P < 0.01, ###P < 0.001, and ###P < 0.0001 vs. adenine.
Figure 4.
Figure 4.
Chronic kidney disease causes muscle wasting and reduced fiber cross-sectional area (CSA) in male but not in female mice. A: representative immunofluorescence image of the extensor digitorum longus (EDL) muscle stained with laminin from a casein diet-fed control mouse. B: muscle mass for the EDL muscle. C: mean myofiber CSA of the EDL muscle. D and E: relative frequency distributions of EDL myofiber CSA for male mice (D) and female mice (E). F: representative immunofluorescence image of the soleus (SOL) muscle stained with laminin from a casein diet-fed control mouse. G: muscle mass for the SOL muscle. H: mean myofiber CSA of the SOL muscle. I and J: relative frequency distributions of SOL myofiber CSA for male mice (I) and female mice (J). Values are represented as means ± SD; n =5 mice/group/sex. Data were analyzed using two-way ANOVA, and Tukey’s post hoc analysis were performed when appropriate. *P < 0.05, **P < 0.01, ***P < 0.001, and ****P < 0.0001 vs. control; #P < 0.05 vs. casein. Nx, nephrectomy.
Figure 5.
Figure 5.
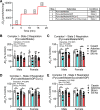
Mitochondrial respiratory function in skeletal muscle. Skeletal muscle mitochondria were isolated from control and chronic kidney disease mice. A: graphical depiction of the detailed respiratory protocol used. B: state 2 respiration supported by pyruvate and malate. C: ADP-stimulated mitochondrial respiration supported by pyruvate and malate. D: state 3 respiration following the addition of cytochrome c (Cyt C; used for checking mitochondrial integrity). E: state 3 respiration supported by pyruvate, malate, and succinate. Values are represented as means ± SD; n =5–9 mice/group/sex. Data were analyzed using two-way ANOVA and the two-stage step-up method of Benjamini, Krieger, and Yekutieli for multiple comparisons. *P < 0.05, **P < 0.01, and ***P < 0.001 vs. control. Nx, nephrectomy.
Figure 6.
Figure 6.
Pearson correlation analyses across outcome measures. Pearson correlation coefficients among glomerular filtration rate (GFR), serum metabolites, muscle mass, myofiber cross-sectional area (CSA), and mitochondrial respiratory capacity were performed according to model and sex. Heatmaps were created from the Pearson correlation matrixes for adenine-induced nephropathy in male (A) and female (C) mice and for 5/6 nephrectomized (Nx) male (B) and female (D) mice. n =4–9 mice/group/sex. *Significant correlation (P < 0.05). AA, anthranilic acid; EDL, extensor digitorum longus; I-3-A, indole-3-acetic acid; IS, indoxyl sulfate; KA, kynurenic acid; p-CS, p-cresol sulfate; SOL, soleus; XA, xanthurenic acid.

References

    1. Webster AC, Nagler EV, Morton RL, Masson P. Chronic kidney disease. Lancet 389: 1238–1252, 2017. doi:10.1016/S0140-6736(16)32064-5. - DOI - PubMed
    1. Coresh J, Astor BC, Greene T, Eknoyan G, Levey AS. Prevalence of chronic kidney disease and decreased kidney function in the adult US population: Third National Health and Nutrition Examination Survey. Am J Kidney Dis 41: 1–12, 2003. doi:10.1053/ajkd.2003.50007. - DOI - PubMed
    1. Gracia-Iguacel C, Gonzalez-Parra E, Perez-Gomez MV, Mahillo I, Egido J, Ortiz A, Carrero JJ. Prevalence of protein-energy wasting syndrome and its association with mortality in haemodialysis patients in a centre in Spain. Nefrologia 33: 495–505, 2013. doi:10.3265/Nefrologia.pre2013.Apr.11979. - DOI - PubMed
    1. Stenvinkel P, Heimburger O, Lindholm B. Wasting, but not malnutrition, predicts cardiovascular mortality in end-stage renal disease. Nephrol Dial Transplant 19: 2181–2183, 2004. doi:10.1093/ndt/gfh296. - DOI - PubMed
    1. Peng H, Cao J, Yu R, Danesh F, Wang Y, Mitch WE, Xu J, Hu Z. CKD stimulates muscle protein loss via Rho-associated protein kinase 1 activation. J Am Soc Nephrol 27: 509–519, 2016. doi:10.1681/ASN.2014121208. - DOI - PMC - PubMed

Publication types