

Metabolism-Based Gene Differences in Neurons Expressing Hyperphosphorylated AT8- Positive (AT8+) Tau in Alzheimer's Disease
- PMID: 34121475
- PMCID: PMC8207264
- DOI: 10.1177/17590914211019443
Metabolism-Based Gene Differences in Neurons Expressing Hyperphosphorylated AT8- Positive (AT8+) Tau in Alzheimer's Disease
Abstract
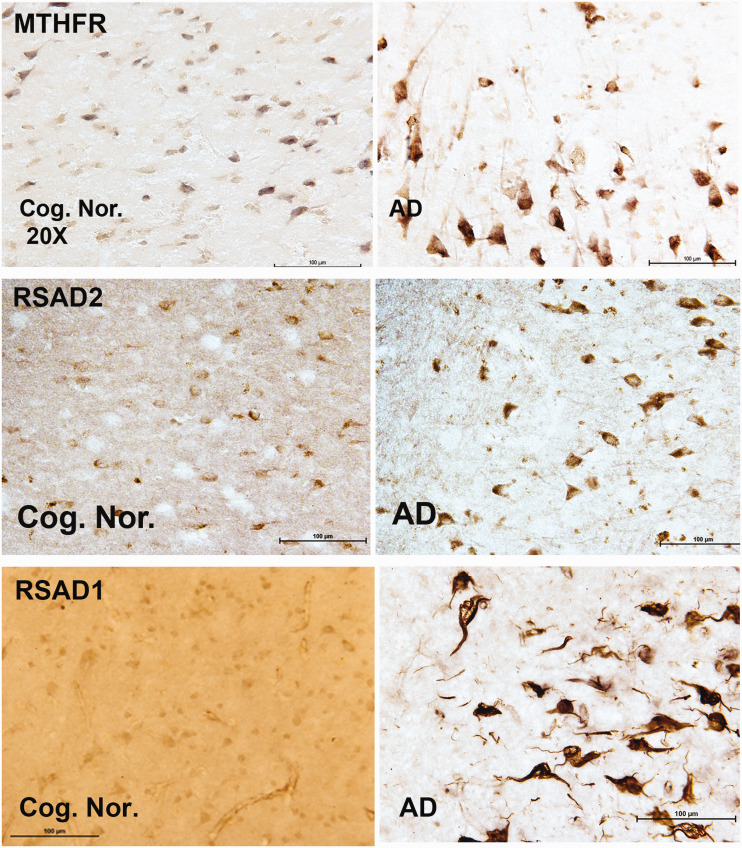
Metabolic adaptations in the brain are critical to the establishment and maintenance of normal cellular functions and to the pathological responses to disease processes. Here, we have focused on specific metabolic pathways that are involved in immune-mediated neuronal processes in brain using isolated neurons derived from human autopsy brain sections of normal individuals and individuals diagnosed as Alzheimer's disease (AD). Laser capture microscopy was used to select specific cell types in immune-stained thin brain sections followed by NanoString technology to identify and quantify differences in mRNA levels between age-matched control and AD neuronal samples. Comparisons were also made between neurons isolated from AD brain sections expressing pathogenic hyperphosphorylated AT8- positive (AT8+) tau and non-AT8+ AD neurons using double labeling techniques. The mRNA expression data showed unique patterns of metabolic pathway expression between the subtypes of captured neurons that involved membrane based solute transporters, redox factors, and arginine and methionine metabolic pathways. We also identified the expression levels of a novel metabolic gene, Radical-S-Adenosyl Domain1 (RSAD1) and its corresponding protein, Rsad1, that impact methionine usage and radical based reactions. Immunohistochemistry was used to identify specific protein expression levels and their cellular location in NeuN+ and AT8+ neurons. APOE4 vs APOE3 genotype-specific and sex-specific gene expression differences in these metabolic pathways were also observed when comparing neurons from individuals with AD to age-matched individuals.
Keywords: APOE and sex based changes; brain metabolism; differential gene expression; hyperphosphorylated tau; radical s-adenosyl domain 1.
Conflict of interest statement
Figures


Similar articles
-
Hyperphosphorylated tau in Alzheimer's disease disseminates along pathways predicted by the Structural Model for Cortico-cortical Connections.J Comp Neurol. 2024 May;532(5):e25623. doi: 10.1002/cne.25623. J Comp Neurol. 2024. PMID: 38803103
-
Neuron-specific apolipoprotein e4 proteolysis is associated with increased tau phosphorylation in brains of transgenic mice.J Neurosci. 2004 Mar 10;24(10):2527-34. doi: 10.1523/JNEUROSCI.4315-03.2004. J Neurosci. 2004. PMID: 15014128 Free PMC article.
-
Non-tau based neuronal degeneration in Alzheimer's disease -- an immunocytochemical and quantitative study in the supragranular layers of the middle temporal neocortex.Brain Res. 2008 Jun 5;1213:152-65. doi: 10.1016/j.brainres.2008.03.043. Epub 2008 Apr 1. Brain Res. 2008. PMID: 18455153
-
Hypothesis: microtubule instability and paired helical filament formation in the Alzheimer disease brain are related to apolipoprotein E genotype.Exp Neurol. 1994 Feb;125(2):163-71; discussion 172-4. doi: 10.1006/exnr.1994.1019. Exp Neurol. 1994. PMID: 8313935 Review.
-
Apolipoprotein E and oxidative stress in brain with relevance to Alzheimer's disease.Neurobiol Dis. 2020 May;138:104795. doi: 10.1016/j.nbd.2020.104795. Epub 2020 Feb 6. Neurobiol Dis. 2020. PMID: 32036033 Free PMC article. Review.
Cited by
-
Functional Diversity of HemN-like Proteins.ACS Bio Med Chem Au. 2022 Jan 18;2(2):109-119. doi: 10.1021/acsbiomedchemau.1c00058. eCollection 2022 Apr 20. ACS Bio Med Chem Au. 2022. PMID: 37101745 Free PMC article. Review.
-
Aggregation, Transmission, and Toxicity of the Microtubule-Associated Protein Tau: A Complex Comprehension.Int J Mol Sci. 2023 Oct 9;24(19):15023. doi: 10.3390/ijms241915023. Int J Mol Sci. 2023. PMID: 37834471 Free PMC article. Review.
References
-
- Abdulhussein A. A., Wallace H. M. (2014). Polyamines and membrane transporters. Amino Acids, 46(3), 655–660. - PubMed
-
- Abe T., Tohgi H., Murata T., Isobe C., Sato C. (2001). Reduction in asymmetrical dimethylarginine, an endogenous nitric oxide synthase inhibitor, in the cerebrospinal fluid during aging and in patients with Alzheimer’s disease. Neurosci Lett, 312(3), 177–179. - PubMed
-
- Anzulovich A., Mir A., Brewer M., Ferreyra G., Vinson C., Baler R. (2006). Elovl3: A model gene to dissect homeostatic links between the circadian clock and nutritional status. J Lipid Res, 47(12), 2690–2700. - PubMed
-
- Arlt S., Schulze F., Eichenlaub M., Maas R., Lehmbeck J. T., Schwedhelm E., Jahn H., Boger R. H. (2008). Asymmetrical dimethylarginine is increased in plasma and decreased in cerebrospinal fluid of patients with Alzheimer’s disease. Dement Geriatr Cognit Disord, 26(1), 58–64. - PubMed
Publication types
MeSH terms
Substances
Grants and funding
LinkOut - more resources
Full Text Sources
Medical
Miscellaneous
