

All-Optical Electrophysiology in hiPSC-Derived Neurons With Synthetic Voltage Sensors
- PMID: 34122014
- PMCID: PMC8193062
- DOI: 10.3389/fncel.2021.671549
All-Optical Electrophysiology in hiPSC-Derived Neurons With Synthetic Voltage Sensors
Abstract
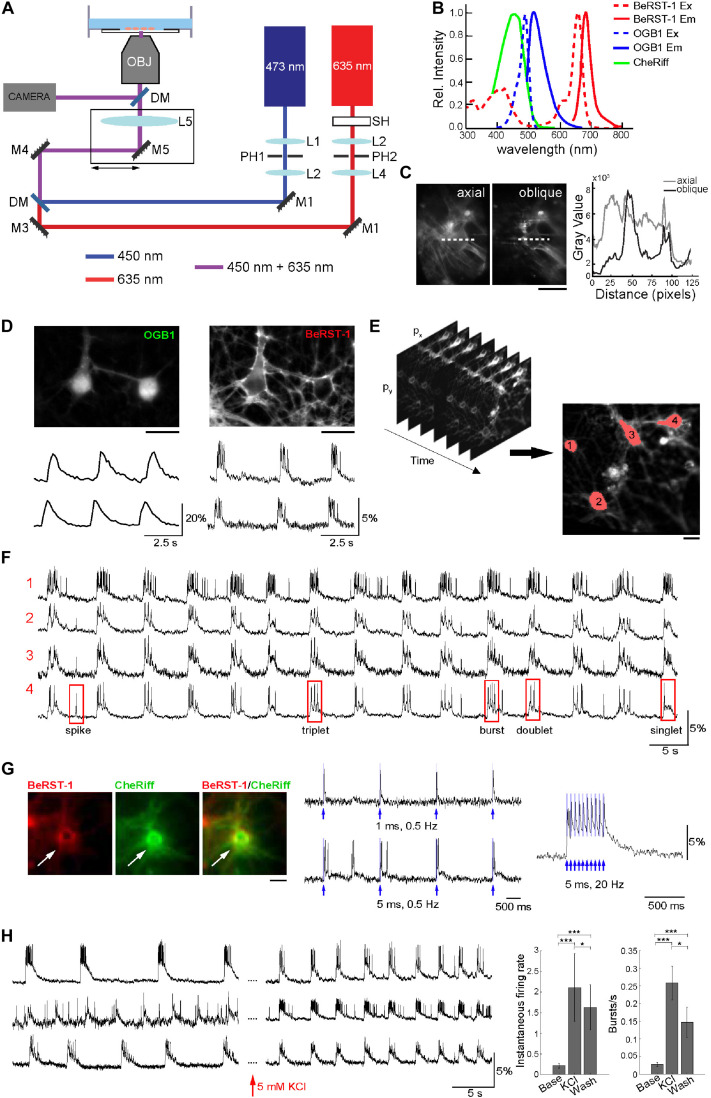
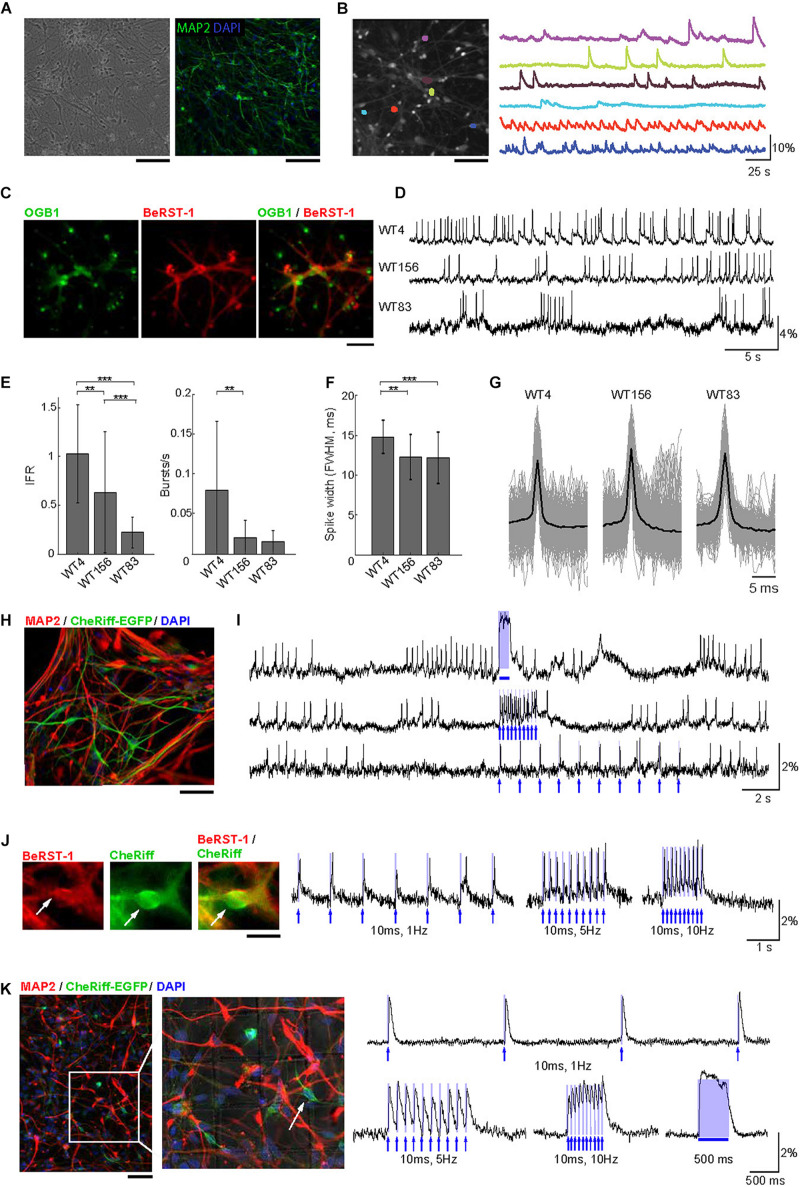
Voltage imaging and "all-optical electrophysiology" in human induced pluripotent stem cell (hiPSC)-derived neurons have opened unprecedented opportunities for high-throughput phenotyping of activity in neurons possessing unique genetic backgrounds of individual patients. While prior all-optical electrophysiology studies relied on genetically encoded voltage indicators, here, we demonstrate an alternative protocol using a synthetic voltage sensor and genetically encoded optogenetic actuator that generate robust and reproducible results. We demonstrate the functionality of this method by measuring spontaneous and evoked activity in three independent hiPSC-derived neuronal cell lines with distinct genetic backgrounds.
Keywords: BeRST-1; optogenetics; phenotyping; stem cells; voltage imaging.
Copyright © 2021 Puppo, Sadegh, Trujillo, Thunemann, Campbell, Vandenberghe, Shan, Akkouh, Miller, Bloodgood, Silva, Dale, Einevoll, Djurovic, Andreassen, Muotri and Devor.
Conflict of interest statement
ARM is a co-founder and has equity interest in TISMOO, a company dedicated to genetic analysis and brain organoid modeling focusing on therapeutic applications customized for autism spectrum disorder and other neurological disorders with genetic origins. The terms of this arrangement have been reviewed and approved by the University of California San Diego in accordance with its conflict of interest policies. The remaining authors declare that the research was conducted in the absence of any commercial or financial relationships that could be construed as a potential conflict of interest.
Figures
Similar articles
-
Optogenetic Control of Human Stem Cell-Derived Neurons.Methods Mol Biol. 2022;2501:339-360. doi: 10.1007/978-1-0716-2329-9_17. Methods Mol Biol. 2022. PMID: 35857237
-
Screening and Cellular Characterization of Genetically Encoded Voltage Indicators Based on Near-Infrared Fluorescent Proteins.ACS Chem Neurosci. 2020 Nov 4;11(21):3523-3531. doi: 10.1021/acschemneuro.0c00046. Epub 2020 Oct 16. ACS Chem Neurosci. 2020. PMID: 33063984
-
Engineered heart tissue models from hiPSC-derived cardiomyocytes and cardiac ECM for disease modeling and drug testing applications.Acta Biomater. 2019 Jul 1;92:145-159. doi: 10.1016/j.actbio.2019.05.016. Epub 2019 May 7. Acta Biomater. 2019. PMID: 31075518
-
[Towards optical in vivo electrophysiology].Med Sci (Paris). 2016 8-9;32(8-9):768-70. doi: 10.1051/medsci/20163208026. Epub 2016 Sep 12. Med Sci (Paris). 2016. PMID: 27615186 Review. French.
-
Functional interrogation of neural circuits with virally transmitted optogenetic tools.J Neurosci Methods. 2020 Nov 1;345:108905. doi: 10.1016/j.jneumeth.2020.108905. Epub 2020 Aug 11. J Neurosci Methods. 2020. PMID: 32795553 Review.
Cited by
-
Plateau depolarizations in spontaneously active neurons detected by calcium or voltage imaging.Sci Rep. 2024 Oct 4;14(1):22787. doi: 10.1038/s41598-024-70319-4. Sci Rep. 2024. PMID: 39367010 Free PMC article.
-
Generation of 'semi-guided' cortical organoids with complex neural oscillations.Nat Protoc. 2024 Sep;19(9):2712-2738. doi: 10.1038/s41596-024-00994-0. Epub 2024 May 3. Nat Protoc. 2024. PMID: 38702386 Free PMC article. Review.
-
Stretchable Mesh Nanoelectronics for 3D Single-Cell Chronic Electrophysiology from Developing Brain Organoids.Adv Mater. 2022 Mar;34(11):e2106829. doi: 10.1002/adma.202106829. Epub 2022 Feb 6. Adv Mater. 2022. PMID: 35014735 Free PMC article.
-
Harnessing the potential of human induced pluripotent stem cells, functional assays and machine learning for neurodevelopmental disorders.Front Neurosci. 2025 Jan 8;18:1524577. doi: 10.3389/fnins.2024.1524577. eCollection 2024. Front Neurosci. 2025. PMID: 39844857 Free PMC article. Review.
-
Improved Sensitivity in a Modified Berkeley Red Sensor of Transmembrane Potential.ACS Chem Biol. 2024 Oct 18;19(10):2214-2219. doi: 10.1021/acschembio.4c00442. Epub 2024 Oct 2. ACS Chem Biol. 2024. PMID: 39358835
References
-
- Belinsky G. S., Rich M. T., Sirois C. L., Short S. M., Pedrosa E., Lachman H. M., et al. (2014). Patch-clamp recordings and calcium imaging followed by single-cell PCR reveal the developmental profile of 13 genes in iPSC-derived human neurons. Stem Cell Res. 12 101–118. 10.1016/j.scr.2013.09.014 - DOI - PMC - PubMed
Grants and funding
LinkOut - more resources
Full Text Sources
Research Materials