. 2021 May 26:12:657959.
doi: 10.3389/fphar.2021.657959. eCollection 2021.

Solifenacin/Mirabegron Induces an Acute Compliance Increase in the Filling Phase of the Capacity-Reduced Urinary Bladder: A Pressure-Volume Analysis in Rats

Affiliations

Solifenacin/Mirabegron Induces an Acute Compliance Increase in the Filling Phase of the Capacity-Reduced Urinary Bladder: A Pressure-Volume Analysis in Rats

Hsien-Yu Peng et al. Front Pharmacol. .

Abstract

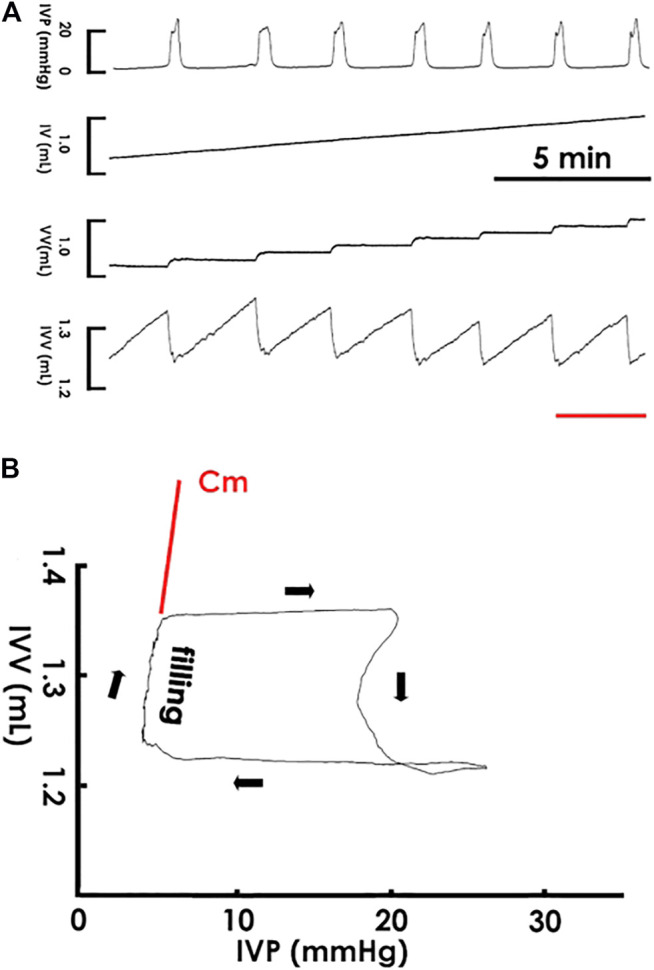
Aims: Pressure in the bladder, which is a high compliance organ, is only slightly elevated to a considerable filling volume during storage. Although cystometry off-line offers mean compliance, no protocol is available for real-time assays of the dynamics of bladder compliance, and the potential impact of solifenacin and mirabegron on dynamic bladder compliance has not been established. Methods: Along with constantly infused cystometry, a pressure-volume analysis (PVA) was performed by plotting intra-vesical volume against pressure in Sprague-Dawley rats. The instant compliance was assayed as the slope of the trajectory, and the mean compliance (Cm) was determined by the slope of the line produced by regression of the data points at the end of the first, second, and third quarters of the filling phase. Results: Under a steady-state, the PVA trajectory moved clockwise which shaped coincident enclosed loops with stable compliance. Though administering to naïve animals solifenacin, but not mirabegron (both 1 × 10⁻⁵-1 × 10⁻¹ mg/kg, i.a.) decreased the peak pressure, both of these reagents exhibited acute increments in the trajectory slope and Cm of the filling phase in a dose-dependent manner (ED50 = 1.4 × 10⁻⁴ and 2.2 × 10⁻⁵ mg/kg, respectively). Resembling urine frequency/urgency in OAB patients, the voiding frequency of a capacity-reduced bladder was increased in association with decreased compliance which was ameliorated by both acute solifenacin and mirabegron injections (both 1 × 10⁻¹ mg/kg). Conclusion: In addition to their well-known anti-inotropic/relaxative effects, solifenacin, and mirabegron induce an acute increase in bladder compliance to ameliorate OAB-like syndromes. Together with time-domain cystometry, PVA offers a platform for investigating the physiology/pathophysiology/pharmacology of bladder compliance which is crucial for urine storage.

Keywords: compliance; mirabegron; pressure-volume curve; solifenacin; urinary bladdder.


Conflict of interest statement

The authors declare that the research was conducted in the absence of any commercial or financial relationships that could be construed as a potential conflict of interest.

Figures

FIGURE 1
FIGURE 1
Cystometry and pressure-volume analysis. (A) Cystometry showing that saline infusion (0.04 ml/min) into the bladder provokes rhythmic voiding contractions with a constant frequency as well as uniformed peaks of IVP and fluctuations of intra-vesical volume (IVV). The red bar at the bottom marks the cycle displayed in the pressure-volume analysis. (B) A pressure-volume analysis established by plotting IVV against IVP. The data trajectory moves clockwise and shapes an enclosed loop. The left bolder of the loop represents the filling phase, and the instantaneous slope of the trajectory reflected the dynamic compliance at specific points of the filling phase. The slope of the regression line of the filling trajectory denotes the mean compliance (Cm) of a loop. IV, infused volume; VV, voided volume.
FIGURE 2
FIGURE 2
Cystometry and pressure-volume analysis of rhythmic voiding contractions. (A) Cystometry showing regular voiding contractions with a constant frequency at a period of 30 min. Red, blue, and green bars at the bottom of IVP mark the cycles displayed in the pressure-volume analysis. (B) Pressure-volume analysis showing overlapped loops. The mean compliance (Cm) of loops at the first (0–10; red), second (10–20; blue), and last (20–30; green) 10 min are well-coincident. (C) No statistical difference is evidenced in the peak pressure, post-void pressure, voiding frequency, voided volume, and Cm between contractions of the first, second, and last 10 min of the recording period. IVP, intra-vesical pressure; IV, infused volume; VV, voided volume; IVV, intra-vesical volume.
FIGURE 3
FIGURE 3
Solifenacin increases bladder compliance. (A) Cystometry before (control; CON) and following intra-arterial solifenacin (SF) injections with increasing concentrations (10−5−10−1 mg/kg, bolus). Red, blue, green, orange, pink, and black bars at the bottom of IVP mark the cycles displayed in the pressure-volume analysis. (B) Pressure-volume loops showing increasing concentrations of solifenacin progressively increases the slope of the regression line of the filling phase. (C) Dose-response analysis showing solifenacin step-wisely increases the mean compliance (Cm) with an ED50 at about 1.4 × 10⁻⁴ mg/kg. (D) While vehicle solution (VEH) displays no statistical difference in parameters, injection of solifenacin (1 × 10⁻¹ mg/kg; SF1X10−1) significantly decreases the peak pressure and voiding frequency but increases voided volume and Cm (*p < 0.05, **p < 0.01, vs. CON; all n = 7). IVP, intra-vesical pressure; IV, infused volume; VV, voided volume; IVV, intra-vesical volume.
FIGURE 4
FIGURE 4
Mirabegron increases bladder compliance. (A) Cystometry before (control; CON) and following intra-arterial mirabegron (MB) injections with increasing concentrations (10−5−10−1 mg/kg, bolus). Red, blue, green, orange, pink, and black bars at the bottom of IVP mark the cycles displayed in the pressure-volume analysis. (B) Pressure-volume loops showing increasing concentrations of mirabegron progressively increases the slope of the regression line of the filling phase. (C) Dose-response analysis showing mirabegron step-wisely increases the mean compliance (Cm) with an ED50 at about 2.2 × 10⁻⁵ mg/kg. (D) While vehicle solution (VEH) displays no statistical difference in parameters, injection of mirabegron (1 × 10⁻¹ mg/kg; MB1X10−1) significantly decreases the post-void pressure and voiding frequency but increases voided volume and Cm (*p < 0.05, **p < 0.01, vs. CON; all n = 7). IVP: intra-vesical pressure, IV: infused volume, VV: voided volume, IVV intra-vesical volume.
FIGURE 5
FIGURE 5
Solifenacin ameliorates bladder ligation-reduced compliance. (A) Cystometry before (control; CON) and in response to a partial bladder ligation (PBL) followed by intra-arterial injections of solifenacin (SF; 10-5 and 10−1 mg/kg, bolus). Red, blue, and green bars at the bottom of IVP mark the cycles displayed in the pressure-volume analysis. (B) Pressure-volume loops showing a partial bladder ligation reduces the slope of the regression line of the filling phase that is marked reversed by solifenacin with a concentration of 10−1 mg/kg (PBL + SF10−1). (C) A partial bladder ligation statistically increases the peak pressure, post-void pressure, voiding frequency but decreases voided volume and mean compliance (Cm; *p < 0.05, **p < 0.01, vs. CON; all n = 7) that are all ameliorated by solifenacin (1 × 10⁻¹ mg/kg; SF1X10−1) excepting the post-void pressure (# p < 0.05, vs. PBL; all n = 7). IVP, intra-vesical pressure; IV, infused volume; VV, voided volume, IVV intra-vesical volume.
FIGURE 6
FIGURE 6
Mirabegron ameliorates bladder ligation-reduced compliance. (A) Cystometry before (control; CON) and in response to a partial bladder ligation (PBL) followed by intra-arterial injections of mirabegron (MB; 10−5 and 10−1 mg/kg). Red, blue, and green bars at the bottom of IVP mark the cycles displayed in the pressure-volume analysis. (B) Pressure-volume loops showing a partial bladder ligation reduces the slope of the regression line of the filling phase that is marked reversed by mirabegron with a concentration of 10-1 mg/kg (MB + SF10−1). (C) A partial bladder ligation statistically increases the peak pressure, post-void pressure, voiding frequency but decreases voided volume and mean compliance (Cm; **p < 0.01, vs. CON; all n = 7) that are all ameliorated by mirabegron (10−1 mg/kg) excepting the peak pressure (# p < 0.05, ## p < 0.01 vs. PBL; all n = 7).

References

    1. Ali R. H., Gadallah N. A., El ZohieryEl Elwy A. K., Elwy M., Serag I. (2019). Neurophysiologic Study in Idiopathic Overactive Bladder. Neurourol. Urodyn. 38 (1), 223–230. 10.1002/nau.23834 - DOI - PubMed
    1. Cameron A. P., Clemens J. Q., Latini J. M., McGuire E. J. (2009). Combination Drug Therapy Improves Compliance of the Neurogenic Bladder. J. Urol. 182 (3), 1062–1067. 10.1016/j.juro.2009.05.038 - DOI - PubMed
    1. Cardozo L., Lisec M., Millard R., van Vierssen Trip O., Kuzmin I., Drogendijk T. E., et al. (2004). Randomized, Double-Blind Placebo Controlled Trial of the once Daily Antimuscarinic Agent Solifenacin Succinate in Patients with Overactive Bladder. J. Urol. 172 (5 Pt 1), 1919–1924. 10.1097/01.ju.0000140729.07840.16 - DOI - PubMed
    1. Chapple C. R., Cruz F., Cardozo L., Staskin D., Herschorn S., Choudhury N., et al. (2020). Safety and Efficacy of Mirabegron: Analysis of a Large Integrated Clinical Trial Database of Patients with Overactive Bladder Receiving Mirabegron, Antimuscarinics, or Placebo. Eur. Urol. 77 (1), 119–128. 10.1016/j.eururo.2019.09.024 - DOI - PubMed
    1. Chilman Blair K., Bosch J. L. (2004). Solifenacin: Treatment of Overactive Bladder. Drugs Today 40 (4), 343–353. 10.1358/dot.2004.40.4.820080 - DOI - PubMed