. 2021 May 28:12:670381.
doi: 10.3389/fphys.2021.670381. eCollection 2021.

De novo Explorations of Sarcopenia via a Dynamic Model

Affiliations

De novo Explorations of Sarcopenia via a Dynamic Model

Kuan Tao et al. Front Physiol. .

Abstract

Background: The cause of sarcopenia has been observed over decades by clinical trials, which, however, are still insufficient to systematically unravel the enigma of how resistance exercise mediates skeletal muscle mass. Materials and Methods: Here, we proposed a minimal regulatory network and developed a dynamic model to rigorously investigate the mechanism of sarcopenia. Our model is consisted of eight ordinary differential equations and incorporates linear and Hill-function terms to describe positive and negative feedbacks between protein species, respectively. Results: A total of 720 samples with 10 scaled intensities were included in simulations, which revealed the expression level of AKT (maximum around 3.9-fold) and mTOR (maximum around 5.5-fold) at 3, 6, and 24 h at high intensity, and non-monotonic relation (ranging from 1.2-fold to 1.7-fold) between the graded intensities and skeletal muscle mass. Furthermore, continuous dynamics (within 24 h) of AKT, mTOR, and other proteins were obtained accordingly, and we also predicted the delaying effect with the median of maximized muscle mass shifting from 1.8-fold to 4.6-fold during a 4-fold increase of delay coefficient. Conclusion: The de novo modeling framework sheds light on the interdisciplinary methodology integrating computational approaches with experimental results, which facilitates the deeper understandings of exercise training and sarcopenia.

Keywords: gut microbiota; mathematical model; protein synthesis; resistance training; sarcopenia.


Conflict of interest statement

The authors declare that the research was conducted in the absence of any commercial or financial relationships that could be construed as a potential conflict of interest.

Figures
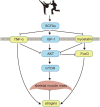
FIGURE 1
FIGURE 1
The schematic diagram of the minimal regulatory network. Exercise training (illustrated by two cartoon characters performing Chinese martial arts) enhances skeletal muscle protein metabolism by activities of the intestinal microbiome, which significantly promotes the expression of SCFAs (uSCFAs). Meanwhile, SCFAs increase the concentration of membrane receptor IGF-1 that recruits the phosphorylation of AKT (uAKT) and positively regulates mTOR (umTOR), which is deemed as the downstream target of AKT. On the other hand, SCFAs inhibit TNF−α (uTNF–α) which is a membrane-bound inflammatory cytokine produced by macrophages and myostatin (umyo) which is a growth factor controlling muscle fibers. Both TNF-α and myostatin deactivate the phosphorylation of AKT, enhancing the expression of atrogins (uatr) through ubiquitin-proteasome system and autophagy-lysosome pathways via the transcription factor FoxO (uFoxO), which is related with the apoptosis during muscle fibers metabolism and is suppressed by AKT. The skeletal muscle mass (umuscle) is balanced by synthesis and degradation processes, with the former activated by mTOR and the latter inhibited by atrogins. Black solid arrows indicate positive feedbacks between protein interactions, and negative feedbacks are denoted by ⊣.
FIGURE 2
FIGURE 2
The regulation of exercise intensity to the signaling pathways of AKT, mTOR, and muscle mass. (A,C) The discrete expression level changes of AKT and mTOR. The blue, tan, and green split lines represent low, moderate, and high intensities, respectively. Red dots mean the data are collected from baseline, 3, 6, and 24 h with basal values confirmed by control tests, which are characterized by steady expression levels of AKT and mTOR without exercise stimulations. (B,D) The continuous expression level changes of AKT and mTOR. Curves are the continuous dynamics of AKT and mTOR with colored lines of low, moderate, and high intensities, and red dots indicate data of a particular time step corresponding to (A) and (C). (E) Non-monotonic relationship between exercise intensity and maximized muscle mass. The leftmost column depicts the control test without stimulation of exercise training, and the colormap displays a wide range of variations of intensity. (F) A predicted curve regarding intensity and muscle mass under different delay coefficients. Dots in blue, scarlet, tan, and purple represent raw data generated from simulations, whereas the corresponding smooth curves stand for the fitted lines in the quadratic functions. The average coefficients of determination R2 = 0.7665 and the root-mean-square error RMSE = 0.2420.
FIGURE 3
FIGURE 3
The verifications and predictions of the proposed model. (A–D) The robustness of the non-monotonic relationship between exercise intensity and variation of the maximum muscle mass under perturbations of random noise in representative delay coefficients. Boxplots show the statistics of such relationships at different intensities with red bars in each subfigure reflecting control tests. The delay coefficient M increases from (A) to (D), simulations are run by 20 times for each condition under the same parameter sets, and the noise perturbation, defined as a Gaussian-distributed random variable N(0,1) with an amplitude of 0.001, is applied to each parameter in the model (Supplementary Table 1). Colored dots record the maximum muscle mass at varied exercise intensities for each experiment in silico. (E,F) The predicted dynamics of SCFAs and myostatin. Blue, scarlet, and tan curves stand for low, moderate, and high intensities, respectively. Simulations are run by the timespan of 24 h.

References

    1. Lipina C., Hundal H. S. (2017). Lipid modulation of skeletal muscle mass and function. Journal of cachexia, sarcopenia and muscle. 8 190–201. 10.1002/jcsm.12144 - DOI - PMC - PubMed
    1. Barclay R. D., Mackenzie R. W., Burd N. A., Tyler C. J., Tillin N. A. (2019). The Role of the IGF-1 Signalling Cascade in Muscle Protein Synthesis and Anabolic Resistance in Ageing Skeletal Muscle. Frontiers in nutrition. 6:146. 10.3389/fnut.2019.00146 - DOI - PMC - PubMed
    1. Bassey E. J., Fiatarone M. A., O’neill E. F., Kelly M., Evans W. J., Lipsitz L. A. (1992). Leg extensor power and functional performance in very old men and women. Clinical science. 82 321–327. 10.1042/cs0820321 - DOI - PubMed
    1. Fry C. S., Drummond M. J., Glynn E. L., Dickinson J. M., Gundermann D. M., Timmerman K. L., et al. (2011). Aging impairs contraction-induced human skeletal muscle mTORC1 signaling and protein synthesis. Skeletal muscle. 1 1–11. - PMC - PubMed
    1. Kakigi R., Yoshihara T., Ozaki H., Ogura Y., Ichinoseki-Sekine N., Kobayashi H., et al. (2014). Whey protein intake after resistance exercise activates mTOR signaling in a dose-dependent manner in human skeletal muscle. European Journal of Applied Physiology. 114 735–742. 10.1007/s00421-013-2812-7 - DOI - PubMed