. 2021 May 26:12:616631.
doi: 10.3389/fpls.2021.616631. eCollection 2021.

The Sterol Trafficking Pathway in Arabidopsis thaliana

Affiliations

The Sterol Trafficking Pathway in Arabidopsis thaliana

Krishna Kumar et al. Front Plant Sci. .

Abstract

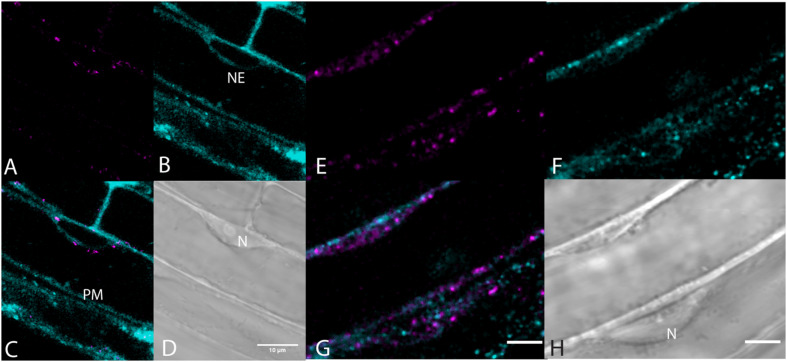
In plants, the trafficking mechanisms by which sterols move through the plant and into target cells are unknown. Earlier studies identified endosomes as primary candidates for internalization of sterols in plants, but these results have come into question. Here, we show that in elongating root cells, the internalization of sterol occurs primarily by a non-endocytic mechanism. Added fluorescent sterols [dehydroergosterol (DHE) and BODIPY-cholesterol (BCh)] do not initially label endosomes identified by fluorescent protein markers or by internalized FM4-64. Instead, the nuclear envelope, an organelle not associated with the endocytic pathway but part of the endoplasmic reticulum (ER), becomes labeled. This result is supported by experiments with the inducible overexpression of auxilin-2-like protein (AUX2 line), which blocks most endocytosis upon induction. Internalization and nuclear envelope labeling still occur in induced AUX2 cells. Longer-term incubation labels the oil body, a site involved in sterol storage. Although the first site of localization, the nuclear envelope, is part of the ER, other domains of the ER do not accumulate the label. The trafficking pathway differs from vesicular endocytosis and points toward a different pathway of sterol transport possibly involving other mechanisms, such as ER-plasma membrane contact sites and cytoplasmic transport.

Keywords: ER transport; endocytosis; nuclear envelope; oil body; sterol transport; sterol uptake.


Conflict of interest statement

The authors declare that the research was conducted in the absence of any commercial or financial relationships that could be construed as a potential conflict of interest.

Figures

FIGURE 1
FIGURE 1
Root hair tip localization of BCh, filipin, and DHE in 5-day-old Arabidopsis seedlings labeled for 60 min with both dyes and 30 μM MβCD. (A) 10 μM BCh localization primarily in the tips of the root hairs. (B) 15 μM filipin labeling of root hair tips and along the PM of epidermal cells in the mature regions of the root. (C) Merged image of (A and B). (D) Bright-field image of the root. Scale bar = 100 μm. (E) Emergent root hair labeled with BCh for 20 min, similar to that shown in the upper part of A. Scale bar = 10 μm. (F) Emergent root hair at the base of an epidermal cell labeled for 20 min with DHE. Scale bar = 10 μm.
FIGURE 2
FIGURE 2
Labeling of the NE with DHE in elongating root cells. (A–C) Seedlings expressing SINE2-GFP were incubated for 30 min in DHE and fluorescence after multiphoton excitation was measured. (A) Emission at 405/20 nm for DHE. (B) Emission at 525/50 nm for SINE2-GFP. (C) Merged image of the DHE signal (cyan) and the SINE2-GFP signal (magenta). Scale bar = 20 μm. (D) Profile plot of line shown in (C). PM indicates peak from PM. NE indicates peaks from the membranes of the NE. (E–G) Seedlings expressing SINE2-GFP were incubated for 30 min in DHE as in (A), but the nuclei of these cells lie against the PM. (E) DHE signal. (F) SINE2-GFP signal. (G) Merged image. (H) Averages of profile plots of five similarly sized (smaller than the nucleus in A–D) nuclei show a bimodal distribution of intensity peaking at the NE. The error bars indicate standard deviation. (I–L) Seedlings expressing SUN-RFP were incubated for 30 min in the vital dye fluorescein diacetate to label the cytoplasm. (I) Fluorescein signal. (J) SUN-RFP signal. (K) Merged image. Scale bar = 10 μm. (L) Bright-field image. (M) Average of five profile plots of nuclei that lie against the PM, including the one shown in (I–L). The error bars indicate standard deviation.
FIGURE 3
FIGURE 3
NE label with BCh. (A–E) Comparison of BCh staining after 25 min with expression of cytosolic mCherry. (A) BCh signal. (B) cytoplasmic mCherry signal. (C) Merged image of (A and B), showing the line across which the profile was analyzed. (D) Bright-field image. N, nucleus. Scale bar = 10 μm. (E) Average line plot values (plus/minus standard deviation) of four nuclei lying flat against the plasma membrane, as in (A–D). Note that mCherry has a broad peak and that BCh has two peaks at the edges of the nuclei. (F–K) BCh label after 30 min and colocalization of the label with the NE marker SUN-RFP. (F) BCh labels the PM and the NE of cells in the elongation zone of roots. (G) SUN-RFP expression in the NE of the cells shown in (F). (H) Merged fluorescence micrographs (F,H). Scale bar = 10 μm. (I) DIC image of the fluorescent region in (F–H). (J) Fluorescence in the 4 μm line outlined in region 1 of (F–H) that crosses the NE. (K) Fluorescence in the 4 μm line in region 2 of (F–H). In (F and G), the fluorescence intensity in the BCh channel is green, while that in the SUN-RFP channel is red.
FIGURE 4
FIGURE 4
Uptake of BCh and DHE into the NE over time. (A) Average fluorescence intensity of BCh taken over a region containing the NE with an equivalent area of the adjacent cytoplasmic fluorescence subtracted in plants expressing SUN-RFP. Error bars are the standard deviation of five separate samples. Inset shows the identification of the NE and adjacent cytoplasm in the SUN-RFP channel. (B) Average fluorescence intensity of DHE uptake into NE in plants expressing SINE2-GFP. The fluorescence background in the cytoplasmic region has been subtracted. Error bars are the standard deviation of five separate cells.
FIGURE 5
FIGURE 5
Comparison of mCherry-HDEL label (magenta) of the NE and cortical ER with BCh label (cyan, 16 h). (A) mCherry-HDEL label of the NE in cell 1 and the cortical ER and glancing optical section of the nucleus (N) in cell 3. (B) BCh label of the NE in cell 1 and diffuse label of the cortical region of the cytoplasm in cell 3. Double arrow points to the region on the glancing section of nucleus. Single arrow points to PM. (C) Merged image of (A and B). (D) Bright-field image N, nuclei. The nucleus in cell 3 is in the glancing optical section. Scale bar = 10 μm.
FIGURE 6
FIGURE 6
Label with BCh colocalizes with the PM and NE in elongating root cells. Five-day-old seedlings expressing NPSN12-mCherry were treated with BCh for 15 min. (A) PM marker NPSN12-mCherry fluorescence (magenta). (B) BCh signal (cyan). Line profiles in (A and B) are the same, and intensities are plotted in (E and F). (C) Merged image, NE, nuclear envelope. (D) Bright-field image, N, nucleus. Scale bar = 10 μm. (E) Percentage of maximal fluorescence along line profile 1 in (A) NPSN12-mCherry (magenta) and (B) BCh (cyan). (F) Percentage of maximal fluorescence along line profile 2 in (A) NPSN12-mCherry (magenta) and (B) BCh (cyan). Colocalization at the PM is shown for two different cells at the center peak. NE peaks from (B) are shown as NE in (E).
FIGURE 7
FIGURE 7
Lack of endosome labels, VTI12-mCherry, and RabF2a-mCherry, with BCh of the elongating root cells. (A–D) Structures labeled after 30 min of incubation in BCh (cyan) in plants expressing the early endosome/trans-Golgi marker, VTI12-mCherry (magenta). (A) Fluorescence of VTI12-mCherry organelles. (B) Fluorescence of BCh labels the NE and the PM. (C) Merged image of (A and B), where magenta endosomes are outside the NE and in the cytoplasm. (D) DIC micrograph showing the nucleus (N). Scale bar = 10 μm. (E–H) Structures labeled with BCh (cyan) after 30 min in plants expressing RabF2a-mCherry (magenta). (E) Late endosomes labeled with RabF2a-mCherry. (F) BCh (cyan) labels the PM and non-endosomal punctae in the cytosol. (G) Merged image of (E and F) showing magenta endosomes that do not colocalize with the non-endosomal cyan punctae. (H) DIC image showing a glancing optical section of the nucleus (N). Scale bars in (G) and (H) = 5 μm.
FIGURE 8
FIGURE 8
Labeling of elongating root cells with BCh (cyan, A) and FM4-64 (magenta, B) after 30 min of co-incubation. (A) Fluorescent structures associated with the PM and in the cytoplasm. (B) Red fluorescent, mostly motile, endosomes labeled with FM 4-64 after 30 min. (C) Merged image of (A and B) – punctate structures do not colocalize. BCh labels immobile (im) and motile (mo) structures. (D) Bright-field image. rb, refractile body. Images taken at 9 s intervals. Scale bar = 5 μm.
FIGURE 9
FIGURE 9
Analysis of uptake in AUX2 expression lines. Confocal micrographs of elongating root cells following (A–D) 30 min labeling with BCh in (A) the wild-type (WT) Arabidopsis line, (B) WT line pretreated with 9 mM β-estradiol, (C) the AUX2 line, and (D) the AUX2 line pretreated with 9 mM β-estradiol; (E–F) 30 min labeling with FM4-64 in (E) the AUX2 line and (F) the AUX2 line pretreated with 9 mM β-estradiol. (G) Quantitation of label intensity per square micrometer of cytoplasm in four to five different cells in three different plants. (b) column values <0.05p compared to (a) column values, n, nucleus. Scale bars = 10 μm.
FIGURE 10
FIGURE 10
Colocalization of BCh in Nile Red-labeled oil bodies in elongating root cells labeled for 30 min with both probes. (A) Fluorescence of BCh at the PM and in the cytoplasm. The inset is a cyan binary mask of the brightest organelles in the image (>128 of 256 gray levels) in the region of the cell shown. (B) Fluorescence of Nile Red at the PM and cytoplasm. The inset is a magenta binary mask of the brightest organelles in the image (>128 of 256 gray levels) in the region of the cell shown and marks the oil bodies. (C) Merged image of (A and B), where the inset is a composite mask of the insets in (A and B), showing that the majority of bright organelles are white, or colocalized. (D) Bright-field micrograph of the cell. Scale bar = 5 μm.

References

    1. Adamowski M., Narasimhan M., Kania U., Glanc M., De Jaeger G., Friml J. (2018). A functional study of AUXILIN-LIKE1 and 2, two putative clathrin uncoating factors in Arabidopsis. Plant Cell 30 700–716. 10.1105/tpc.17.00785 - DOI - PMC - PubMed
    1. Behmer S. T., Olszewski N., Sebastiani J., Palka S., Sparacino G., Sciarrno E., et al. (2013). Plant phloem sterol content: forms, putative functions, and implications for phloem-feeding insects. Front. Plant Sci. 4:370. 10.3389/fpls.2013.00370 - DOI - PMC - PubMed
    1. Behrman E. J., Gopalan V. (2005). Cholesterol and plants. J. Chem. Educ. 82 1791–1793. 10.1021/ed082p1791 - DOI
    1. Bolte S., Talbot C., Boutte Y., Catrice O., Read N. D., Satiat-Jeunemaitre B. (2004). FM-dyes as experimental probes for dissecting vesicle trafficking in living plant cells. J. Microsc. 214 159–173. 10.1111/j.0022-2720.2004.01348.x - DOI - PubMed
    1. Boutte Y., Grebe M. (2009). Cellular processes relying on sterol function in plants. Curr. Opin. Plant Biol. 12 705–713. 10.1016/j.pbi.2009.09.013 - DOI - PubMed

LinkOut - more resources