

Reactive organic carbon emissions from volatile chemical products
- PMID: 34122530
- PMCID: PMC8193795
- DOI: 10.5194/acp-21-5079-2021
Reactive organic carbon emissions from volatile chemical products
Abstract
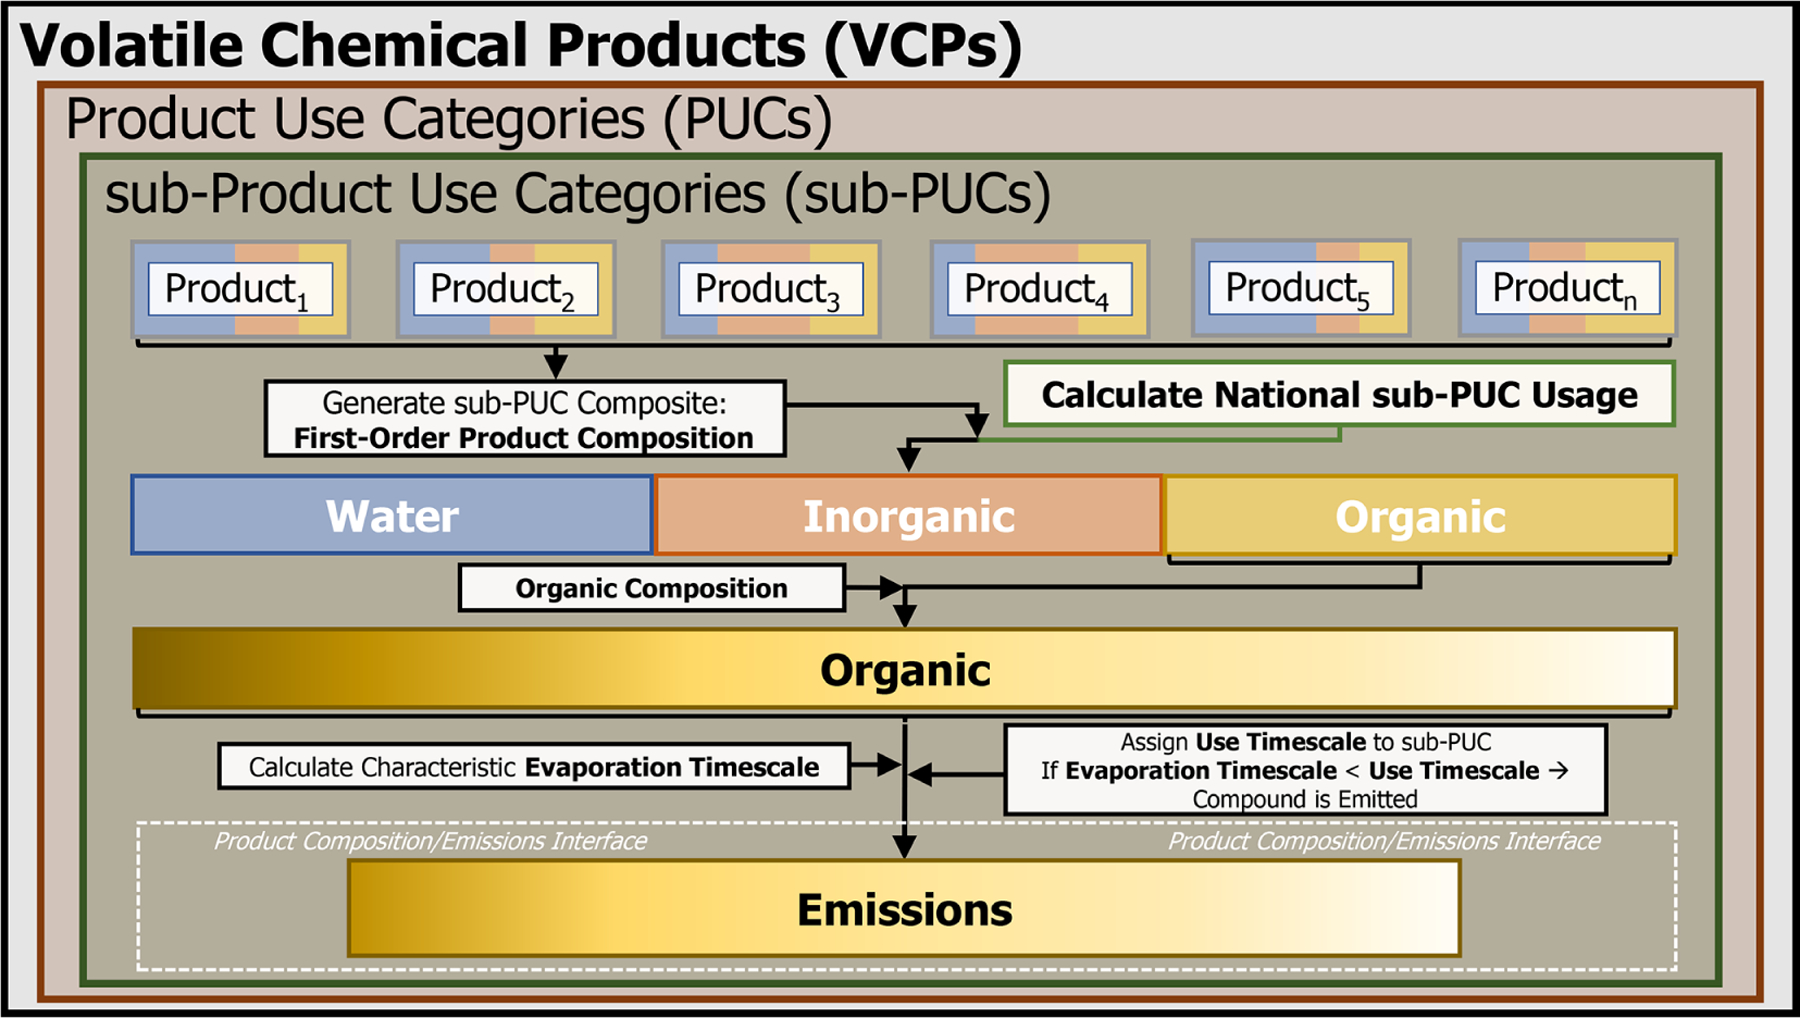
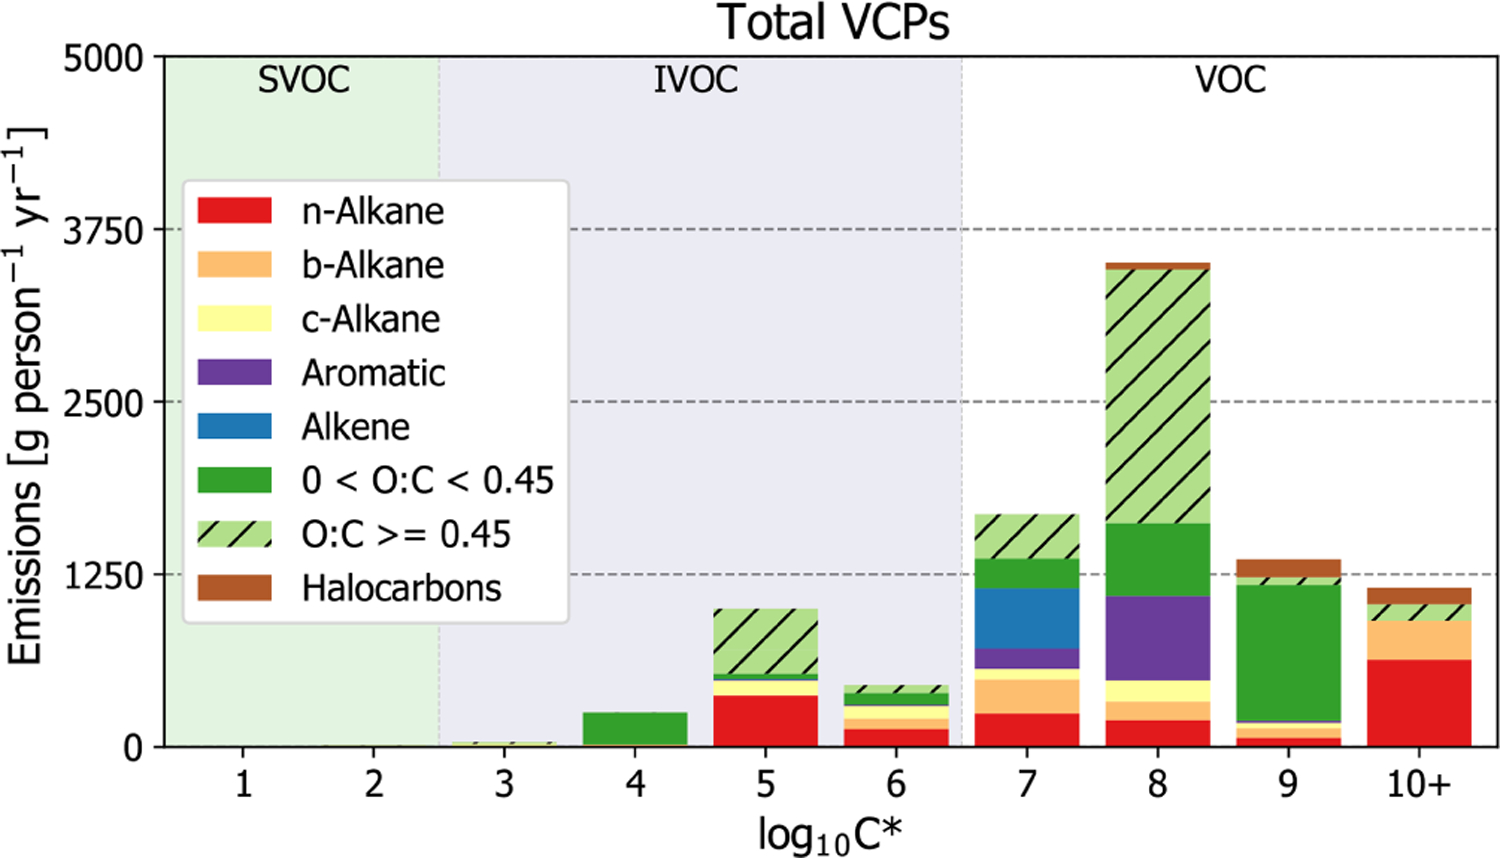
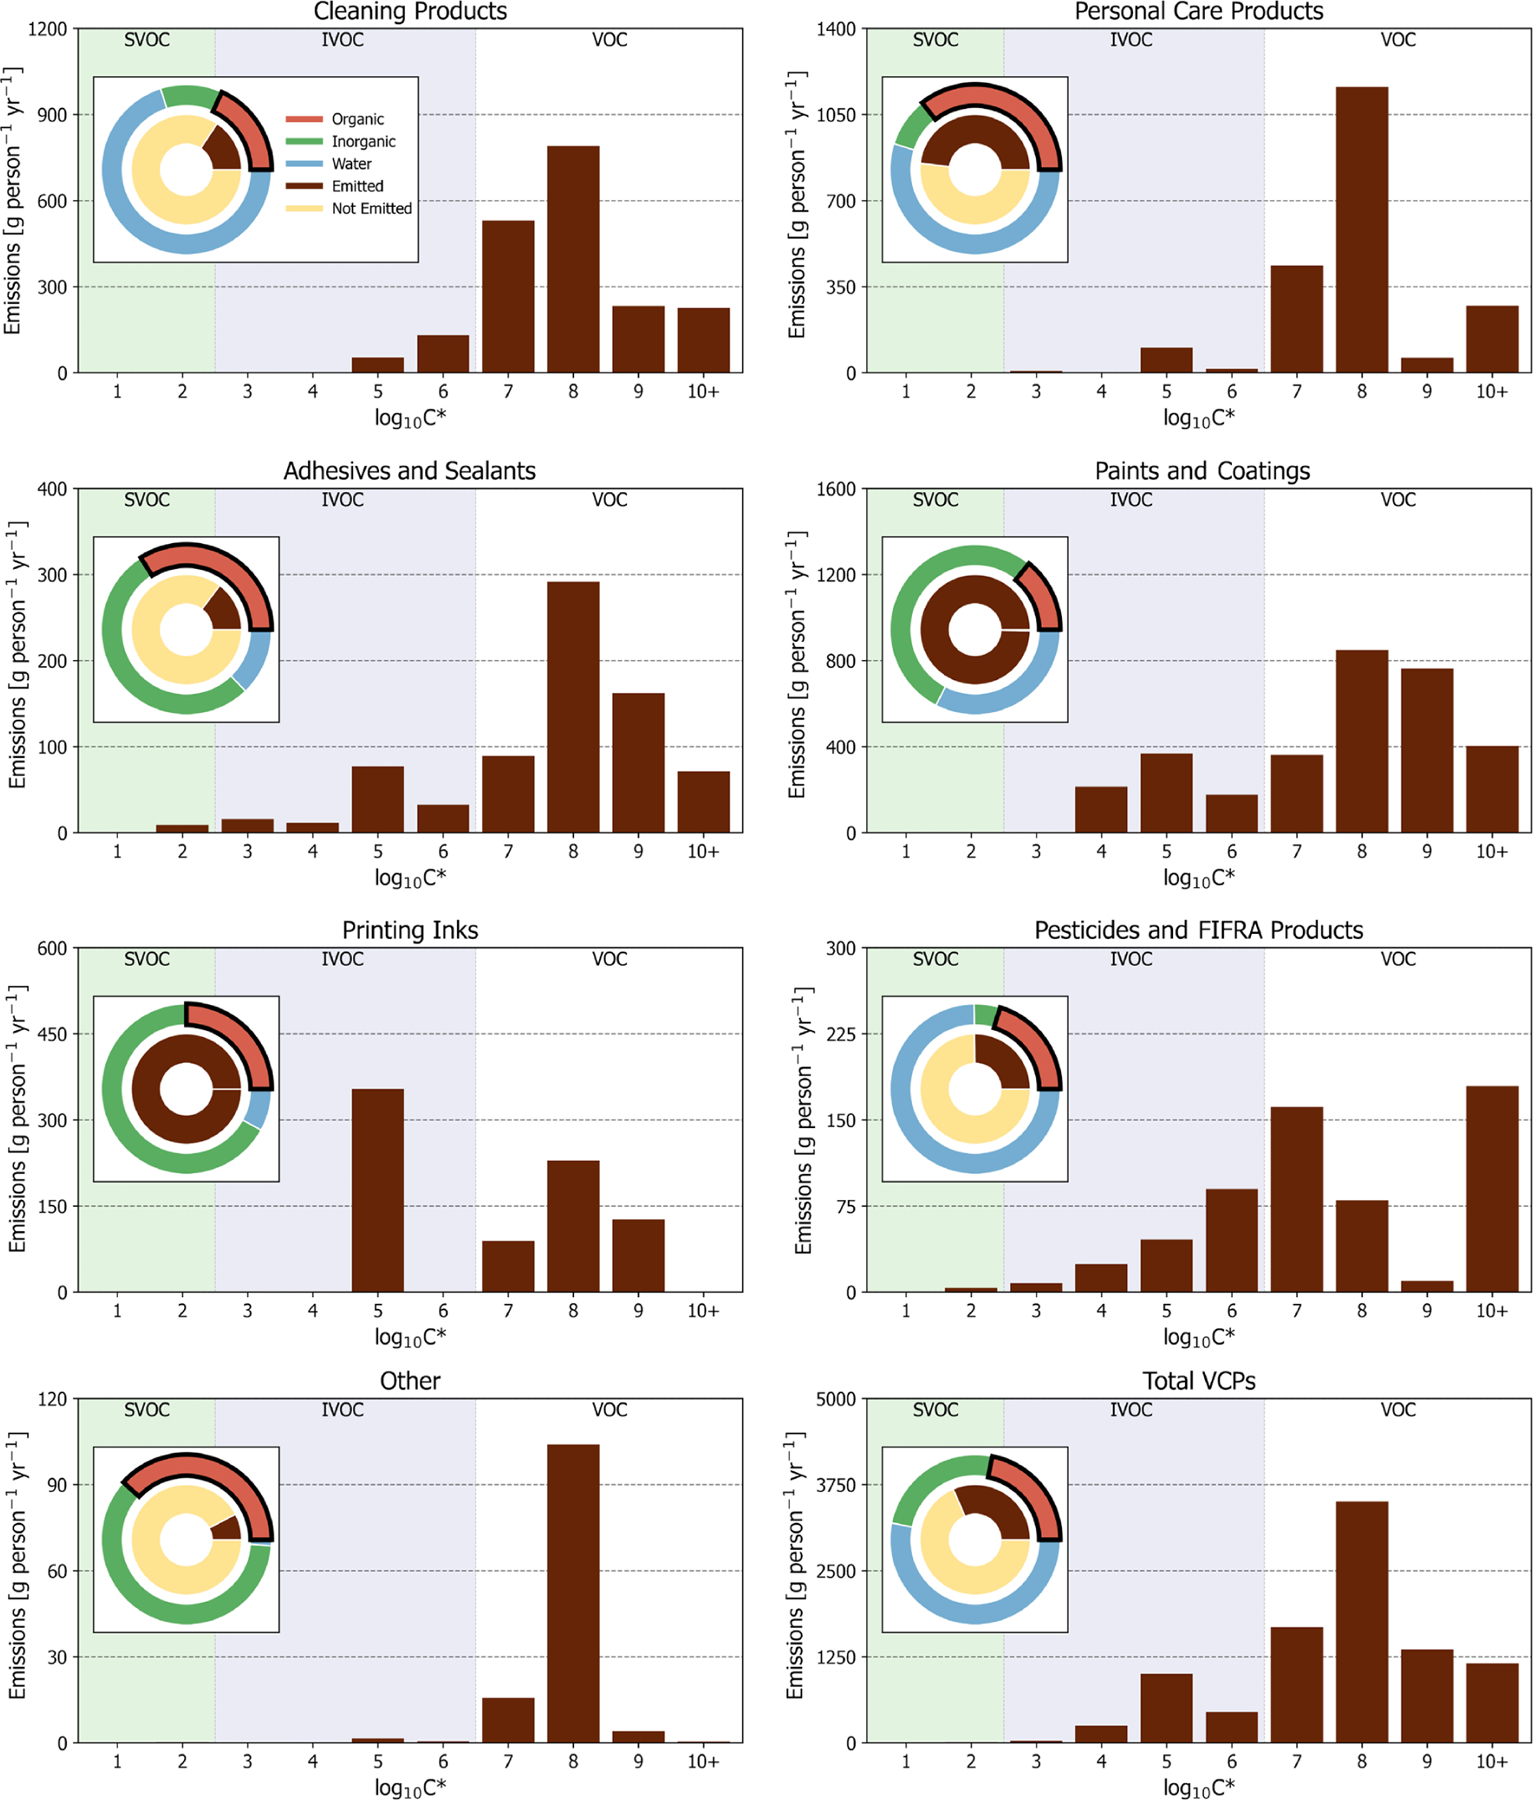
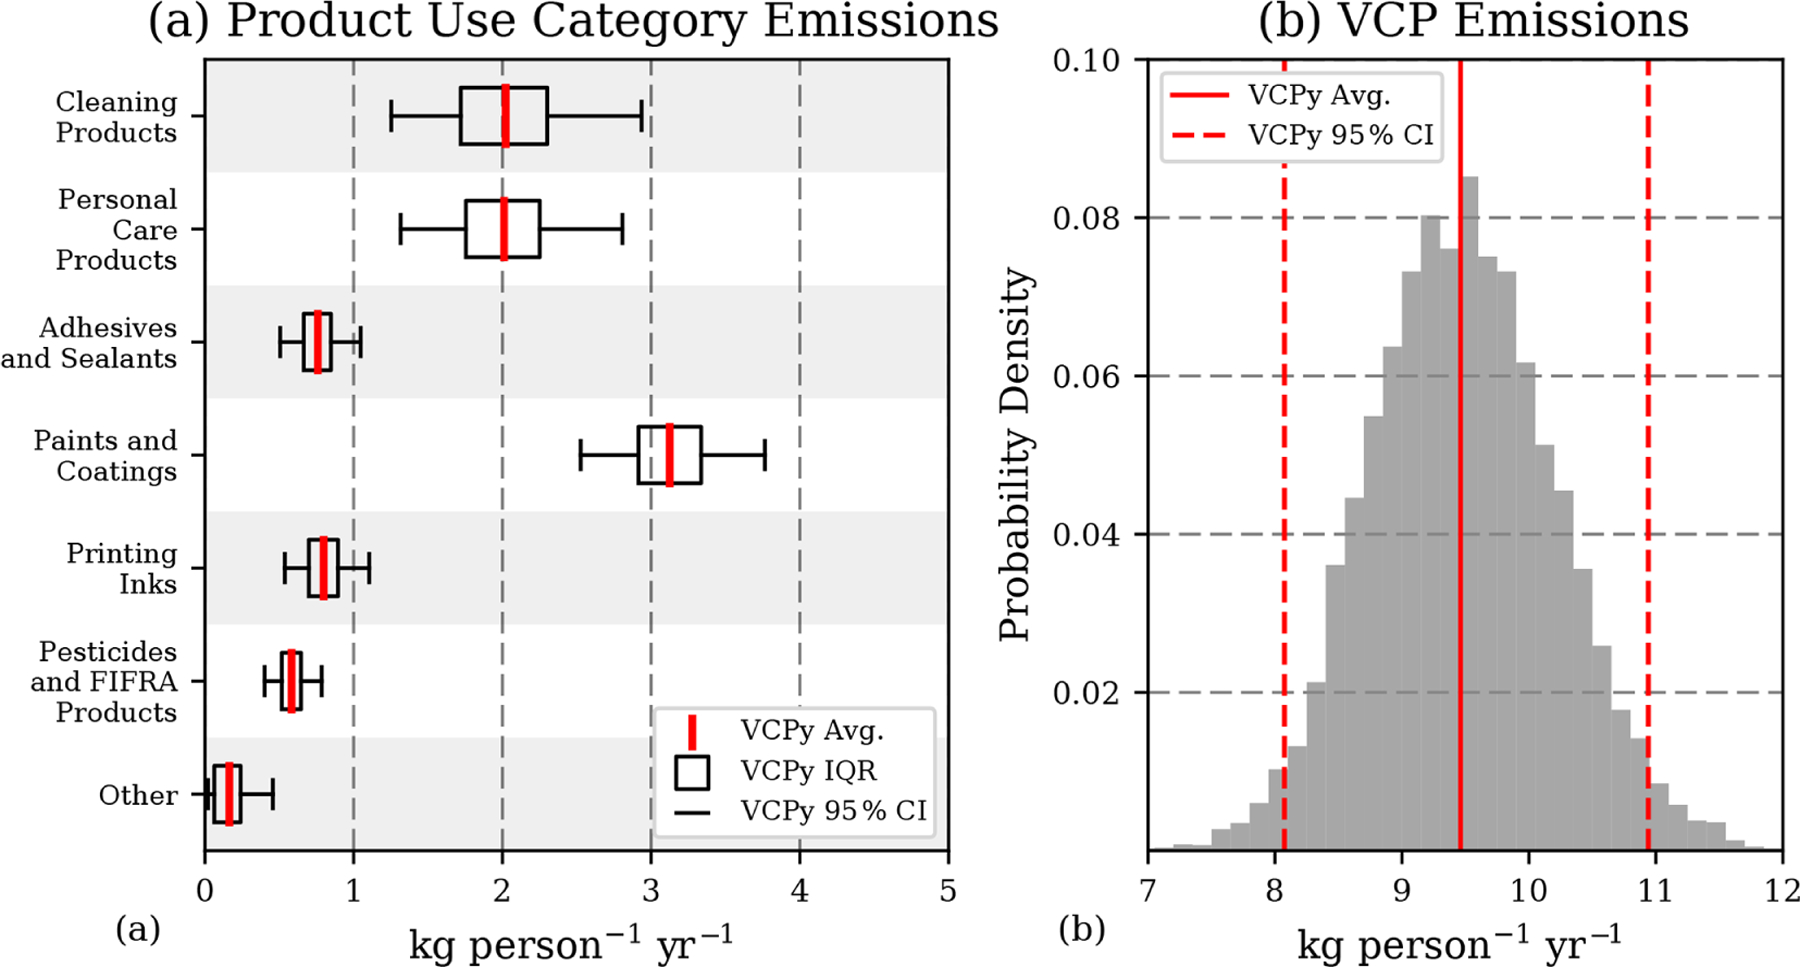
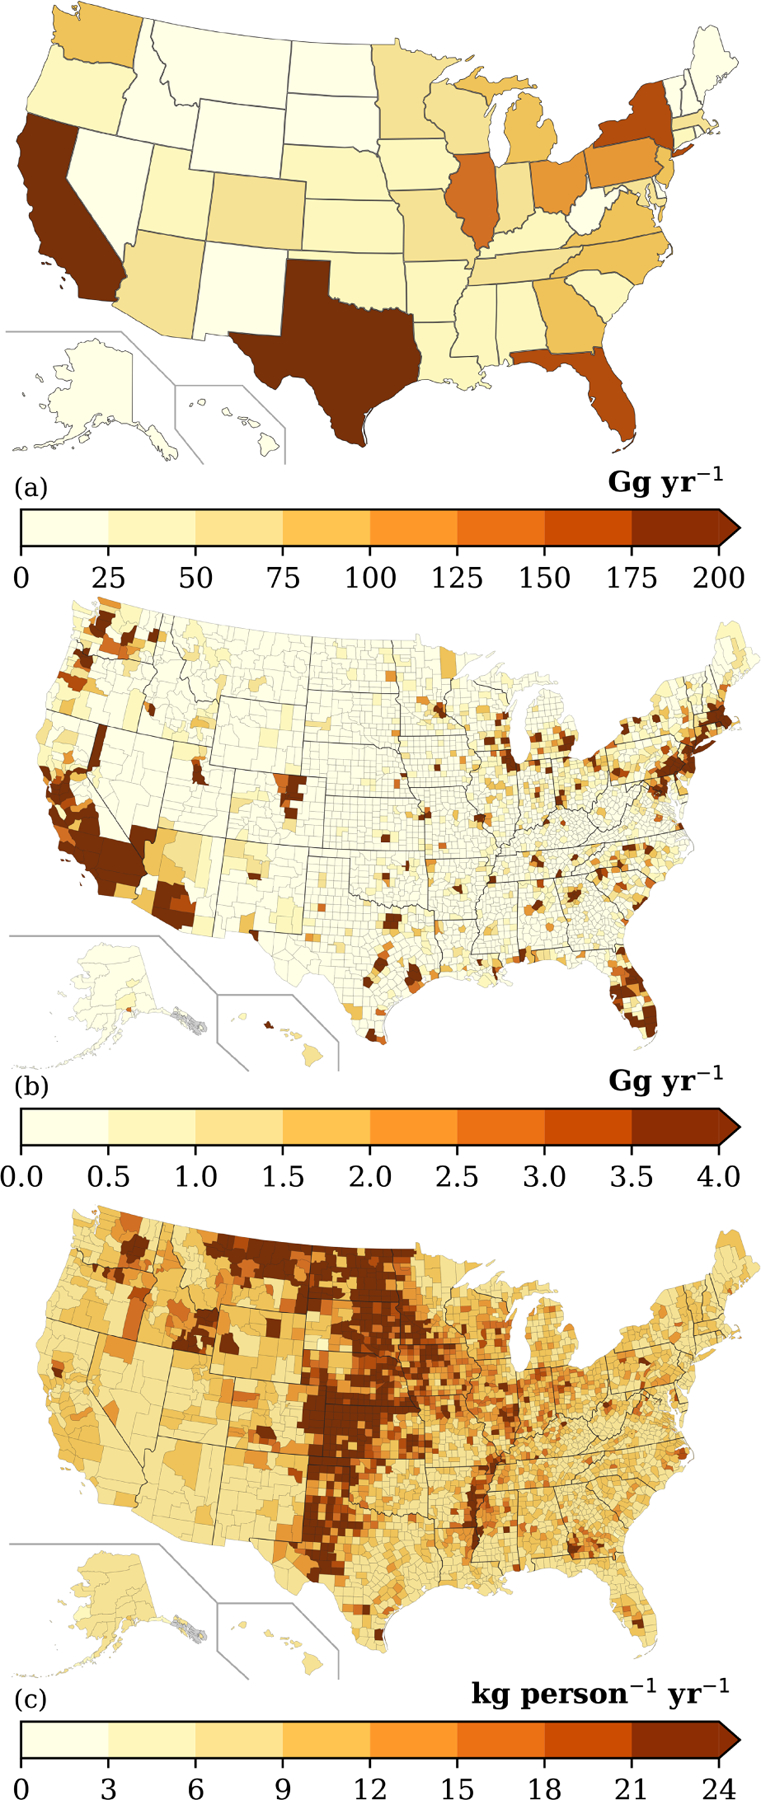
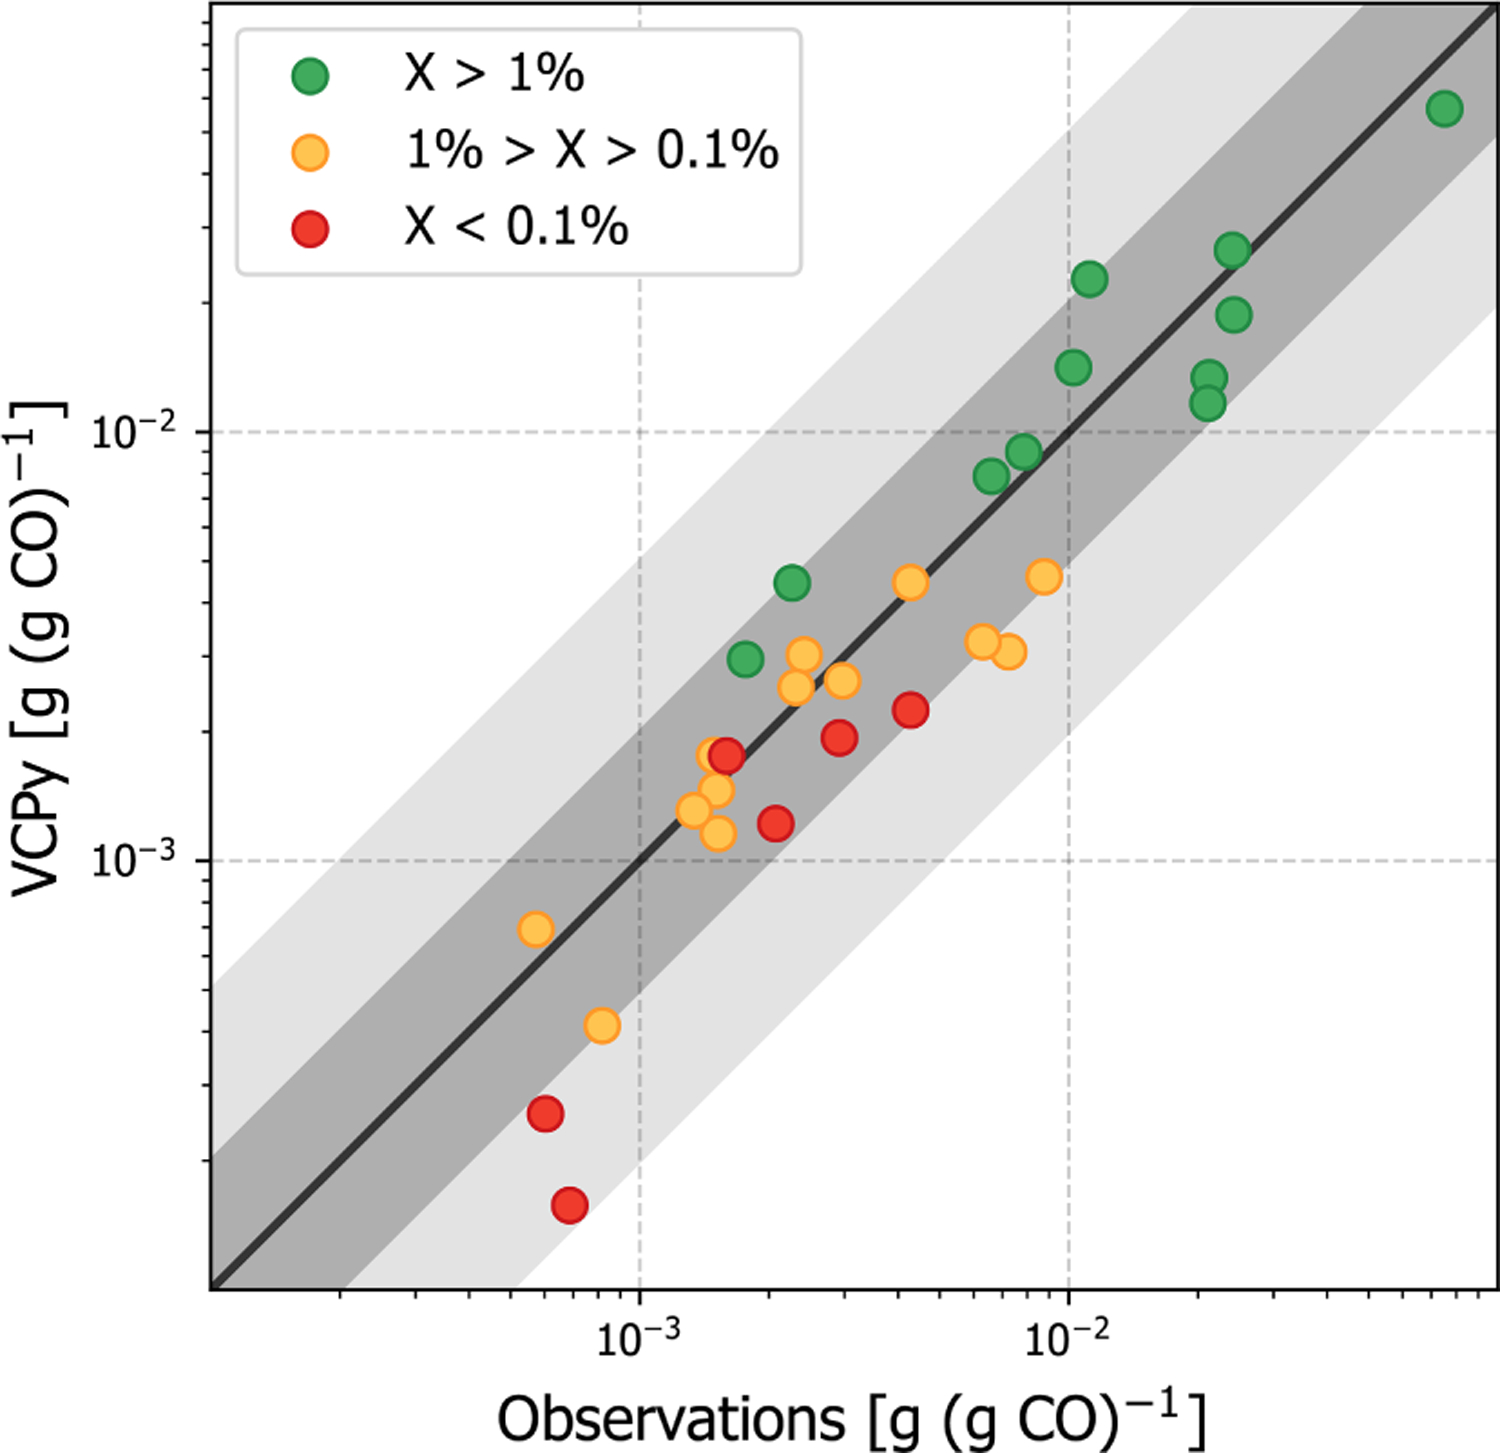
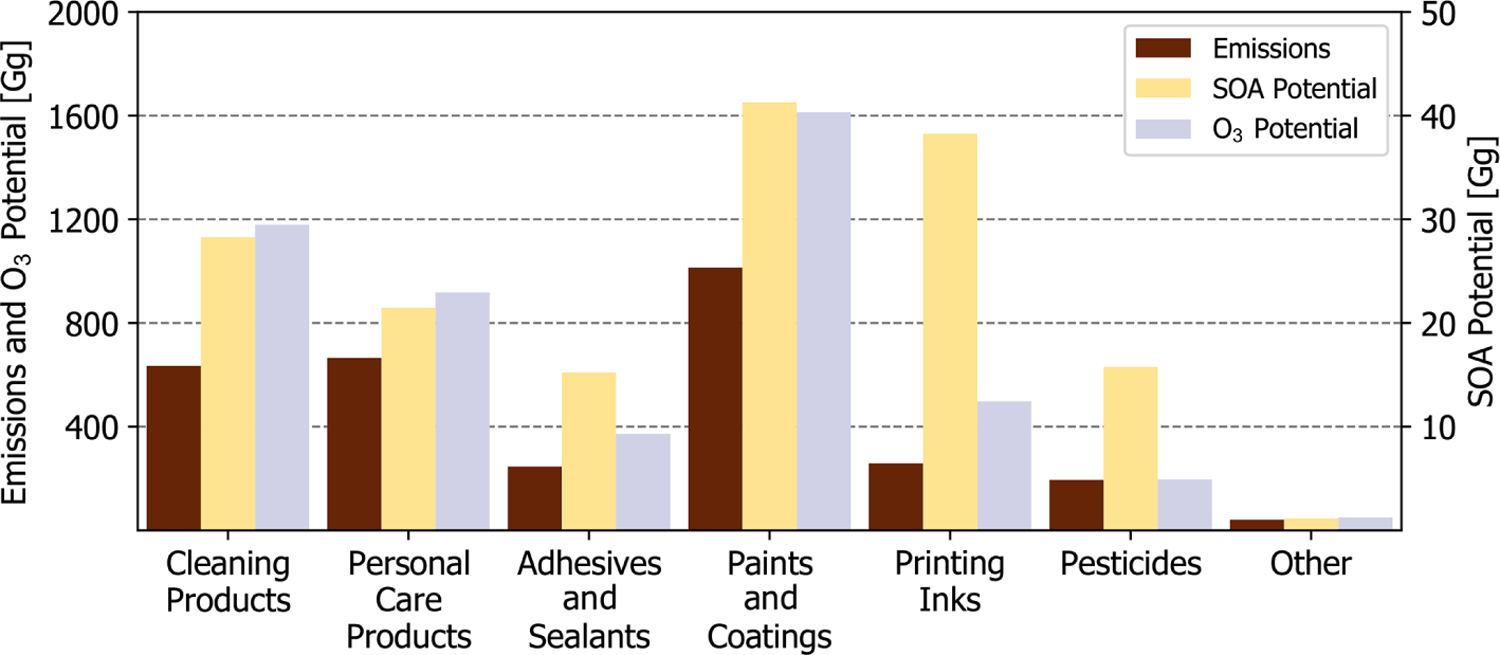
Volatile chemical products (VCPs) are an increasingly important source of anthropogenic reactive organic carbon (ROC) emissions. Among these sources are everyday items, such as personal care products, general cleaners, architectural coatings, pesticides, adhesives, and printing inks. Here, we develop VCPy, a new framework to model organic emissions from VCPs throughout the United States, including spatial allocation to regional and local scales. Evaporation of a species from a VCP mixture in the VCPy framework is a function of the compound-specific physiochemical properties that govern volatilization and the timescale relevant for product evaporation. We introduce two terms to describe these processes: evaporation timescale and use timescale. Using this framework, predicted national per capita organic emissions from VCPs are 9.5 kg per person per year (6.4 kg C per person per year) for 2016, which translates to 3.05 Tg (2.06 Tg C), making VCPs a dominant source of anthropogenic organic emissions in the United States. Uncertainty associated with this framework and sensitivity to select parameters were characterized through Monte Carlo analysis, resulting in a 95 % confidence interval of national VCP emissions for 2016 of 2.61-3.53 Tg (1.76-2.38 Tg C). This nationwide total is broadly consistent with the U.S. EPA's 2017 National Emission Inventory (NEI); however, county-level and categorical estimates can differ substantially from NEI values. VCPy predicts higher VCP emissions than the NEI for approximately half of all counties, with 5 % of all counties having greater than 55 % higher emissions. Categorically, application of the VCPy framework yields higher emissions for personal care products (150 %) and paints and coatings (25 %) when compared to the NEI, whereas pesticides (-54 %) and printing inks (-13 %) feature lower emissions. An observational evaluation indicates emissions of key species from VCPs are reproduced with high fidelity using the VCPy framework (normalized mean bias of -13 % with r =0.95). Sector-wide, the effective secondary organic aerosol yield and maximum incremental reactivity of VCPs are 5.3 % by mass and 1.58 gO3 g-1, respectively, indicating VCPs are an important, and likely to date underrepresented, source of secondary pollution in urban environments.
Conflict of interest statement
Competing interests. The authors declare that they have no conflict of interest.
Figures
References
-
- Baker KR, Carlton AG, Kleindienst TE, Offenberg JH, Beaver MR, Gentner DR, Goldstein AH, Hayes PL, Jimenez JL, Gilman JB, de Gouw JA, Woody MC, Pye HOT, Kelly JT, Lewandowski M, Jaoui M, Stevens PS, Brune WH, Lin Y-H, Rubitschun CL, and Surratt JD: Gas and aerosol carbon in California: comparison of measurements and model predictions in Pasadena and Bakersfield, Atmos. Chem. Phys, 15, 5243–5258, 10.5194/acp-15-5243-2015, 2015. - DOI
-
- Bash JO, Baker KR, and Beaver MR: Evaluation of improved land use and canopy representation in BEIS v3.61 with biogenic VOC measurements in California, Geosci. Model Dev, 9, 2191–2207, 10.5194/gmd-9-2191-2016, 2016. - DOI
-
- Borbon A, Gilman JB, Kuster WC, Grand N, Chevaillier S, Colomb A, Dolgorouky C, Gros V, Lopez M, Sarda-Esteve R, Holloway J, Stutz J, Petetin H, McKeen S, Beekmann M, Warneke C, Parrish DD, and de Gouw JA: Emission ratios of anthropogenic volatile organic compounds in northern mid-latitude megacities: Observations versus emission inventories in Los Angeles and Paris, J. Geophys. Res.-Atmos, 118, 2041–2057, 10.1002/jgrd.50059, 2013. - DOI
Grants and funding
LinkOut - more resources
Full Text Sources
Research Materials
Miscellaneous