Surface-enhanced Raman spectroscopy: benefits, trade-offs and future developments
- PMID: 34122914
- PMCID: PMC8159237
- DOI: 10.1039/d0sc00809e
Surface-enhanced Raman spectroscopy: benefits, trade-offs and future developments
Abstract
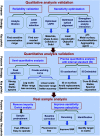
Surface-enhanced Raman spectroscopy (SERS) is a vibrational spectroscopy technique with sensitivity down to the single molecule level that provides fine molecular fingerprints, allowing for direct identification of target analytes. Extensive theoretical and experimental research, together with continuous development of nanotechnology, has significantly broadened the scope of SERS and made it a hot research field in chemistry, physics, materials, biomedicine, and so on. However, SERS has not been developed into a routine analytical technique, and continuous efforts have been made to address the problems preventing its real-world application. The present minireview focuses on analyzing current and potential strategies to tackle problems and realize the SERS performance necessary for translation to practical applications.
This journal is © The Royal Society of Chemistry.
Conflict of interest statement
The authors declare no competing financial interest.
Figures


Similar articles
-
Core-Shell Nanostructure-Enhanced Raman Spectroscopy for Surface Catalysis.Acc Chem Res. 2020 Apr 21;53(4):729-739. doi: 10.1021/acs.accounts.9b00545. Epub 2020 Feb 7. Acc Chem Res. 2020. PMID: 32031367
-
A review of developments and applications of thin-film microextraction coupled to surface-enhanced Raman scattering.Electrophoresis. 2019 Aug;40(16-17):2041-2049. doi: 10.1002/elps.201800531. Epub 2019 May 31. Electrophoresis. 2019. PMID: 31127635 Review.
-
Intensity Fluctuations in Single-Molecule Surface-Enhanced Raman Scattering.Acc Chem Res. 2019 Feb 19;52(2):456-464. doi: 10.1021/acs.accounts.8b00563. Epub 2019 Jan 22. Acc Chem Res. 2019. PMID: 30668089
-
Spiers Memorial Lecture. Surface-enhanced Raman spectroscopy: from single particle/molecule spectroscopy to ångstrom-scale spatial resolution and femtosecond time resolution.Faraday Discuss. 2017 Dec 4;205:9-30. doi: 10.1039/c7fd00181a. Faraday Discuss. 2017. PMID: 28906524
-
Recent Developments in Surface-Enhanced Raman Spectroscopy and Its Application in Food Analysis: Alcoholic Beverages as an Example.Foods. 2022 Jul 21;11(14):2165. doi: 10.3390/foods11142165. Foods. 2022. PMID: 35885407 Free PMC article. Review.
Cited by
-
Uncovering low-frequency vibrations in surface-enhanced Raman of organic molecules.Nat Commun. 2024 Aug 7;15(1):6733. doi: 10.1038/s41467-024-50823-x. Nat Commun. 2024. PMID: 39112490 Free PMC article.
-
3D nanoplasmonic structure for ultrahigh enhanced SERS with less variability, polarization independence, and multimodal sensing applied to picric acid detection.Nanoscale Adv. 2024 Sep 18;6(22):5681-93. doi: 10.1039/d4na00387j. Online ahead of print. Nanoscale Adv. 2024. PMID: 39309513 Free PMC article.
-
Surface-Enhanced Raman Spectroscopy (SERS)-Based Sensors for Deoxyribonucleic Acid (DNA) Detection.Molecules. 2024 Jul 16;29(14):3338. doi: 10.3390/molecules29143338. Molecules. 2024. PMID: 39064915 Free PMC article. Review.
-
Spectroscopic characterization and in vitro studies of biological activity of bradykinin derivatives.Sci Rep. 2022 Nov 8;12(1):19015. doi: 10.1038/s41598-022-23448-7. Sci Rep. 2022. PMID: 36348016 Free PMC article.
-
Three-dimensional porous SERS powder for sensitive liquid and gas detections fabricated by engineering dense "hot spots" on silica aerogel.Nanoscale Adv. 2020 Dec 8;3(4):1012-1018. doi: 10.1039/d0na00849d. eCollection 2021 Feb 23. Nanoscale Adv. 2020. PMID: 36133286 Free PMC article.
References
-
- Aroca R., in Surface-Enhanced Vibrational Spectroscopy, John Wiley & Sons Ltd, England, 2007, ch. 2, pp. 35–71
-
- Fleischmann M. Hendra P. J. McQuillan A. J. Chem. Phys. Lett. 1974;26:163–166. doi: 10.1016/0009-2614(74)85388-1. - DOI
-
- Albrecht M. G. Creighton J. A. J. Am. Chem. Soc. 1977;99:5215–5217. doi: 10.1021/ja00457a071. - DOI
-
- Jeanmaire D. L. Van Duyne R. P. J. Electroanal. Chem. 1977;84:1–20. doi: 10.1016/S0022-0728(77)80224-6. - DOI
Publication types
LinkOut - more resources
Full Text Sources
Other Literature Sources
Miscellaneous

