. 2020 Jul 23;11(33):8723-8735.
doi: 10.1039/d0sc02241a.

In situ tissue pathology from spatially encoded mass spectrometry classifiers visualized in real time through augmented reality

Affiliations

In situ tissue pathology from spatially encoded mass spectrometry classifiers visualized in real time through augmented reality

Michael Woolman et al. Chem Sci. .

Abstract

Integration between a hand-held mass spectrometry desorption probe based on picosecond infrared laser technology (PIRL-MS) and an optical surgical tracking system demonstrates in situ tissue pathology from point-sampled mass spectrometry data. Spatially encoded pathology classifications are displayed at the site of laser sampling as color-coded pixels in an augmented reality video feed of the surgical field of view. This is enabled by two-way communication between surgical navigation and mass spectrometry data analysis platforms through a custom-built interface. Performance of the system was evaluated using murine models of human cancers sampled in situ in the presence of body fluids with a technical pixel error of 1.0 ± 0.2 mm, suggesting a 84% or 92% (excluding one outlier) cancer type classification rate across different molecular models that distinguish cell-lines of each class of breast, brain, head and neck murine models. Further, through end-point immunohistochemical staining for DNA damage, cell death and neuronal viability, spatially encoded PIRL-MS sampling is shown to produce classifiable mass spectral data from living murine brain tissue, with levels of neuronal damage that are comparable to those induced by a surgical scalpel. This highlights the potential of spatially encoded PIRL-MS analysis for in vivo use during neurosurgical applications of cancer type determination or point-sampling in vivo tissue during tumor bed examination to assess cancer removal. The interface developed herein for the analysis and the display of spatially encoded PIRL-MS data can be adapted to other hand-held mass spectrometry analysis probes currently available.


Conflict of interest statement

There are no conflicts to declare.

Figures

Fig. 1
Fig. 1. Spatially encoded mass spectrometry results for augmented reality display of tissue pathology at the point of sampling. In this figure we have shown (A): the components required for spatially encoded mass spectrometry for in situ display of tissue pathology at the sampling site, and how components interact with one another. Sampling of tissue is performed using an aerosolization method to produce mass spectra. The mass spectral data is then compared to a pre-existing multivariate model (or library) of pathologies and a classification is made. In the case of our demonstrated application, the sampling is performed with PIRL-MS and the multivariate analysis is completed with AMX using PCA-LDA. The pathology classification is available in real-time, and is combined with positional information (coordinates) of the sampling probe from the tracking data imported into a laboratory built ‘integrator’ program, GTxEyes. The import is enabled through a custom-made link that transfers the classifier from AMX to GTxEyes. Then, a real-time display of the color coded pathology (in GTxEyes) becomes possible using previous integration of a camera feed of the sampling field of view in this software. (B) Schematics of the system components in panel A and how they interact. Where appropriate, we have secured permission to reuse graphics. The NDI Polaris tracking camera monitors the probe position as well as that of the Logitech tracked camera that provides the live video feed of the sampling event. MS signal is processed and subjected to multivariate analysis with AMX. All components feed data to GTxEyes platform that in turn integrates the molecular information from MS analysis with positioning data for augmented reality display of spatially encoded mass spectrometry classifiers. Here, in situ sampling of a mouse xenograft tumor results in tissue type classifier from MS to be false colored and displayed on an augmented reality screen at the site of sampling. Conceptual demonstration of the output display of spatially encoded mass spectrometry using graphic files partially published previously (with permission from the Royal Society of Chemistry and the American Association for Cancer Research). Graphic files are reproduced here after modifications, and illustrate the output display using PIRL-MS and xenograft tissue.
Fig. 2
Fig. 2. Spatially encoded PIRL-MS sampling of cancer for in situ pathology determinations with real-time display of results. An augmented reality display of false colored tissue pathology classifiers from PCA-LDA modeling of mass spectrometry readout (PIRL-MS) is presented where each classification (i.e. pathology assessment) is color coded at the point of sampling (laser tip) on a camera feed of the sampling field of view. This figure provides example results for both cancer border assessment applications (using ex vivo tissue) as in (A) and for in situ pathology (using sacrificed tumor bearing mice) as in (B). (A) An artificial tissue boundary for the assessment of spatially encoded PIRL-MS results is created by placing a murine xenograft medulloblastoma tumor piece adjacent to a normal mouse brain tissue piece. The PIRL-MS probe was scanned over, and crossed the tissue border at a continuous pace (green trace) where at every 5 seconds classification of the averaged data against a two-component (healthy mouse brain and Med8A cancer) PCA-LDA model using previous data was made. This classification is displayed at the spatially encoded position that concludes the 5 second sampling period and changes from healthy to cancer as the boundary is crossed. The real-time video that shows the continuous scan and augmented reality display of the classifications as they are made available real-time is provided as a ESI. (B) Validation of in situ pathology application using tumor bearing mice (summarized in Table 1). Here, subcutaneous bilateral injections of cells for Med8A and DAOY subgroups of medulloblastoma resulted in small 1 mm3 and ∼3.3 mm3 tumors highlighted by circles to guide readers to their locations. These subgroups, previously shown to be classifiable with PIRL-MS, were subjected to spatially encoded PIRL-MS classifications using a 3-component DAOY, Med8A and muscle tissue signatures. The expected false colored spatially encoded classifications for these small tumors at the site of sampling (laser tip) resulted. A similar validation approach was taken to evaluate the performance over other cancer types summarized in Table 1 where good metrics have been reported.
Fig. 3
Fig. 3. Evaluation of PIRL-MS damage to neuronal tissue using a murine model under real use scenario of producing classifiable PIRL-MS mass spectra. Craniotomy, as described in the experimental section, was performed that allowed laser probe and scalpel access to the brain tissue. Superficial ‘incisions’ with PIRL-MS, while collecting mass spectra (n = 8), and with surgical scalpel (no collection of spectra) were made under anesthesia. (A) PCA-LDA model of mouse organ data from previous results using a mixture of fresh or frozen ex vivo tissue where we show in vivo data points acquired from live mice under anesthesia classifying as expected with the organ type suggesting that the presence of blood or body fluids is not hindering the classification. (B) The experimental setup with mouse anesthetized and restrained in stereotactic device before localized craniotomy and application of PIRL probe or scalpel to create superficial incisions . (C) Schematics of the histological workflow for the analysis of the extent of neuronal damage. As detailed in the experimental section, digital pathology was used to quantify the extent of damage from stain positive cells using TUNEL (DNA damage), Caspase-3 (cell death) and NeuN (neuronal viability). Each tissue section at end-point was divided into 4 quadrants as shown in ‘segmentation’ panel where, through taking advantage of the biological symmetry in brain tissue, we compared the extent of probe insult at the damaged quadrant (where the laser probe or the surgical scalpel intersected with the brain matter) to the control quadrant (that did not interact with the laser or scalpel probes). Any damage in the control quadrant results from extraction of brain from the skull after sacrifice. As shown in this panel, probe insult in the damaged quadrant (marked with the arrow) is superficial and is compounded with damage caused by the craniotomy process itself. Therefore, all damage values reported and compared in a relative sense between laser and scalpel are reported as ‘probe + craniotomy’ damage. Control quadrant values are reported to illustrate sensitivity. However, PIRL-MS classifying spectra presented in panel (A) indicate that some level of neurological insult was created under the experimental conditions.
Fig. 4
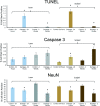
Fig. 4. Histopathological analysis of laser-induced damage to neuronal tissue in a mouse model suggests non-inferiority of PIRL compared to surgical scalpel. As detailed in the main text, DNA damage (TUNEL stain), cell death (Caspase 3 stain) and neuronal viability (NeuN stain) were evaluated using 76 histological slides from 19 mice (n = 9 for laser and n = 10 for scalpel) using digital pathology methods that quantify number of stain positive cells. Two endpoints of 24 hours (to quantify immediate neurologic insult) and two weeks (to quantify long term damage) were taken. Control measurements in each bar graph refer to measurements of stain positive cells from the control quadrant per schematics shown in Fig. 3C. Error bars represent standard error of the mean. Even in cases where no drastic differences between control and experimental measurements are seen, the visual inspection of the histopathologic slides suggests removal of some material in the damaged quadrant (see Fig. 3C). With the caveat that ‘missing’ material could contain some of the damaged cells that then do not appear in the analysis, introducing a bias, we confirm mice survived PIRL-MS sampling. Asterisks show statistically significant measurements in each cohort compared to its control. With the exception of Caspase 3 stain statistically significant differences between control and experimental measurements were seen in other cases. The extent of the damage, however, was not different between laser and scalpel suggesting non-inferiority. This observation held true over the three stains. The onset of immediate DNA damage (TUNEL stain) insult seen with the laser and scalpel (that largely recovered over two weeks), is likely due to the invasiveness of the craniotomy process itself (Fig. S4†). To compare laser and scalpel damage two-sample t-tests (assuming unequal variance, a = 0.05) were conducted for the laser and scalpel damaged regions at 24 hours and 2 weeks. There was a statistically significant decrease in TUNEL staining in the 2 week laser-damaged group relative to the 2 week scalpel-damaged group (p = 0.035). In all other cases, differences were not statistically significant. Therefore, our tests suggest non-inferior performance for PIRL-MS sampling in terms of neuronal tissue damage compared to the surgical scalpel.

References

    1. Zhang J. et al., Nondestructive tissue analysis for ex vivo and in vivo cancer diagnosis using a handheld mass spectrometry system. Sci. Transl. Med. 2017;9:eaan3968. doi: 10.1126/scitranslmed.aan3968. doi: 10.1126/scitranslmed.aan3968. - DOI - DOI - PMC - PubMed
    1. Balog J. et al., Intraoperative tissue identification using rapid evaporative ionization mass spectrometry. Sci. Transl. Med. 2013;5:194ra193. doi: 10.1126/scitranslmed.3005623. doi: 10.1126/scitranslmed.3005623. - DOI - DOI - PubMed
    1. Woolman M. et al., Picosecond Infrared Laser Desorption Mass Spectrometry Identifies Medulloblastoma Subgroups on Intrasurgical Timescales. Cancer Res. 2019;79:2426–2434. doi: 10.1158/0008-5472.CAN-18-3411. doi: 10.1158/0008-5472.CAN-18-3411. - DOI - DOI - PubMed
    1. Saudemont P. et al., Real-Time Molecular Diagnosis of Tumors Using Water-Assisted Laser Desorption/Ionization Mass Spectrometry Technology. Cancer Cell. 2018;34:840–851. doi: 10.1016/j.ccell.2018.09.009. doi: 10.1016/j.ccell.2018.09.009. - DOI - DOI - PubMed
    1. Schafer K. C. et al., Real time analysis of brain tissue by direct combination of ultrasonic surgical aspiration and sonic spray mass spectrometry. Anal. Chem. 2011;83:7729–7735. doi: 10.1021/ac201251s. doi: 10.1021/ac201251s. - DOI - DOI - PubMed