. 2019 Dec 27;11(7):1862-1877.
doi: 10.1039/c9sc05103a.

Towards theoretical spectroscopy with error bars: systematic quantification of the structural sensitivity of calculated spectra

Affiliations

Towards theoretical spectroscopy with error bars: systematic quantification of the structural sensitivity of calculated spectra

Tobias G Bergmann et al. Chem Sci. .

Abstract

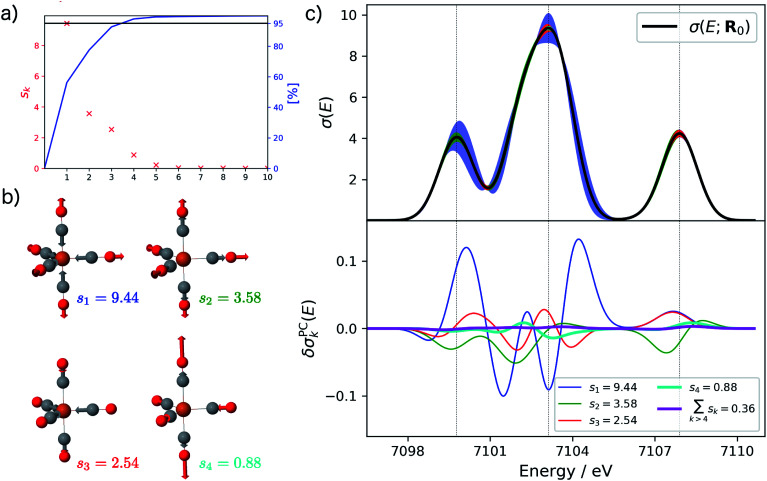
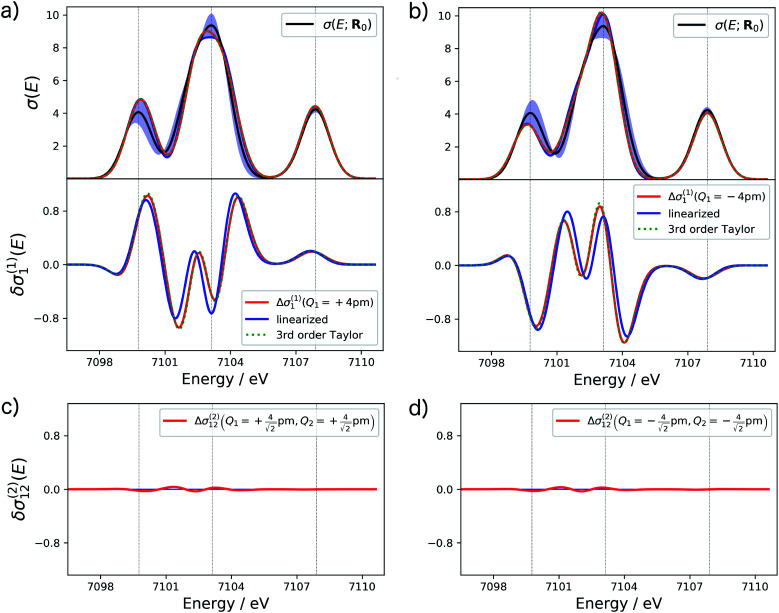
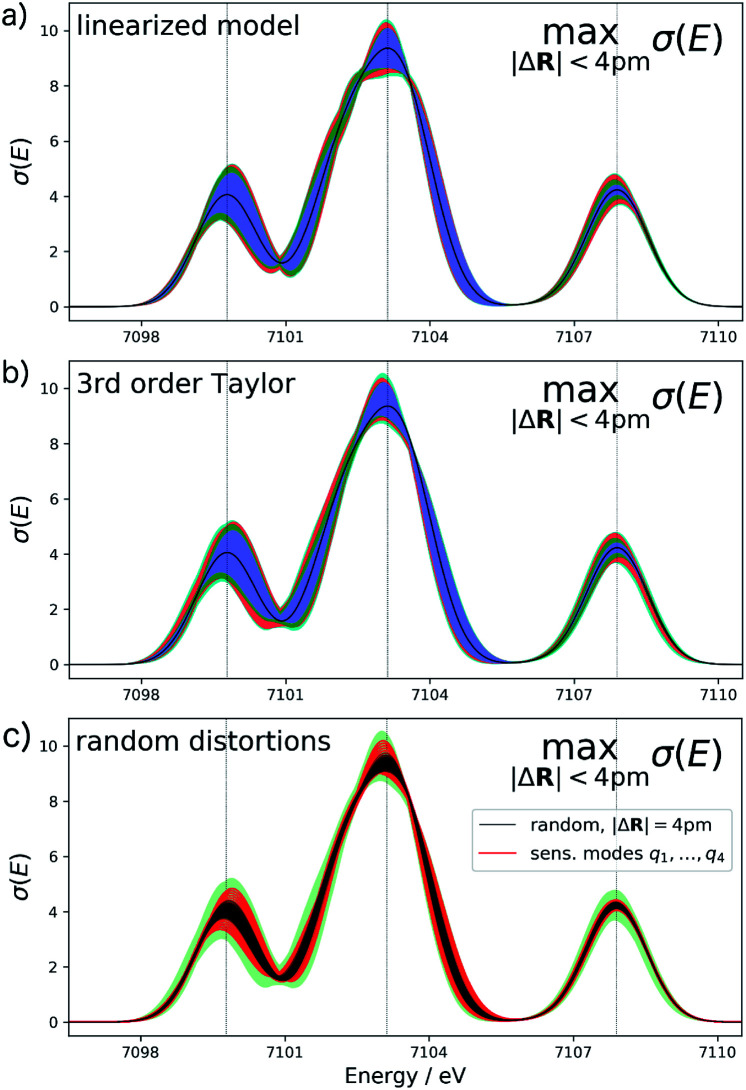
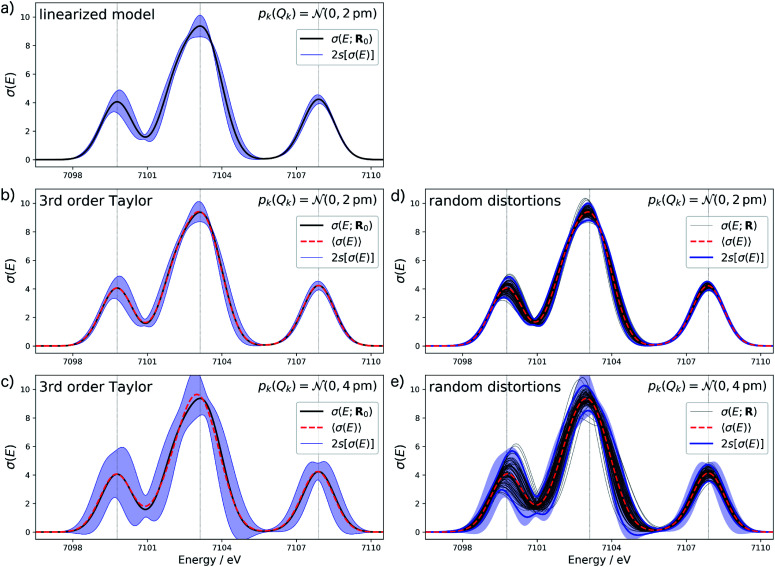
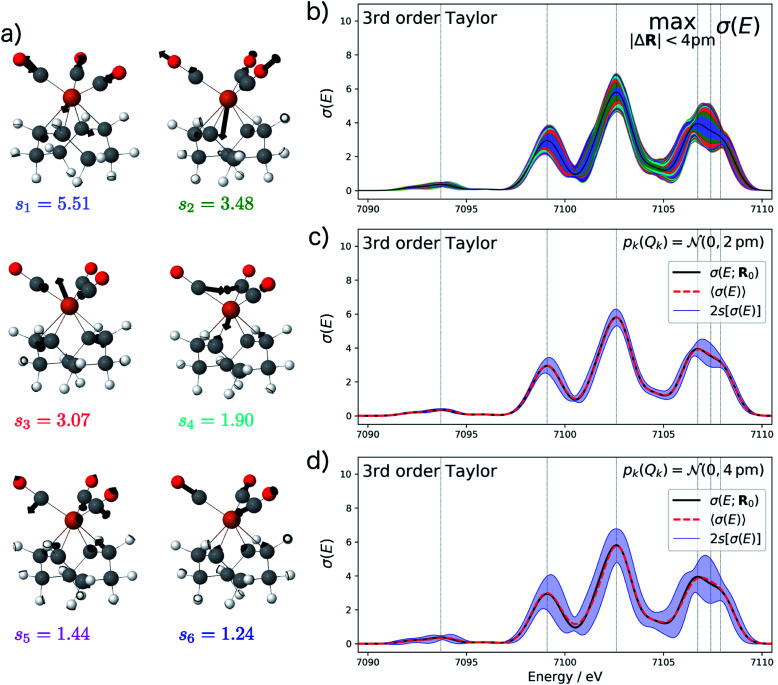
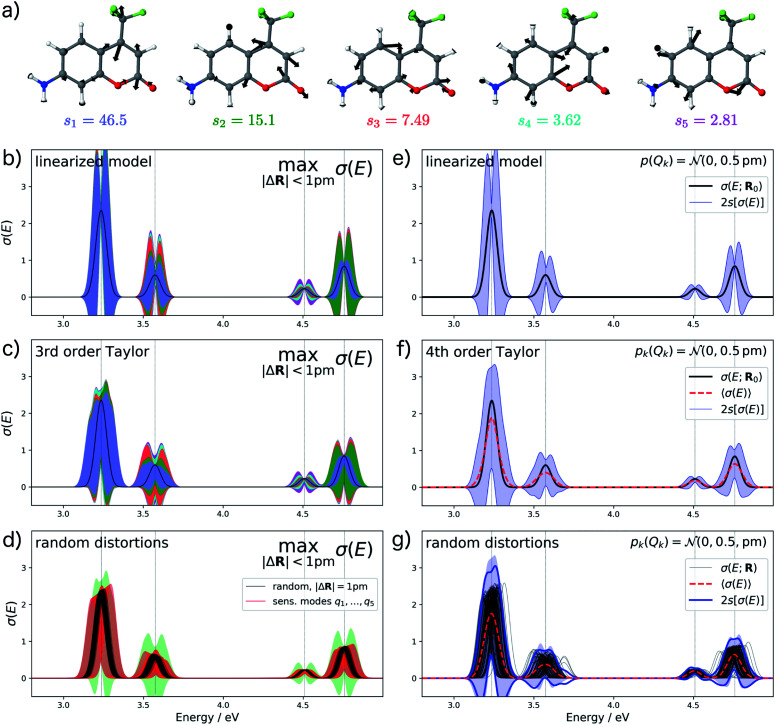
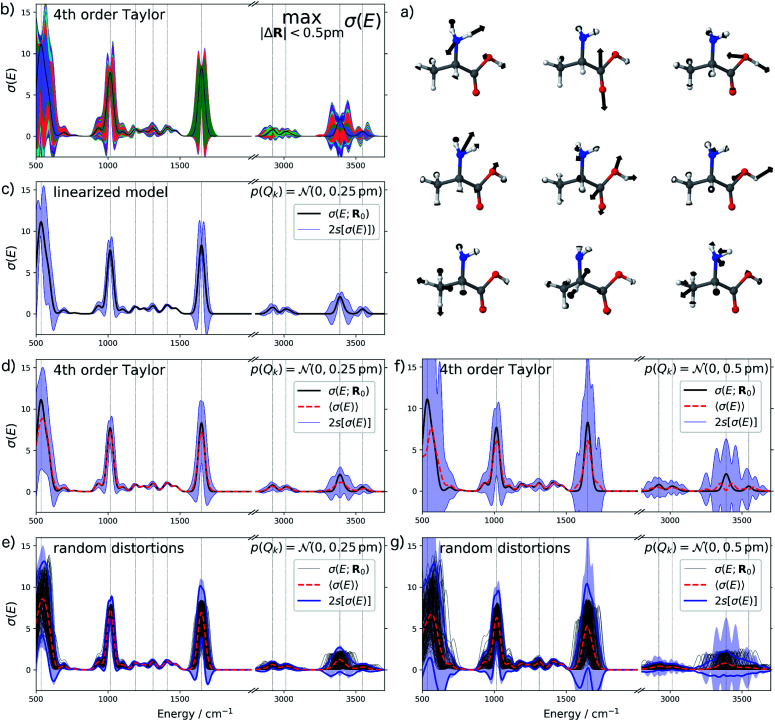
Molecular spectra calculated with quantum-chemical methods are subject to a number of uncertainties (e.g., errors introduced by the computational methodology) that hamper the direct comparison of experiment and computation. Judging these uncertainties is crucial for drawing reliable conclusions from the interplay of experimental and theoretical spectroscopy, but largely relies on subjective judgment. Here, we explore the application of methods from uncertainty quantification to theoretical spectroscopy, with the ultimate goal of providing systematic error bars for calculated spectra. As a first target, we consider distortions of the underlying molecular structure as one important source of uncertainty. We show that by performing a principal component analysis, the most influential collective distortions can be identified, which allows for the construction of surrogate models that are amenable to a statistical analysis of the propagation of uncertainties in the molecular structure to uncertainties in the calculated spectrum. This is applied to the calculation of X-ray emission spectra of iron carbonyl complexes, of the electronic excitation spectrum of a coumarin dye, and of the infrared spectrum of alanine. We show that with our approach it becomes possible to obtain error bars for calculated spectra that account for uncertainties in the molecular structure. This is an important first step towards systematically quantifying other relevant sources of uncertainty in theoretical spectroscopy.


Conflict of interest statement

There are no conflicts to declare.

Figures

Fig. 1
Fig. 1. Principal component analysis of the linearized structural sensitivity of the calculated XES spectrum of Fe(CO)5. (a) Singular values sk (red) and sum of the singular values (blue) in descending order. (b) Visualization of the sensitivity modes qk corresponding to the four largest singular values. (c) Calculated XES spectrum (upper panel) and principal component structural sensitivities δσPCk (lower panel). The color-coded shaded areas indicate the linearized change in the calculated spectrum for distortions of Qk = ±4 pm.
Fig. 2
Fig. 2. Analysis of the accuracy of different approximations of the one-mode and two-mode contributions to the structural sensitivity of the calculated XES spectrum of Fe(CO)5. (a and b) One-mode contributions obtained from calculations for displaced structures with Q1 = ±4 pm (solid red line) compared to a linearized approximation (solid blue line) and a 3rd order Taylor expansion (dashed green line). The top panels show the corresponding spectra while the lower panels show the change in the calculated spectra. (c and d) Two-mode contributions obtained from calculations for displaced structures with (i.e., |Δq| = 4 pm).
Fig. 3
Fig. 3. Calculated XES spectrum of Fe(CO)5 (black line) including error bars (shaded area) giving upper and lower bounds for distortions of the minimum energy reference structure with |ΔR| ≤ 4 pm. The different colors of the shaded area indicate the contributions of the four most influential sensitivity modes (q1 blue; q2 green, q3 red, q4 cyan). (a) Error bars calculated for the linearized surrogate model and (b) for the non-linear surrogate model based on a 3rd-order Taylor expansion for the one-mode contributions and neglecting two-mode and higher-order contributions. (c) Spectra calculated for 100 random distortions with |ΔR| = 4 pm (black lines) as well as 20 evenly spaced distortions between Qi = ±4 pm along each of the four most influential sensitivity modes (red lines). The total error bars from (b) are included as green shaded area for comparison.
Fig. 4
Fig. 4. Calculated XES spectrum of Fe(CO)5 (black line) including error bars (blue shaded area) corresponding to two standard deviations when assuming a normal distribution with standard deviation sQ for the distortions of the underlying molecular structure. If different from the spectrum calculated for the reference structure, the mean of the calculated spectrum is included as dashed red line. (a) Error bars calculated for sQ = 2 pm with the linearized surrogate model; (b and c) error bars calculated for (b) sQ = 2 pm and (c) sQ = 4 pm with the non-linear surrogate model based on a 3rd order Taylor expansion for the one-mode contributions and neglecting two-mode and higher-order contributions. (d and e) Spectra calculated for 100 random distortions sampled from independent normal distributions with (d) sQ = 2 pm and (e) sQ = 4 pm (black lines) as well as the error bars corresponding to two standard deviations (blue lines). For comparison, the error bars from (b) and (c), respectively, are included as blue shaded area.
Fig. 5
Fig. 5. Analysis of the structural sensitivity of the calculated XES spectrum of Fe(CO)3(cod). (a) Visualization of the six most influential sensitivity modes. (b) Calculated spectrum including error bars giving upper and lower bounds for distortions with |ΔR| ≤ 4 pm. The colors of the shaded area indicate the contributions of the different sensitivity modes. (c and d) Calculated spectrum including error bars corresponding to two standard deviations when assuming a normal distribution with standard deviation (c) sQ = 2 pm and (d) sQ = 4 pm for the distortions of the molecular structure. All error bars are obtained using the non-linear surrogate model based on a 3rd order Taylor expansion for the one-mode contributions and neglecting two-mode and higher-order contributions.
Fig. 6
Fig. 6. Analysis of the structural sensitivity of the calculated UV/Vis spectrum of aminocoumarin C151. (a) Visualization of the five most influential sensitivity modes. (b and c) Calculated spectrum including error bars giving upper and lower bounds for distortions with |ΔR| ≤ 1 pm obtained within (b) the linearized model and (c) the non-linear surrogate model based on a 4th order Taylor expansion for the one-mode contributions and neglecting two-mode and higher-order contributions. (d) Spectra calculated for 100 random distortions with |ΔR| = 1 pm (black lines) as well as 20 evenly spaced distortions between Qi = ±1 pm along each of the four most influential sensitivity modes (red lines). The total error bars from (c) are included as green shaded area for comparison. (e and f) Calculated spectrum including error bars corresponding to two standard deviations when assuming a normal distribution with standard deviation sQ = 0.5 pm for the distortions of the molecular structure obtain within (e) the linearized model and (f) the non-linear surrogate model. (g) Spectra calculated for 100 random distortions sampled from independent normal distributions with sQ = 0.5 pm as well as the error bars corresponding to two standard deviations (blue lines). For comparison, the error bars from (f) are included as blue shaded area.
Fig. 7
Fig. 7. Analysis of the structural sensitivity of the calculated IR spectrum of alanine. (a) Visualization of the nine most influential sensitivity modes; (b) calculated spectrum including error bars giving upper and lower bounds for distortions with |ΔR| ≤ 0.5 pm. (c, d and f) Calculated spectrum including error bars corresponding to two standard deviations when assuming a normal distribution with standard deviation (c and d) sQ = 0.25 pm and (f) sQ = 0.5 pm for the distortions of the molecular structure. In (c) the error bars are obtained using the linearized model, while in (b), (d) and (f) a non-linear surrogate model is used that is based on a 4th order Taylor expansion for the one-mode contributions and neglecting two-mode and higher-order contributions. (e and g) Spectra calculated for 100 random distortions sampled from independent normal distributions with (e) sQ = 0.25 pm and (g) sQ = 0.5 pm as well as the error bars corresponding to two standard deviations (blue lines). For comparison, the error bars from (d) and (f), respectively, are included as blue shaded area.

References

    1. Grunenberg J., Computational spectroscopy: methods, experiments and applications, Wiley-VCH, Weinheim, 2010
    1. Neese F. Angew. Chem., Int. Ed. 2017;56:11003–11010. doi: 10.1002/anie.201701163. - DOI - PubMed
    1. Polfer N. C. Oomens J. Suhai S. Paizs B. J. Am. Chem. Soc. 2007;129:5887–5897. doi: 10.1021/ja068014d. - DOI - PubMed
    1. Rizzo T. R. Stearns J. A. Boyarkin O. V. Int. Rev. Phys. Chem. 2009;28:481–515.
    1. Schinle F. Jacob C. R. Wolk A. B. Greisch J.-F. Vonderach M. Weis P. Hampe O. Johnson M. A. Kappes M. M. J. Phys. Chem. A. 2014;118:8453–8463. doi: 10.1021/jp501772d. - DOI - PubMed