. 2021 Apr 13;12(20):6929-6948.
doi: 10.1039/d1sc01203g.

Prediction and mitigation of mutation threats to COVID-19 vaccines and antibody therapies

Affiliations

Prediction and mitigation of mutation threats to COVID-19 vaccines and antibody therapies

Jiahui Chen et al. Chem Sci. .

Abstract

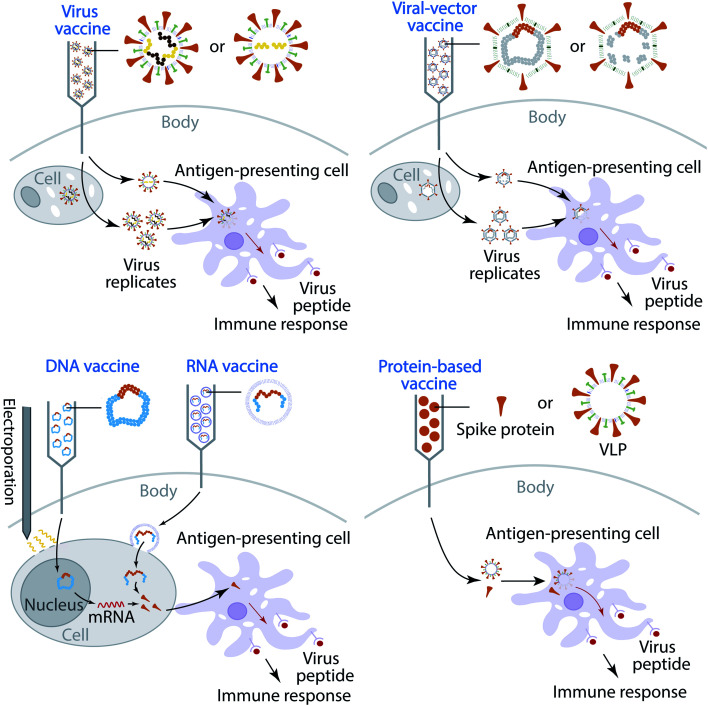
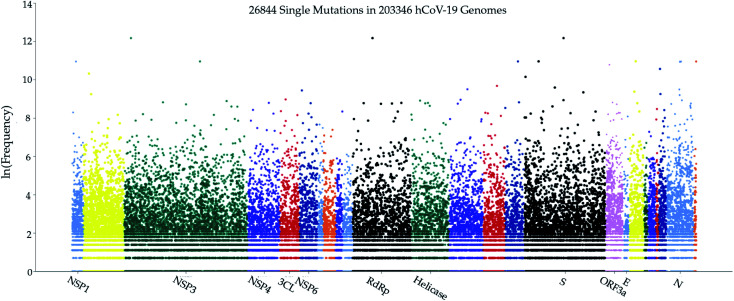
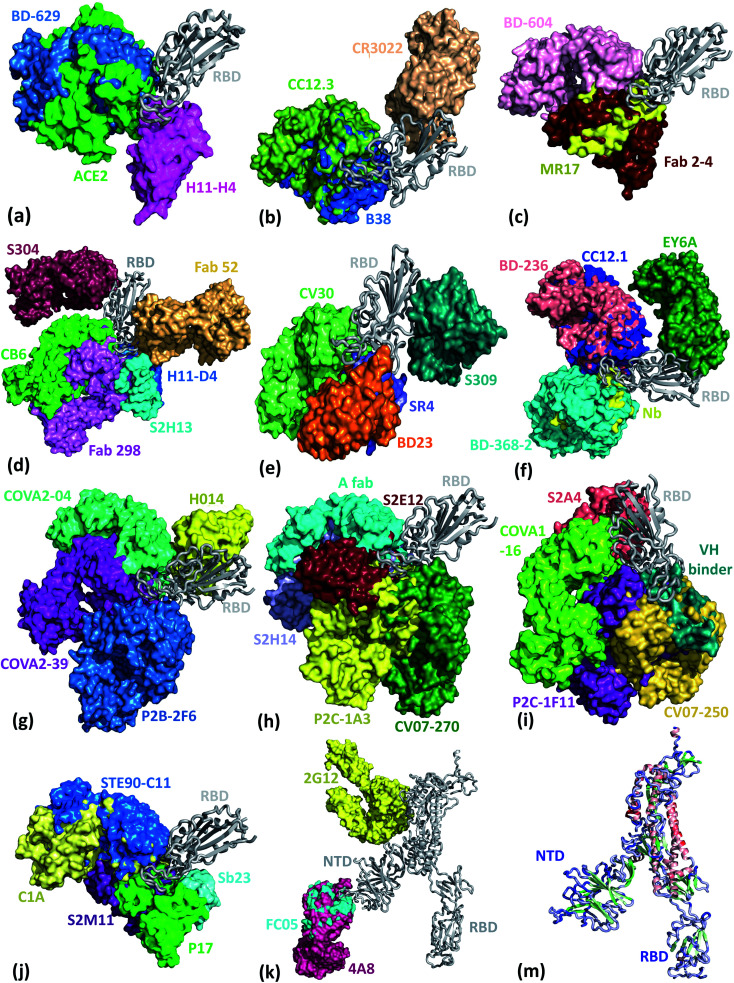
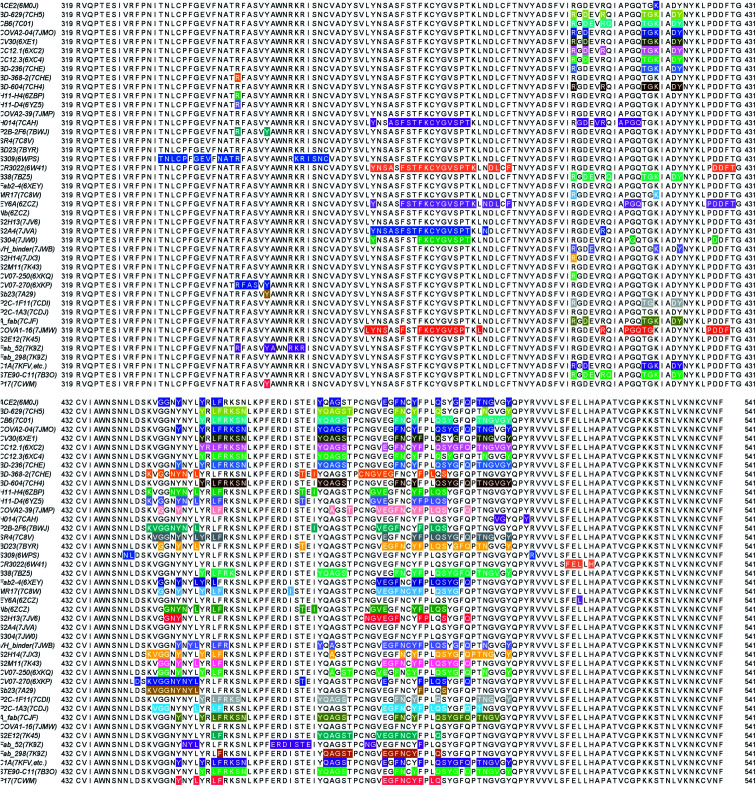
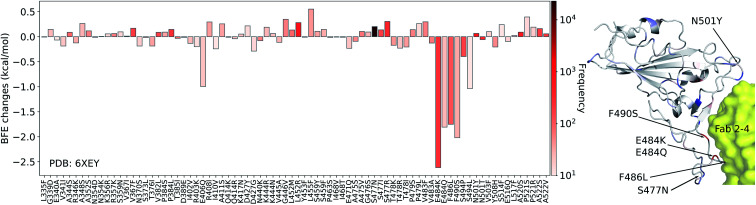
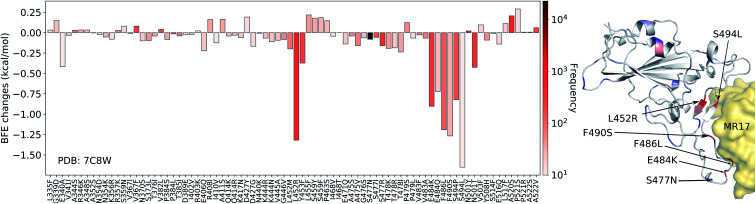
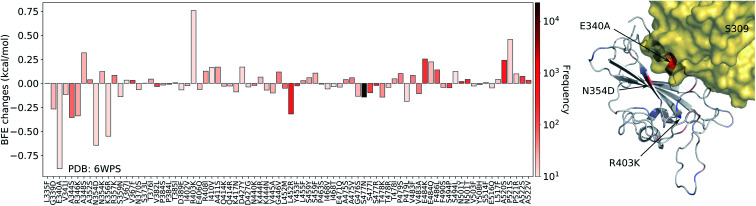
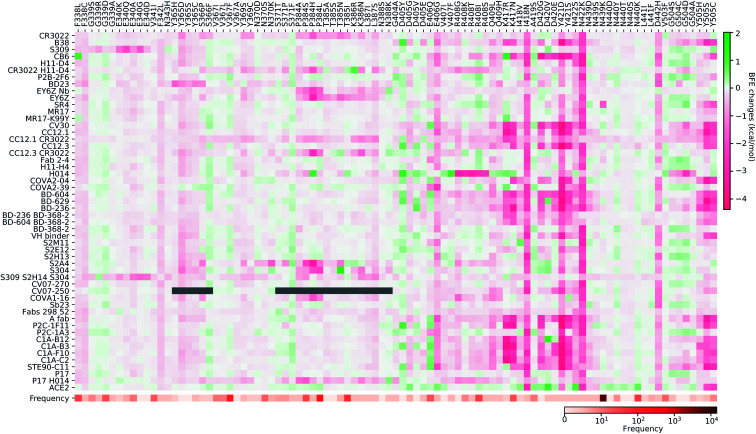
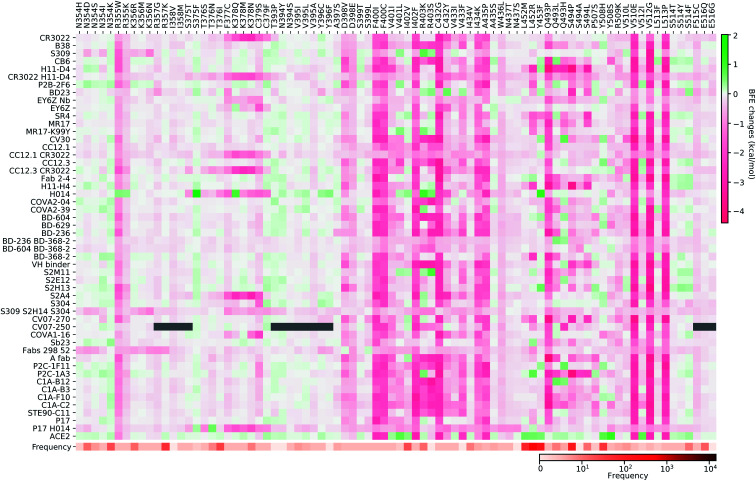
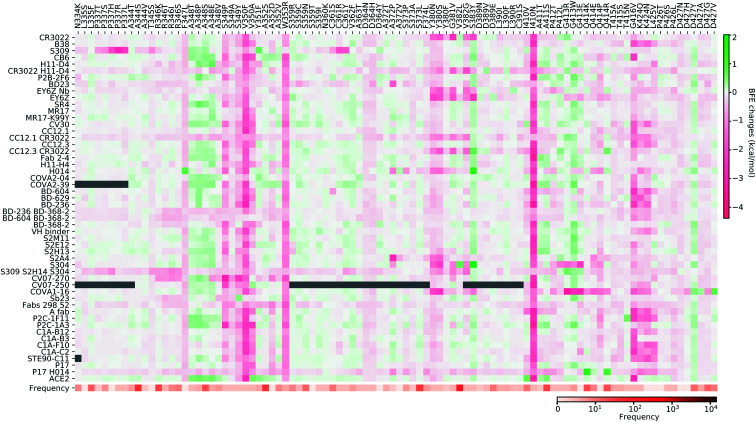
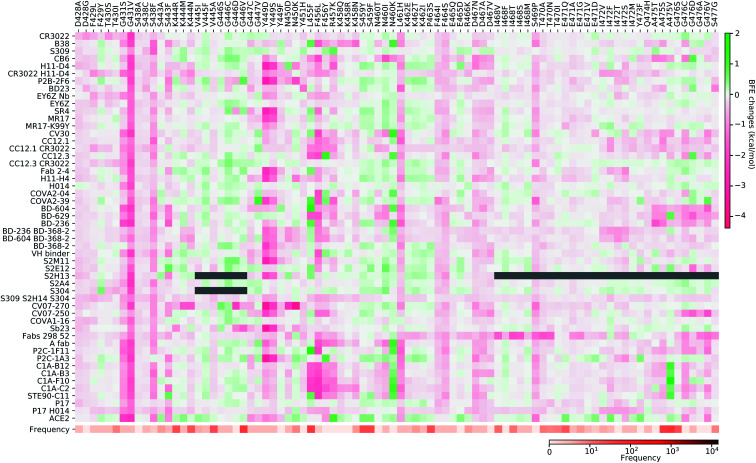
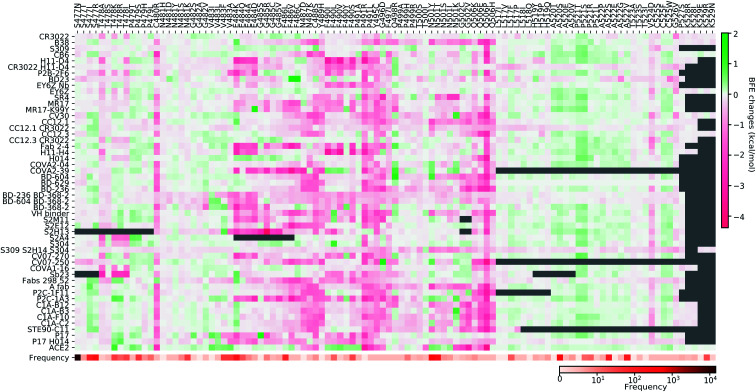
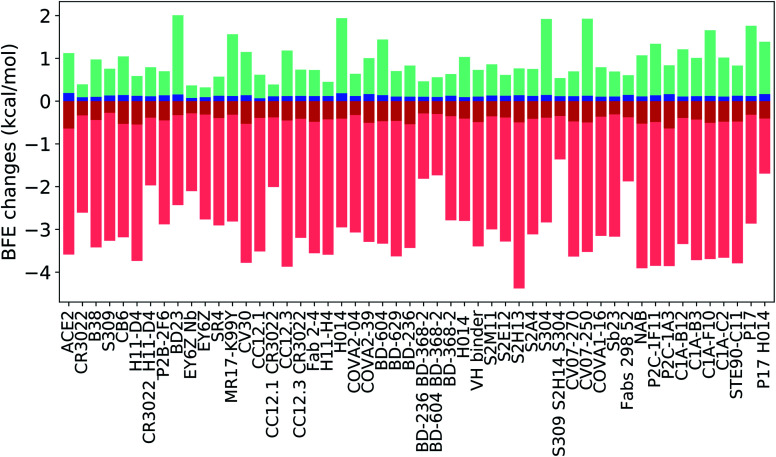
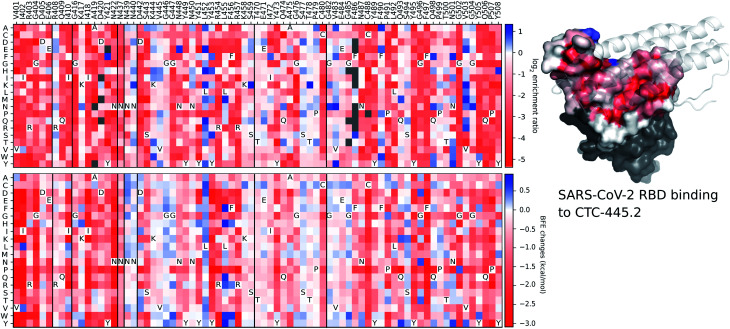
Antibody therapeutics and vaccines are among our last resort to end the raging COVID-19 pandemic. They, however, are prone to over 5000 mutations on the spike (S) protein uncovered by a Mutation Tracker based on over 200 000 genome isolates. It is imperative to understand how mutations will impact vaccines and antibodies in development. In this work, we first study the mechanism, frequency, and ratio of mutations on the S protein which is the common target of most COVID-19 vaccines and antibody therapies. Additionally, we build a library of 56 antibody structures and analyze their 2D and 3D characteristics. Moreover, we predict the mutation-induced binding free energy (BFE) changes for the complexes of S protein and antibodies or ACE2. By integrating genetics, biophysics, deep learning, and algebraic topology, we reveal that most of the 462 mutations on the receptor-binding domain (RBD) will weaken the binding of S protein and antibodies and disrupt the efficacy and reliability of antibody therapies and vaccines. A list of 31 antibody disrupting mutants is identified, while many other disruptive mutations are detailed as well. We also unveil that about 65% of the existing RBD mutations, including those variants recently found in the United Kingdom (UK) and South Africa, will strengthen the binding between the S protein and human angiotensin-converting enzyme 2 (ACE2), resulting in more infectious COVID-19 variants. We discover the disparity between the extreme values of RBD mutation-induced BFE strengthening and weakening of the bindings with antibodies and angiotensin-converting enzyme 2 (ACE2), suggesting that SARS-CoV-2 is at an advanced stage of evolution for human infection, while the human immune system is able to produce optimized antibodies. This discovery, unfortunately, implies the vulnerability of current vaccines and antibody drugs to new mutations. Our predictions were validated by comparison with more than 1400 deep mutations on the S protein RBD. Our results show the urgent need to develop new mutation-resistant vaccines and antibodies and to prepare for seasonal vaccinations.


Conflict of interest statement

There are no conflicts to declare.

Figures

Fig. 1
Fig. 1. Illustration of four types of COVID-19 vaccine that are currently in development.
Fig. 2
Fig. 2. The distribution of genome-wide SARS-CoV-2 mutations on 26 proteins. The y-axis represents the natural log frequency for each mutation on a specific position of the complete SARS-CoV-2 genome. While only a few landmark positions are labeled with gene (protein) names, the relative positions of other genes (proteins) can be found in our Mutation Tracker (https://users.math.msu.edu/users/weig/SARS-CoV-2_Mutation_Tracker.html).
Fig. 3
Fig. 3. Aligned structures of 46 complexes of the S protein and ACE2 and single antibodies. (a)–(j) The 3D alignment of the available unique 3D structures of SARS-CoV-2 S protein RBD in binding complexes with 42 antibodies (MR17-K99Y is excluded because its binding mode is the same as that of MR17). (k) The 3D alignment of the three antibodies binding outside RBD. (m) The 3D structure of S protein RBD. The red, green, and blue colors represent helix, sheet, and random coils of RBD, respectively. The darker color represents the higher mutation frequency on a specific residue. The structures are (a) ACE2 (6M0J), BD-629 (7CH5), H11-H4 (6ZBP); (b) CC12.3 (6XC4), B38 (7BZ5), CR3022 (6XC3); (c) BD-604 (7CH4), MR17 (7C8W), Fab 2-4 (6XEY); (d) S304 (7JW0), CB6 (7C01), Fab 52 (7K9Z), S2H13 (7JV6), H11-D4 (6YZ5), Fab 298 (7K9Z); (e) CV30 (6XE1), BD23 (7BYR), SR4 (7C8V), S309 (6WPS); (f) CC12.1 (6XC2), EY6A (6ZCZ), BD-236 and nanobody (Nb) (7CHE), BD-368-2 (7CHH); (g) H014 (7CAH), COVA2-04 (7JMO), COVA2-39 (7JMP), P2B–2F6 (7BWJ); (h) P2C-1A3 (7CDJ), CV07-270 (6XKP), S2H14 (7JX3), A fab (7CJF), S2E12 (7K45); (i) CV07-250 (6XKQ), P2C–1F11 (7CDI), VH binder (7JWB), S2A4 (7JVA), COVA1-16 (7JMW);, (j) C1A (7KFV), STE90-C11 (7B3O), Sb23 (7A29), S2M11 (7K43), P17 (7CWM);; and (k) 4A8 (7C2L), FC05 (7CWU), and 2G12 (7L06).
Fig. 4
Fig. 4. Illustration of the contact positions of the antibody and ACE2 paratope with SARS-CoV-2 S protein RBDs on RBD 2D sequences. The corresponding PDB IDs are given in parentheses.
Fig. 5
Fig. 5. Illustration of SARS-CoV-2 mutation-induced binding free energy changes for the complexes of S protein and 4A8 (PDB: 7C2L). The blue color in the structure plot indicates a positive BFE change while the red color indicates a negative BFE change, and toning indicates the strength. Here, mutations R102I, W152C, W152L, S247N, and Y248H could potentially disrupt the binding of antibody 4A8 and S protein.
Fig. 6
Fig. 6. Illustration of SARS-CoV-2 mutation-induced binding free energy changes for the complexes of S protein and Fab 2-4 (PDB: 6XEY). The blue color in the structure plot indicates a positive BFE change while the red color indicates a negative BFE change, and toning indicates the strength. Here, mutations E484K, E484Q, F486L, and F490S could potentially disrupt the binding of antibody Fab 2-4 and the S protein.
Fig. 7
Fig. 7. Illustration of SARS-CoV-2 mutation-induced binding free energy changes for the complexes of S protein and MR17 (PDB: 7C8W). Blue in the structure plot indicates a positive BFE change while red indicates a negative BFE change, and toning indicates the strength. Here, mutations L452R, E484K, F486L, F490S, and S494L could potentially disrupt the binding of antibody MR17 and the S protein.
Fig. 8
Fig. 8. Illustration of SARS-CoV-2 mutation-induced binding free energy changes for the complexes of S protein and S309 (PDB: 6WPS). The blue color in the structure plot indicates a positive BFE change while the red color indicates a negative BFE change, and toning indicates the strength. Here, mutations E340A, N354D, and K356R could potentially weaken the binding of antibody S309 and the S protein.
Fig. 9
Fig. 9. Illustration of the SARS-CoV-2 helix-residue mutation induced BFE changes for the complexes of S protein and 51 antibodies or ACE2. Positive changes strengthen the binding while negative changes weaken the binding. Mutation frequency is given for each mutation. Grey color indicates that PDB structures do not include residues induced by those mutations.
Fig. 10
Fig. 10. Illustration of SARS-CoV-2 sheet-residue mutation induced BFE changes for the complexes of S protein and 51 antibodies or ACE2. Positive changes strengthen the binding while negative changes weaken the binding. Mutation frequency is presented for each mutation. Grey color indicates that PDB structures does not include residues induced by those mutations.
Fig. 11
Fig. 11. Illustration of SARS-CoV-2 coil-residue mutation induced BFE changes for the complexes of S protein and 51 antibodies or ACE2. Positive changes strengthen the binding while negative changes weaken the binding. Mutation frequency is presented for each mutation. Grey color indicates that PDB structures do not include residues induced by those mutations.
Fig. 12
Fig. 12. Illustration of SARS-CoV-2 coil-residue mutation induced BFE changes for the complexes of S protein and 51 antibodies or ACE2 (continued from Fig. 11). Positive changes strengthen the binding while negative changes weaken the binding. Mutation frequency is presented for each mutation. Grey color indicates that PDB structures do not include residues induced by those mutations.
Fig. 13
Fig. 13. Illustration of SARS-CoV-2 coil-residue mutation induced BFE changes for the complexes of S protein and 51 antibodies or ACE2 (continued from Fig. 12). Positive changes strengthen the binding while negative changes weaken the binding. Mutation frequency is presented for each mutation. Grey color indicates that PDB structures do not include residues induced by those mutations.
Fig. 14
Fig. 14. Illustration of SARS-CoV-2 mutation-induced maximal and minimal BFE changes in cyan and pink for the complexes of S protein and 51 antibodies or ACE2, and average of positive and negative BFE changes in blue and red. Here, the maximal change strengthens the binding while the minimal change weakens the binding for each complex.
Fig. 15
Fig. 15. The 3D rotational structure of SARS-CoV-2 S protein. The random coils of S protein are drawn with green strings and the other secondary structure is described with a purple surface. (a) 3D structure of S protein. (b) 3D structure of S protein that is rotated 90° based on (a). (c) 3D structure of S protein that is rotated 180° based on (a). (d) 3D structure of S protein that is rotated 270° based on (a).
Fig. 16
Fig. 16. The secondary structure of S protein. The red, green, and blue colors represent helix, sheet, and random coils of S protein.
Fig. 17
Fig. 17. A comparison between experimental deep mutation enrichment data and TopNetTree predictions for the SARS-CoV-2 S protein RBD and CTC-445.2 complex (7KL9 (ref. 89)). Top left: deep mutational scanning heatmap showing the average effect on the enrichment for single site mutants of the RBD when assayed by yeast display for binding to CTC-445.2. Top right: the RBD colored by average enrichment at each residue position bound to CTC-445.2. Bottom: machine learning predicted BFE changes for the CTC-445.2 and S protein complex induced by single site mutations on the RBD.

Update of

References

    1. Lu R. Zhao X. Li J. Niu P. Yang B. Wu H. Wang W. Song H. Huang B. Zhu N. et al., Genomic characterisation and epidemiology of 2019 novel coronavirus: implications for virus origins and receptor binding. Lancet. 2020;395(10224):565–574. - PMC - PubMed
    1. Shin M. D. Shukla S. Chung Y. H. Beiss V. Chan S. K. Ortega-Rivera O. A. Wirth D. M. Chen A. Sack M. Pokorski J. K. et al., COVID-19 vaccine development and a potential nanomaterial path forward. Nat. Nanotechnol. 2020:1–10. - PubMed
    1. Day M., Covid-19: four fifths of cases are asymptomatic, China figures indicate, 2020 - PubMed
    1. Long Q.-X. Tang X.-J. Shi Q.-L. Li Q. Deng H.-J. Yuan J. Hu J.-L. Xu W. Zhang Y. Lv F.-J. et al., Clinical and immunological assessment of asymptomatic SARS-CoV-2 infections. Nat. Med. 2020;26(8):1200–1204. - PubMed
    1. Kissler S. M. Tedijanto C. Goldstein E. Grad Y. H. Lipsitch M. Projecting the transmission dynamics of SARS-CoV-2 through the postpandemic period. Science. 2020;368(6493):860–868. - PMC - PubMed