. 2021 May 28:8:673044.
doi: 10.3389/fmolb.2021.673044. eCollection 2021.

Altered Glycosylation in the Aging Heart

Affiliations

Altered Glycosylation in the Aging Heart

Patricia Franzka et al. Front Mol Biosci. .

Abstract

Cardiovascular disease is one of the leading causes of death in developed countries. Because the incidence increases exponentially in the aging population, aging is a major risk factor for cardiovascular disease. Cardiac hypertrophy, fibrosis and inflammation are typical hallmarks of the aged heart. The molecular mechanisms, however, are poorly understood. Because glycosylation is one of the most common post-translational protein modifications and can affect biological properties and functions of proteins, we here provide the first analysis of the cardiac glycoproteome of mice at different ages. Western blot as well as MALDI-TOF based glycome analysis suggest that high-mannose N-glycans increase with age. In agreement, we found an age-related regulation of GMPPB, the enzyme, which facilitates the supply of the sugar-donor GDP-mannose. Glycoprotein pull-downs from heart lysates of young, middle-aged and old mice in combination with quantitative mass spectrometry bolster widespread alterations of the cardiac glycoproteome. Major hits are glycoproteins related to the extracellular matrix and Ca2+-binding proteins of the endoplasmic reticulum. We propose that changes in the heart glycoproteome likely contribute to the age-related functional decline of the cardiovascular system.

Keywords: cardiac aging; cardiac glycoproteome; glycosylation; mannosylation; post-translational modifications.


Conflict of interest statement

The authors declare that the research was conducted in the absence of any commercial or financial relationships that could be construed as a potential conflict of interest.

Figures
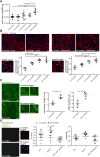
FIGURE 1
FIGURE 1
Cardiac aging in male C57BL/6J mice. (A) The heart/body weight ratio increases during aging (n = 5–9 mice per age; 1-way ANOVA with Bonferroni posthoc test). (B) Representative images of either cross (left) or longitudinal (right) heart sections of a 3 and 24-month-old mouse are shown (scale bar: 20 µm). Left panel: Higher magnification of cross-sectioned cardiomyocytes. An exemplary cardiomyocyte diameter is indicated (yellow line). The mean cell diameter of cross-sectioned cardiomyocytes increases with age (n = 3-5 mice per age, N = 300 cells per mouse, 1-way ANOVA with Bonferroni posthoc test). Right panel: Higher magnification of longitudinally sectioned cardiomyocytes. An exemplary cardiomyocyte diameter is indicated (yellow line). The mean cell diameter of longitudinal-sectioned cardiomyocytes increases with age (n = 3–5 mice per age, N = 200 cells per mouse, 1-way ANOVA with Bonferroni posthoc test). (C) Representative images of heart sections of 3 and 24-month-old mice stained for α-actinin (scale bar: 10 µm). Sarcomere length and Z-disc height are shown in higher magnification images. Sarcomere length as well as α-actinin height increase with aging (n = 3 mice per age, N = 9–11 pictures per mouse with at least 60 measurements, Student’s t-test). (D) Representative images of Picro sirius red stained heart sections of 3 and 24-month-old mouse are shown (scale bar: 25 µm). Cardiac collagen deposits increase during aging (n = 3 mice per age, N = 15 fields per mouse, 1-way ANOVA with Bonferroni posthoc test). Data are presented as individual data points with SEM.
FIGURE 2
FIGURE 2
Age dependent changes of high mannose N-glycans in the heart. (A) Representative MALDI-TOF spectra of permethylated N-glycans measured in the positive ionization mode. All molecular ions are present in sodiated form [M + Na]+. Green circle: Man, yellow circle: Gal; blue square: GlcNAc, white diamond: NeuGc, violet diamond: NeuAc, red triangle: Fuc, black asterisk: non-carbohydrate contamination. (B) Relative intensities of the MALDI-TOF spectra from permethylated N-glycans released from mouse heart tissues (n = 6 mice per age; 1-way ANOVA with Bonferroni posthoc test). Relative intensities of individual spectra are presented in Supplementary Table S1. (C) Western Blots probed with lectins recognizing neuraminic acid. For quantification GAPDH served as loading control (n = 6 mice per age; 2-way ANOVA with Bonferroni posthoc test). MAL: Neu5(Ac/Gc)-α(2,3)-Gal-β(1,4)-GlcNAc-R, SNA: Neu5(Ac/Gc)-α(2,6)-Gal-β(1,4)-GlcNAc-R. (D) Western Blots incubated with antibodies recognizing mannose. For quantification GAPDH served as loading control (n = 6 mice per age; 2-way ANOVA with Bonferroni posthoc test). Oligomannose: 6–9 terminal mannose residues. Paucimannose: 3 terminal mannose residues. Black brackets indicate measured bands at indicated molecular weights. Quantitative data are presented as mean ± SEM. Individual data points are shown in Supplementary Figure S1.
FIGURE 3
FIGURE 3
Age-dependent changes in cardiac GMPPB abundance and serum mannose concentrations. (A) GMPPB abundance increases between 3 and 12 months of age, while GMPPA abundance does not change. GAPDH served as loading control (n = 6 mice per age; 2-way ANOVA with Bonferroni posthoc test). (B) Sugar concentrations in serum of non-fasted mice. Glucose and mannose concentration increase between 3 and 12 months of age, while fructose concentration does not change (n = 7–12 mice per age; 1-way ANOVA with Bonferroni posthoc test). Data are presented as individual data points with SEM or as mean ± SEM. Individual data points are shown in Supplementary Figure S2.
FIGURE 4
FIGURE 4
Quantitative changes in the cardiac glycoproteome during aging upon Con A pull-down. (A) Mass spectrometry analysis of top 30 cardiac muscle proteins of aging male mice after Con A pull-down. Proteins significantly up-regulated/or hyperglycosylated between two different ages are shown in red and those down-regulated/or hypoglycosylated in blue (n = 3 mice per age). (B) Volcano plots for all identified proteins after Con A enrichment with a q-value below 0.05. Proteins significantly up-regulated/or hyperglycosylated between two different ages are shown in red and those down-regulated/or hypoglycosylated in blue, while unchanged proteins are shown in black (n = 3 mice per age). (C) Affected pathways are shown for Con A (glycans carrying mannose) enriched proteins. Gene set expression analysis (GSEA) showing reactome with a false-discovery rate (FDR) of <0.05. Up-regulated/or glycosylated GSEA reactome pathways are shown in blue, down-regulated/or -glycosylated GSEA reactome pathways are indicated in orange. Most affected pathways identified by ingenuity pathway analysis (IPA) (FDR <0.1).
FIGURE 5
FIGURE 5
Quantitative changes in the cardiac glycoproteome during aging upon PNA pull-down. (A) Mass spectrometry analysis of top 30 cardiac muscle proteins of aging male mice after PNA pull-down. Proteins significantly up-regulated/or hyperglycosylated between two different ages are shown in red and those down-regulated/or hypoglycosylated in blue (n = 3 mice per age). (B) Volcano plots for all identified proteins after PNA enrichment with a q-value below 0.05. Proteins significantly up-regulated/or hyperglycosylated between two different ages are shown in red and those down-regulated/or hypoglycosylated in blue, while unchanged proteins are shown in black (n = 3 mice per age). (C) Affected pathways are shown for PNA (glycans carrying terminal galactose) enriched proteins. Gene set expression analysis (GSEA) showing reactome with a false-discovery rate (FDR) of <0.05. Up-regulated/or glycosylated GSEA reactome pathways are shown in blue, down-regulated/or -glycosylated GSEA reactome pathways are indicated in orange. Most affected pathways identified by ingenuity pathway analysis (IPA) (FDR <0.1).
FIGURE 6
FIGURE 6
Expression of candidate proteins involved in stabilization, organization, signaling and stress responses identified in aging C57BL/6J male hearts. (A) Western Blot analysis of candidate glycoproteins identified by mass spectrometry after Con A pull-down. GAPDH and vinculin served as loading control (n = 6 mice per age; 2-way ANOVA with Bonferroni posthoc test). (B) Western blot analysis of the candidate protein alpha-actinin and the talin-interacting protein beta-integrin 1. GAPDH and vinculin served as loading control (n = 6 mice per age; 2-way ANOVA with Bonferroni posthoc test). (C) Western Blot analysis of calcium-binding ER proteins selected after mass spectrometry of lectin pull-down. GAPDH served as loading control (n = 6 mice per age; 2-way ANOVA with Bonferroni posthoc test). Quantitative data are presented as mean ± SEM. Individual data points are shown in Supplementary Figure S2.

References

    1. Allalouf D., Komlos L., Notmann J., Halbrecht I., Levinsky H. (1988). Sialic Acid Content and Sialyltransferase Activity in Human Lymphocytes with Advancing Age. Mech. Ageing Development 44, 45–50. 10.1016/0047-6374(88)90078-4 - DOI - PubMed
    1. Amberg D., Leadsham J. E., Kotiadis V., Gourlay C. W. (2012). Cellular Ageing and the Actin Cytoskeleton. Subcell Biochem. 57, 331–352. 10.1007/978-94-007-2561-4_15 - DOI - PubMed
    1. Banerjee D. K., Zhang Z., Baksi K., Serrano-Negrón J. E. (2017). Dolichol Phosphate Mannose Synthase: a Glycosyltransferase with Unity in Molecular Diversities. Glycoconj J. 34, 467–479. 10.1007/s10719-017-9777-4 - DOI - PMC - PubMed
    1. Beard N. A., Casarotto M. G., Wei L., Varsányi M., Laver D. R., Dulhunty A. F. (2005). Regulation of Ryanodine Receptors by Calsequestrin: Effect of High Luminal Ca2+ and Phosphorylation. Biophysical J. 88, 3444–3454. 10.1529/biophysj.104.051441 - DOI - PMC - PubMed
    1. Biskup K., Braicu E. I., Sehouli J., Fotopoulou C., Tauber R., Berger M., et al. (2013). Serum Glycome Profiling: a Biomarker for Diagnosis of Ovarian Cancer. J. Proteome Res. 12, 4056–4063. 10.1021/pr400405x - DOI - PubMed