Review
. 2021 May 28:8:630643.
doi: 10.3389/fvets.2021.630643. eCollection 2021.

Assessment of Volume Status and Fluid Responsiveness in Small Animals

Affiliations
Review

Assessment of Volume Status and Fluid Responsiveness in Small Animals

Søren R Boysen et al. Front Vet Sci. .

Abstract

Intravenous fluids are an essential component of shock management in human and veterinary emergency and critical care to increase cardiac output and improve tissue perfusion. Unfortunately, there are very few evidence-based guidelines to help direct fluid therapy in the clinical setting. Giving insufficient fluids and/or administering fluids too slowly to hypotensive patients with hypovolemia can contribute to continued hypoperfusion and increased morbidity and mortality. Similarly, giving excessive fluids to a volume unresponsive patient can contribute to volume overload and can equally increase morbidity and mortality. Therefore, assessing a patient's volume status and fluid responsiveness, and monitoring patient's response to fluid administration is critical in maintaining the balance between meeting a patient's fluid needs vs. contributing to complications of volume overload. This article will focus on the physiology behind fluid responsiveness and the methodologies used to estimate volume status and fluid responsiveness in the clinical setting.

Keywords: POCUS; cats; dogs; dynamic; fluid responsiveness; static; volume status; wet lung.


Conflict of interest statement

The authors declare that the research was conducted in the absence of any commercial or financial relationships that could be construed as a potential conflict of interest.

Figures

Figure 1
Figure 1
(A) Baseline. The pressure gradient between the right atrium (RA) and mean circulatory filling pressure (MCFP) determines venous return (VR) or preload. The veins are capacitance vessels. The blood volume contained within the venous system that does not contribute to pressure or stress being applied to the vessel wall is referred to as the unstressed volume. This unstressed blood volume depends on vessel size (and thus venoconstriction or -dilation). Any additional blood volume added to the venous system beyond the unstressed volume will exercise a force on the wall of the vein, distending it, thus generating a transmural pressure above zero. This additional blood volume is referred to as the stressed volume and is the main contributor to MCFP. Also depicted is the negative pleural pressure which changes during the respiratory cycle and influences the heart and VR, referred to as heart-lung interactions. RAP, right atrial pressure; LV, left ventricle. (B) Spontaneous inspiration. In the spontaneously breathing patient negative pleural pressure increases during inspiration, decreasing the resistance to venous return (VR) and the right atrial pressure (RAP). This results in a greater difference between the mean circulatory filling pressure (MCFP) and RAP, subsequently increasing VR or preload. The opposite effect occurs during expiration. All other factors held constant, the magnitude of the effect and impact on VR will vary depending on the volume status of the patient: The more hypovolemic the patient is, the greater the result of heart-lung interactions on VR. RA, right atrium; LV, left ventricle. (C) Mechanical inspiration. During the inspiratory phase of positive pressure ventilation the pleural pressure rises (becomes less negative) which increases the resistance to venous return and directly compresses the right atrium, increasing the right atrial pressure (RAP). This results in a decrease in the difference between the mean circulatory filling pressure (MCFP) and RAP, subsequently decreasing venous return (VR) or preload. The opposite effect occurs during expiration. All other factors held constant, the magnitude of the effect and impact on VR will vary depending on the volume status of the patient: The more hypovolemic the patient is the greater the result of heart-lung interactions on VR. RA, right atrium; LV, left ventricle. (D) Vasopressor administration. Administration of a vasopressor causes vasoconstriction which, all other factors held constant, may result in an increase in the stressed blood volume relative to the unstressed blood volume, depending on the type of vasopressor administered (arterial, venous or mixed). The increase in stressed volume will increase the mean circulatory filling pressure (MCFP), increasing venous return (VR). This partly explains the improvement in cardiac output (CO) sometimes seen with vasopressor administration. However, because vasopressors will also increase resistance to venous flow (increase not illustrated in this diagram), vasopressors may only cause a minimal increase in VR. RAP, right atrial pressure; RA, right atrium; LV, left ventricle. (E) Fluid loading, fluid responsive. For fluid loading to be effective it must increase the stressed volume more than it increases right atrial pressure (RAP). In this illustration fluid loading has caused a larger increase in the stressed volume with minimal increase in RAP. Therefore, the mean circulatory filling pressure (MCFP) increases while the RAP is minimally increased, and the result is an increase in venous return (VR). Understanding the Frank Starling curve helps explain if the stressed volume increases more than the unstressed volume or RAP. RAP, right atrial pressure; RA, right atrium; LV, left ventricle. (F) Fluid loading, fluid unresponsive. In this example a fluid bolus is administered which increases the stressed blood volume and mean circulatory filling pressure (MCFP), however, at the same time there is a parallel increase in right atrial pressure (RAP). The net results is a failure of venous return (VR) and subsequently cardiac output (CO) to increase (fluid unresponsive). Given organ blood flow is driven by the difference between MAP and central venous pressure (CVP), and that CVP becomes the major factor determining organ and microcirculatory flow when MAP is within an organ autoregulatory range, an increase in CVP may contribute to organ injury. (G) Fluid loading, fluid unresponsive: In this example, all other factors held constant, vasodilation causes an increase of the unstressed blood volume relative to the stressed volume [(a), light blue], which decreased the mean circulatory filling pressure (MCFP) (red dotted line). All other factors held constant, fluid loading (b) increases the stressed volume and returns the MCFP to baseline (blue dotted line) but has failed to increase cardiac output (CO) because insufficient fluids have been administered to increase MCFP above baseline. With vasodilation the proportion of unstressed volume increases relative to the stressed volume, resulting in a greater volume of fluid needing to be administered before a significant increase in the stressed volume is noted. The right atrial pressure (RAP) will also change with alterations in the stressed blood volume and vasodilation, which has not been illustrated here for simplicity. Changes in vascular tone because of fluid loading are also not shown for simplicity. Understanding the Frank Starling curve helps explain if the stressed volume increases more than the unstressed volume or RAP. RA, right atrium; LV, left ventricle.
Figure 2
Figure 2
(A) The Frank Starling curve is shown in blue for 3 different patients with a similar Frank-Starling curve (blue line), yet located at different points along that curve; The x axis shows an induced increase in preload (e.g., fluid bolus) of the same magnitude for all 3 patients (black arrows). As a result of the shape of the curve the change in cardiac output (CO) depicted on the y-axis (blue double-headed arrows) is very different depending on the point along the curve the patient is located. Patient a-b has a very large increase in CO relative to patient c-d (minimal increase in CO) or patient e-f (negligible change in CO). In patient a-b the increased preload leads to stretching of the myocytes, which subsequently contract more forcefully, leading to an increase in CO. For a patient to be fluid responsive both the right and left ventricles must be functioning on the steep part of the Starling curve. Many critically ill human patients, and most likely a proportion of our companion animals have significant changes in cardiac contractility (e.g., due to acidosis, sepsis, etc.), flattening the curve and shifting it to the right (purple dotted line), placing them on the flat portion of the curve and decreasing the rise in CO for a similar rise in preload. (B) The Marik-Philips curve (orange line) is superimposed on the Frank-Starling curve (blue line) to show the relationship between preload changes, cardiac output (CO) and extravascular lung water (EVLW). A patient located at the left of the curve (patient a-b), is on the steep portion of the Frank-Starling curve, has low preload prior to fluid therapy, and is very likely to be fluid responsive. This implies a fluid bolus would increase preload (black arrow), leading to an increase in CO (blue double-headed arrow). At the same time, according to the Marik-Philips curve, this increase in preload would not be associated with a significant increase in extravascular lung water (EVLW; red double-headed arrow). A patient located on the right side of the curve (patient e-f), has a relatively high preload prior to fluid therapy. Providing an additional fluid bolus to increase preload the same amount as patient a-b will have little to no effect, with no improvement in CO, but a very significant increase in EVLW. Between patient a-b and e-f is the “gray zone” where it is far more difficult to predict the impact of fluid boluses on preload, CO and EVLW (patient c-d). See text regarding gray zone effect. (C) The Marik-Philips and Frank-Starling curve for patients in septic shock where the Frank-Starling curve is flattened and reaches a plateau more quickly (not shown) while the Marik-Phillips curve is shifted to the left (purple dashed line) due to changes in vascular permeability, lung compliance, glycocalyx derangements, etc. Septic shock patients are more often located on the flat portion of the Frank-Starling curve and the steeper portion of the Marik-Phillips curve (patient e-f), particularly following initial fluid resuscitation. These patients are more likely to benefit from vasopressors and positive inotropes as additional fluid boluses to increase preload (black arrows) will not increase cardiac output (CO) (blue double-headed arrows) and will likely lead to volume overload and increased extravascular lung water (EVLW) (double-headed red arrows). This is because of the curvilinear shape of the left ventricular pressure-volume curve and the result of altered diastolic compliance at higher filling pressures. As atrial pressure increases, venous and pulmonary hydrostatic pressures increase, resulting in the release of natriuretic peptides. These natriuretic peptides will cause fluids to shift from the vascular space into the interstitial space. The shift of fluids to the interstitial space results in pulmonary and peripheral tissue edema. Septic patients have a higher tendency to accumulate EVLW (shift of Marik-Phillips curve to the left), and thus fluid administration should be titrated more carefully in such patients.
Figure 3
Figure 3
Eisenhower matrix of volume assessment demonstrating how the application of different volume assessment techniques are used to assess volume status and fluid responsiveness, the relationship between the techniques, and the relative degree of environmental control, degree of precision, and timing for each. CVC, caudal vena cava; PPV, pulse pressure variation; SPV, systolic pressure variation; SVV, stroke volume variation.
Figure 4
Figure 4
Mechanical ventilation induced variations in the arterial pressure curve showing systolic arterial pressure (SAP) maximum (max) and minimum (min), pulse pressure (PP) maximum and minimum, and stroke volume (SV) maximum and minimum. The greater the degree of hypovolemia, all other variables held constant (e.g., tidal volume, airway pressure, etc.), the greater the change in ventilation induced variations for all parameters. SPV, systolic pressure variation.
Figure 5
Figure 5
(A,B) Right parasternal short axis views from a normal (left) and hypovolemic (right) dog. Note how the left ventricular lumen (LV) appears smaller than the lumen of the normovolemic dog and both the intraventricular septum (IVS) and left ventricular free wall (LVFW) appear thicker. RV, right ventricle.
Figure 6
Figure 6
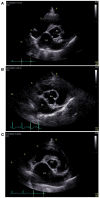
(A–C) Right parasternal short axis views showing the left atrial (LA) size compared to the aorta (Ao) size from 3 different dogs that were normovolemic (A), hypovolemic (B) and hypervolemic (C). Note the size (width) of the left atrium is only slightly larger than the aorta in a normovolemic patient (A), equal to slightly smaller than the aorta in a hypovolemic patient (B) and significantly larger than the left atrium in a patient that is hypervolemic (C).
Figure 7
Figure 7
(A, B) Long axis views of the caudal vena cava (CVC) as it crosses the diaphragm assessed at the subxiphoid site of 2 dogs that were hypovolemic (A) and hypervolemic (B). Note the CVC is very narrow or “flat” in the hypovolemic dog and quite wide or “fat” in the hypervolemic dog. There is also a suspicion of free abdominal fluid between the liver lobes in the hypervolemic dog, although free fluid cannot be differentiated from artifact in this single still image. Free abdominal fluid would not be unexpected in dogs with hypervolemia and a more thorough point of care ultrasound evaluation would be recommended to further assess this finding.
Figure 8
Figure 8
Still ultrasound image obtained during pleura and lung ultrasound (PLUS) in a dog with “wet lungs.” The presence of >3 B lines is considered “wet lung” and indicates increased extravascular lung water. Although there are multiple causes of “wet lung,” fluid overload should be suspected in a patient that has received fluid therapy fluid, particularly if the patient progresses from dry to wet lung on serial PLUS evaluation.
Figure 9
Figure 9
(A–C) Schematic images of a normal (left) gall bladder, gall bladder wall edema also referred to the halo sign (middle), and still ultrasound image of the halo sign (right). With gall bladder wall edema there is a thickening of the gall bladder wall but also a “striated” appearance that arises when anechoic fluid (black) separates the mucosal and serosal surfaces of the gall bladder wall (white). The serosal and mucosal surfaces of the gall bladder wall are indicated by an asterix in the still image. GB, gall bladder.

Similar articles

Cited by

References

    1. Finfer S, Liu B, Taylor C, Bellomo R, Billot L, Cook D, et al. . Resuscitation fluid use in critically ill adults: an international cross-sectional study in 391 intensive care units. Crit Care. (2010) 14:R185. 10.1186/cc9293 - DOI - PMC - PubMed
    1. Minto G, Mythen MG. Perioperative fluid management: science, art or random chaos? Br J Anaesth. (2015) 114:717–21. 10.1093/bja/aev067 - DOI - PubMed
    1. Myles PS, McIlroy DR, Bellomo R, Wallace S. Importance of intraopera- tive oliguria during major abdominal surgery: findings of the restrictive versus liberal fluid therapy in major abdominal surgery trial. Br J Anaesth. (2019) 122:726–33. 10.1016/j.bja.2019.01.010 - DOI - PubMed
    1. Thacker JK, Mountford WK, Ernst FR, Krukas MR, Mythen MM. Perio- perative fluid utilization variability and association with outcomes: considerations for enhanced recovery efforts in sample US surgical populations. Ann Surg. (2016) 263:502–10. 10.1097/SLA.0000000000001402 - DOI - PubMed
    1. Kulemann B, Timme S, Seifert G, Holzner PA, Glatz T, Sick O, et al. . Intraoperative crystalloid overload leads to substantial inflammatory infiltration of intestinal anastomoses a histomorphological analysis. Surgery. (2013) 154:596–603. 10.1016/j.surg.2013.04.010 - DOI - PubMed