

Uncovering transmission patterns of COVID-19 outbreaks: A region-wide comprehensive retrospective study in Hong Kong
- PMID: 34124628
- PMCID: PMC8179759
- DOI: 10.1016/j.eclinm.2021.100929
Uncovering transmission patterns of COVID-19 outbreaks: A region-wide comprehensive retrospective study in Hong Kong
Abstract
Background: Given the dynamism and heterogeneity of COVID-19 transmission patterns, determining the most effective yet timely strategies for specific regions remains a severe challenge for public health decision-makers.
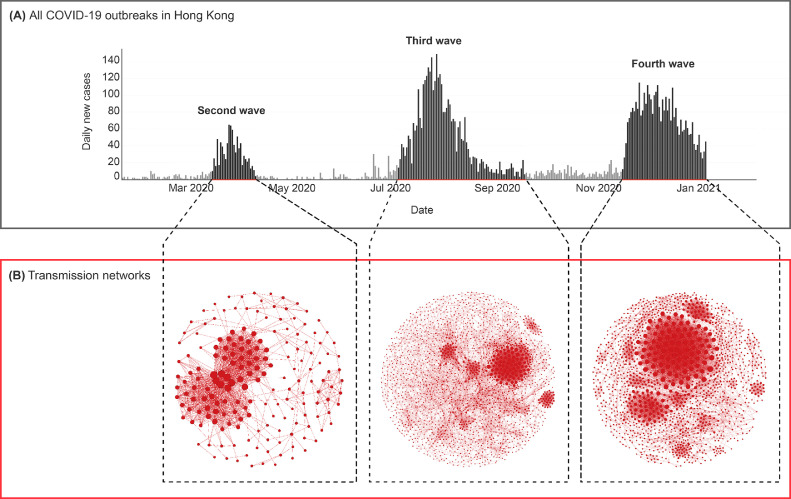
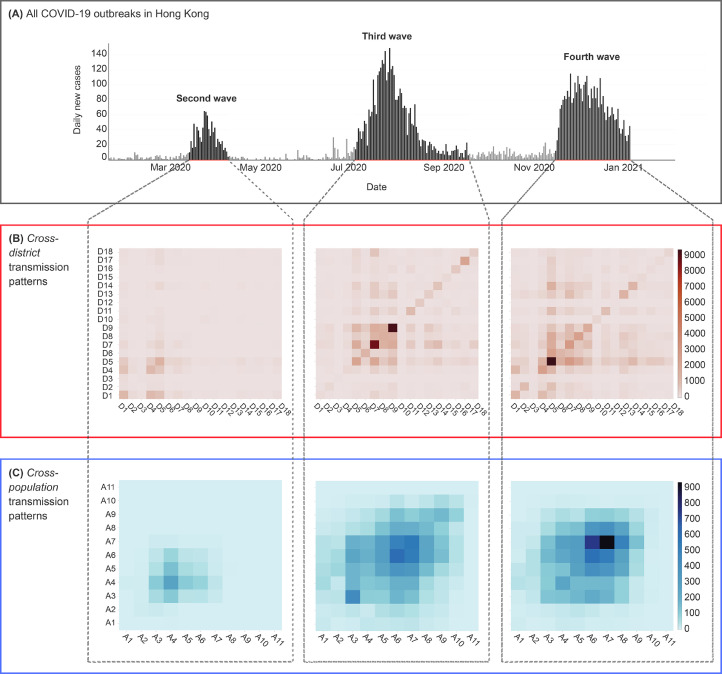
Methods: In this work, we proposed a spatiotemporal connectivity analysis method for discovering transmission patterns across geographic locations and age-groups throughout different COVID-19 outbreak phases. First, we constructed the transmission networks of the confirmed cases during different phases by considering the spatiotemporal connectivity of any two cases. Then, for each case and those cases immediately pointed from it, we characterized the corresponding cross-district/population transmission pattern by counting their district-to-district and age-to-age occurrences. By summating the cross-district/population transmission patterns of all cases during a given period, we obtained the aggregated cross-district and cross-population transmission patterns.
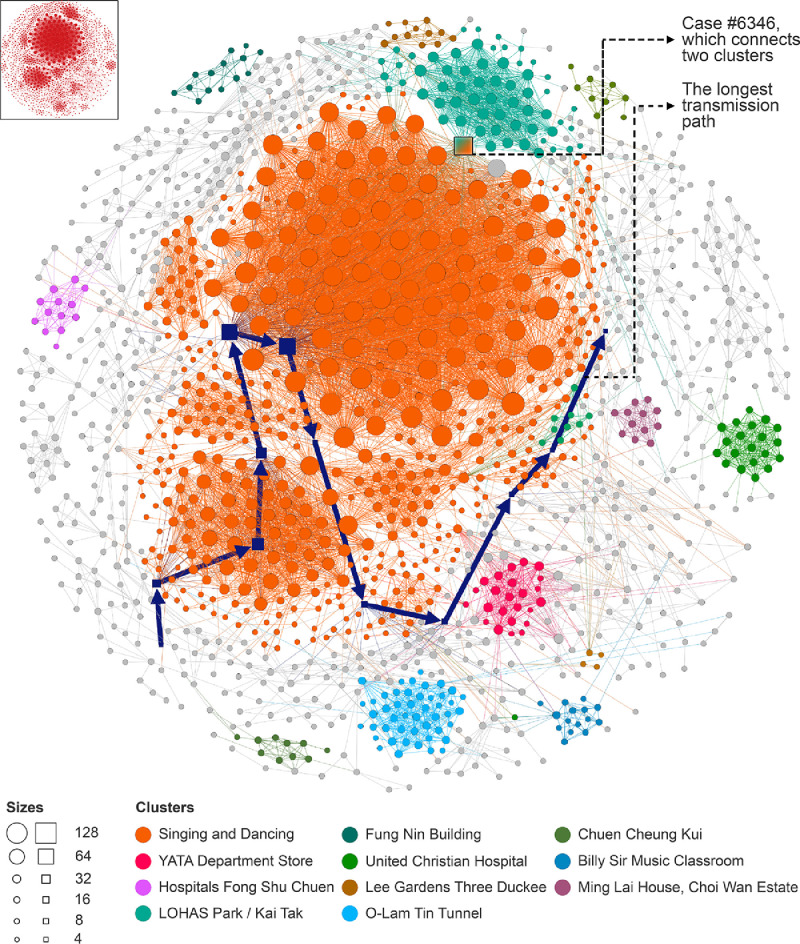
Findings: We conducted a region-wide comprehensive retrospective study in Hong Kong based on the complete data report of COVID-19 cases, covering all 18 districts between January 23, 2020, and January 8, 2021 (https://data.gov.hk/en-data/dataset/hk-dh-chpsebcddr-novel-infectious-agent). The spatiotemporal connectivity analysis clearly unveiled the quantitative differences among various outbreak waves in their transmission scales, durations, and patterns. Moreover, for the statistically similar waves, their cross-district/population transmission patterns could be quite different (e.g., the cross-district transmission of the fourth wave was more diverse than that of the third wave, while the transmission over age-groups of the fourth wave was more concentrated than that of the third wave). At an overall level, super-spreader individuals (highly connected cases in the transmission networks) were usually concentrated in only a few districts (2 out of 18 in our study) or age-groups (3 out of 11 in our study).
Interpretation: With the discovered cross-district or cross-population transmission patterns, all of the waves of COVID-19 outbreaks in Hong Kong can be systematically scrutinized. Among all districts, quite a few (e.g., the Yau Tsim Mong district) were instrumental in spreading the virus throughout the pandemic. Aside from being exceptionally densely populated, these districts were also social-economic centers. With a variety of situated public venues, such as restaurants and singing/dancing clubs, these districts played host to all kinds of social gathering events, thereby providing opportunities for widespread and rapid transmission of the virus. Thus, these districts should be given the highest priority when deploying district-specific social distancing or intervention strategies, such as lockdown and stringent mandatory coronavirus testing for identifying and obstructing the chain of transmission. We also observed that most of the reported cases and the highly connected cases were middle-aged and elderly people (40- to 69-year-olds). People in these age-groups were active in various public places and social activities, and thus had high chances of being infected by or infecting others.
Funding: General research fund of the Hong Kong research grants council.
Keywords: COVID-19; Cross-district and Cross-population Transmission Patterns; Retrospective Study in Hong Kong; Spatiotemporal Connectivity Analysis; Transmission Networks.
© 2021 The Author(s).
Conflict of interest statement
We declare no competing interests.
Figures
Similar articles
-
Optimal resource allocation with spatiotemporal transmission discovery for effective disease control.Infect Dis Poverty. 2022 Mar 25;11(1):34. doi: 10.1186/s40249-022-00957-1. Infect Dis Poverty. 2022. PMID: 35331329 Free PMC article.
-
TransCode: Uncovering COVID-19 transmission patterns via deep learning.Infect Dis Poverty. 2023 Feb 28;12(1):14. doi: 10.1186/s40249-023-01052-9. Infect Dis Poverty. 2023. PMID: 36855184 Free PMC article.
-
What are the underlying transmission patterns of COVID-19 outbreak? An age-specific social contact characterization.EClinicalMedicine. 2020 Apr 18;22:100354. doi: 10.1016/j.eclinm.2020.100354. eCollection 2020 May. EClinicalMedicine. 2020. PMID: 32313879 Free PMC article.
-
Clinical Characteristics and Transmission of COVID-19 in Children and Youths During 3 Waves of Outbreaks in Hong Kong.JAMA Netw Open. 2021 May 3;4(5):e218824. doi: 10.1001/jamanetworkopen.2021.8824. JAMA Netw Open. 2021. PMID: 33938934 Free PMC article.
-
Assessing Community Vulnerability over 3 Waves of COVID-19 Pandemic, Hong Kong, China.Emerg Infect Dis. 2021 Jul;27(7):1935-1939. doi: 10.3201/eid2707.204076. Emerg Infect Dis. 2021. PMID: 34152957 Free PMC article.
Cited by
-
Heterogeneity in the onwards transmission risk between local and imported cases affects practical estimates of the time-dependent reproduction number.Philos Trans A Math Phys Eng Sci. 2022 Oct 3;380(2233):20210308. doi: 10.1098/rsta.2021.0308. Epub 2022 Aug 15. Philos Trans A Math Phys Eng Sci. 2022. PMID: 35965464 Free PMC article.
-
Variability in the Population Diffusion Patterns of SARS-CoV-2 by Exposure Setting and Its Roles in Driving Epidemic Dynamics.Influenza Other Respir Viruses. 2025 Jun;19(6):e70125. doi: 10.1111/irv.70125. Influenza Other Respir Viruses. 2025. PMID: 40452161 Free PMC article.
-
Optimal resource allocation with spatiotemporal transmission discovery for effective disease control.Infect Dis Poverty. 2022 Mar 25;11(1):34. doi: 10.1186/s40249-022-00957-1. Infect Dis Poverty. 2022. PMID: 35331329 Free PMC article.
-
Uncovering the Impact of Control Strategies on the Transmission Pattern of SARS-CoV-2 - Ruili City, Yunnan Province, China, February-March 2022.China CDC Wkly. 2022 Nov 18;4(46):1032-1038. doi: 10.46234/ccdcw2022.208. China CDC Wkly. 2022. PMID: 36483190 Free PMC article.
-
An analysis of the spatio-temporal behavior of COVID-19 patients using activity trajectory data.Heliyon. 2023 Oct 9;9(10):e20681. doi: 10.1016/j.heliyon.2023.e20681. eCollection 2023 Oct. Heliyon. 2023. PMID: 37867866 Free PMC article.
References
-
- World Health Organization, (WHO), WHO coronavirus disease (COVID-19) dashboard, https://covid19.who.int/.
-
- Johns Hopkins coronavirus resource center, COVID-19 map, https://coronavirus.jhu.edu/.
-
- Gibney E. Whose coronavirus strategy worked best? Scientists hunt most effective policies. Nature. 2020;581:15–16. - PubMed
-
- Brauner J.M., Mindermann S., Sharma M., Johnston D., Salvatier J., Gavenčiak T., Stephenson A.B., Leech G., Altman G., Mikulik V., Norman A.J., Monrad J.T., Besiroglu T., Ge H., Hartwick M.A., Teh Y.W., Chindelevitch L., Gal Y., Kulveit J. Inferring the effectiveness of government interventions against COVID-19. Science. 2020 doi: 10.1126/science.abd9338. - DOI - PMC - PubMed
LinkOut - more resources
Full Text Sources
Research Materials
