. 2020 Jun;1(6):603-619.
doi: 10.1038/s43018-020-0064-0. Epub 2020 May 25.

Activation of p38α stress-activated protein kinase drives the formation of the pre-metastatic niche in the lungs

Affiliations

Activation of p38α stress-activated protein kinase drives the formation of the pre-metastatic niche in the lungs

Jun Gui et al. Nat Cancer. 2020 Jun.

Abstract

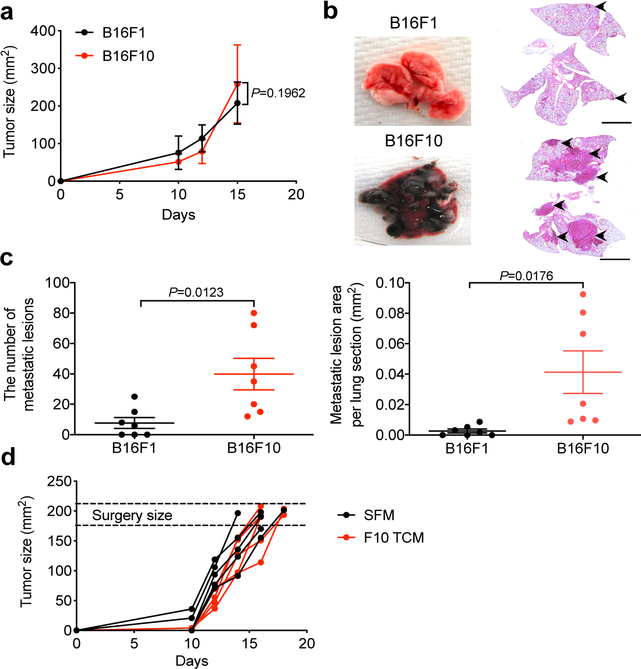
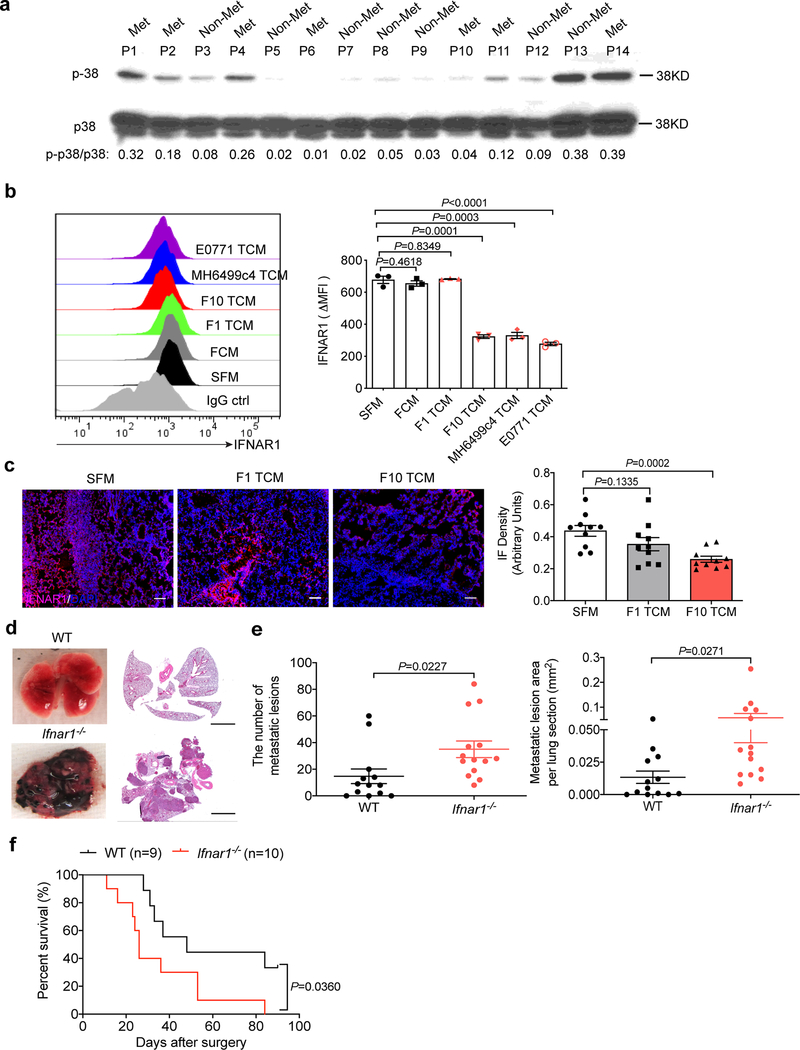
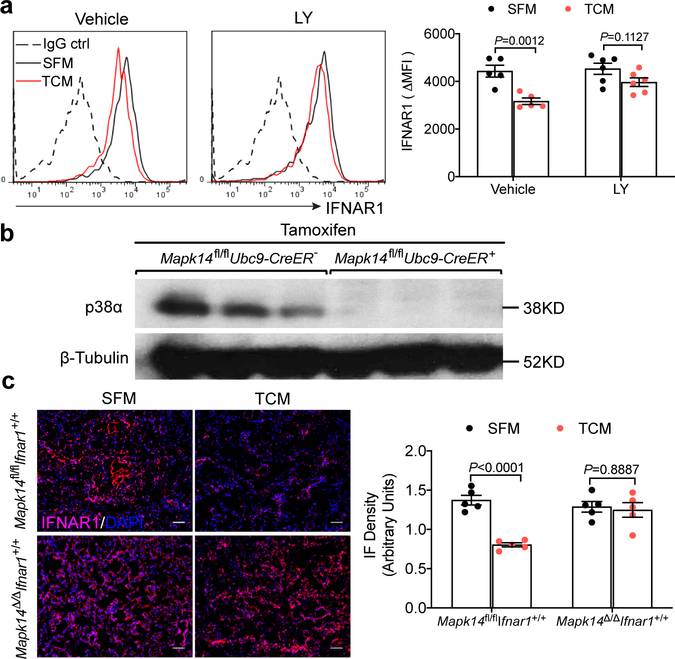
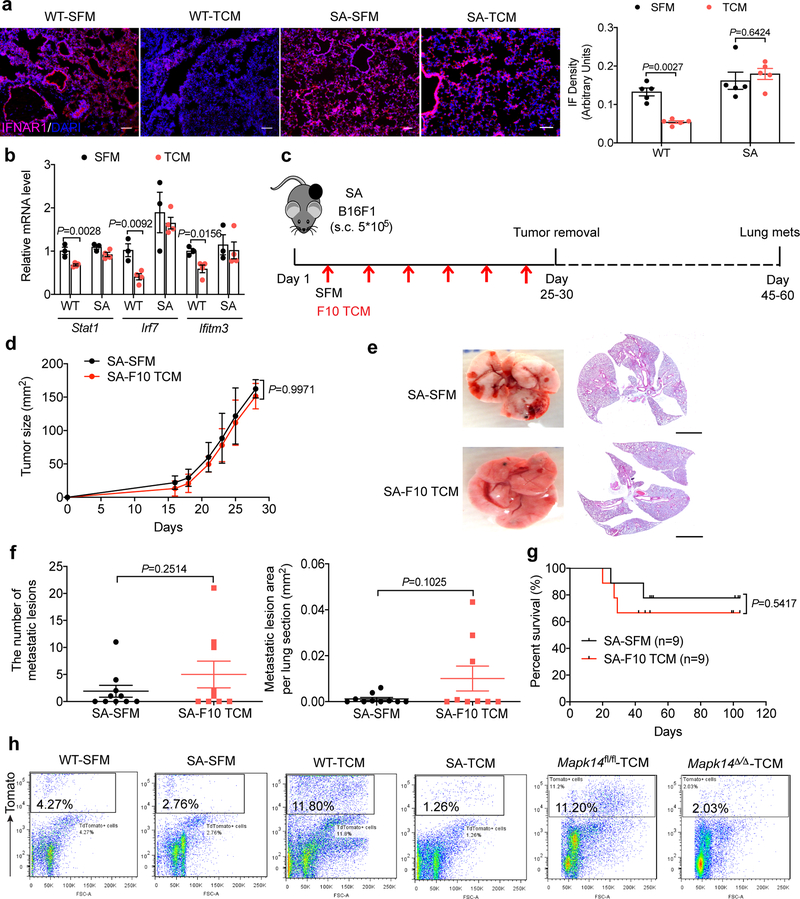
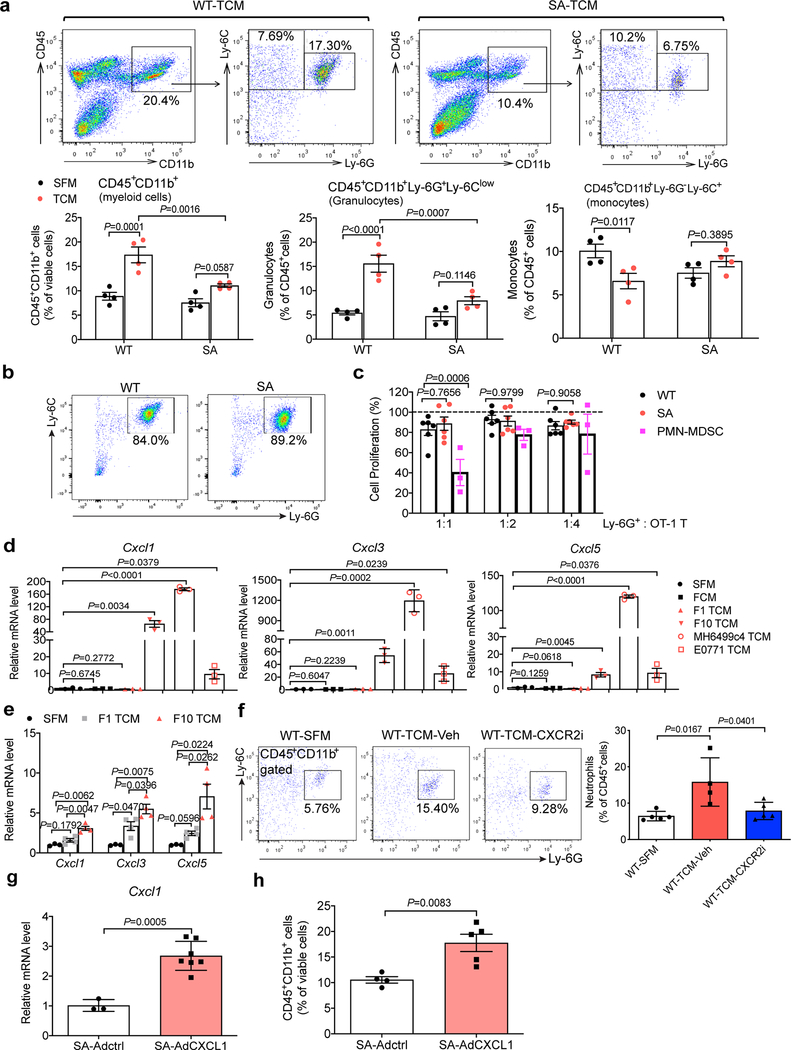
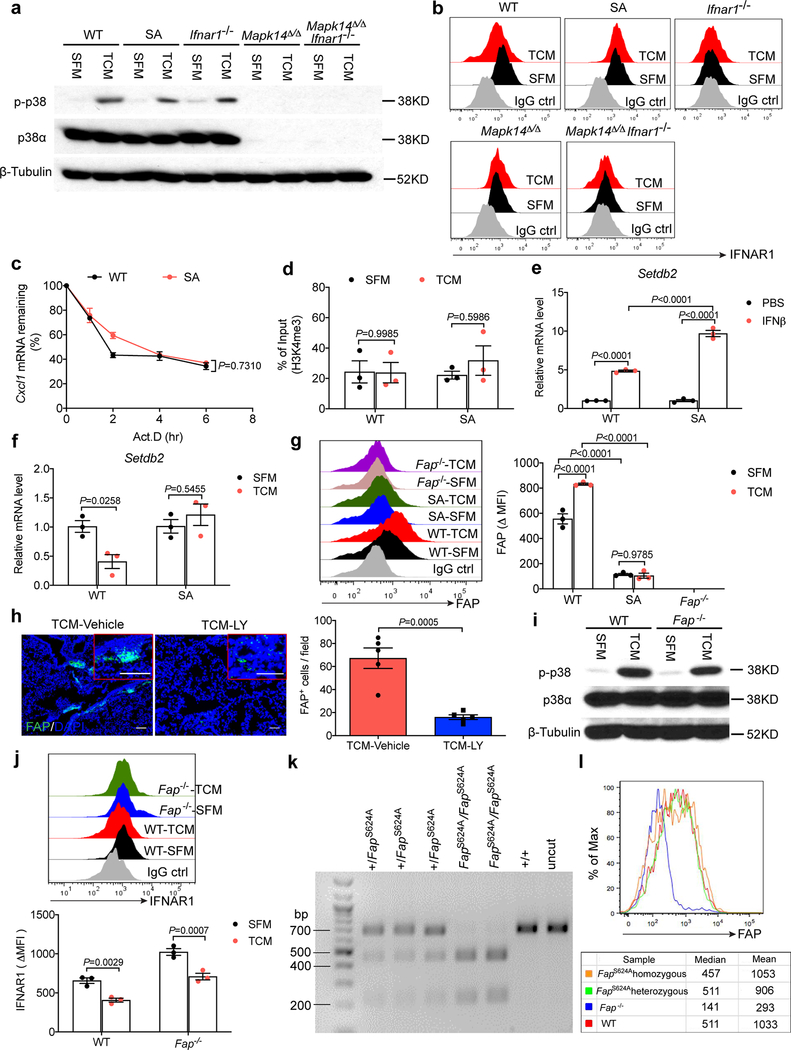
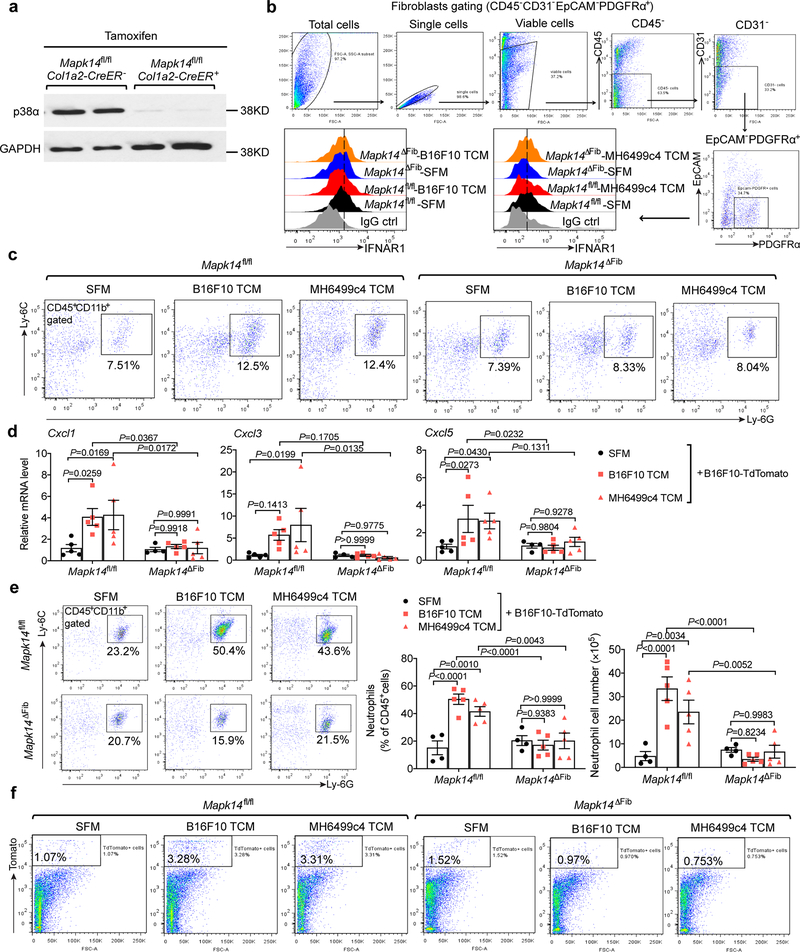
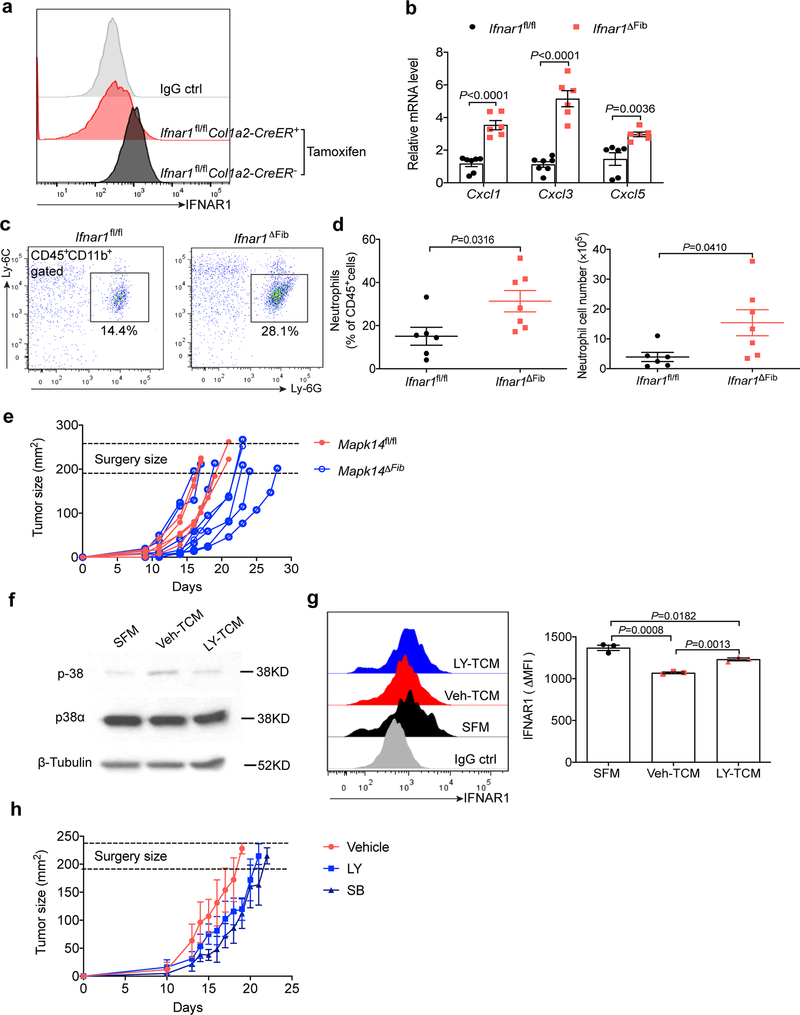
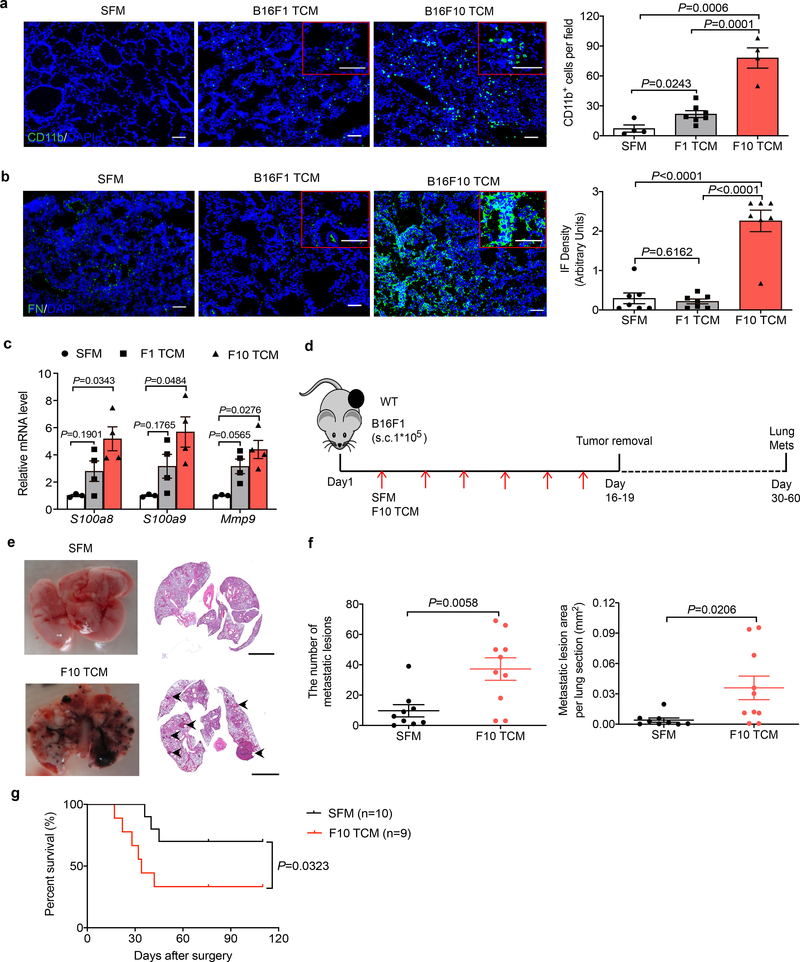
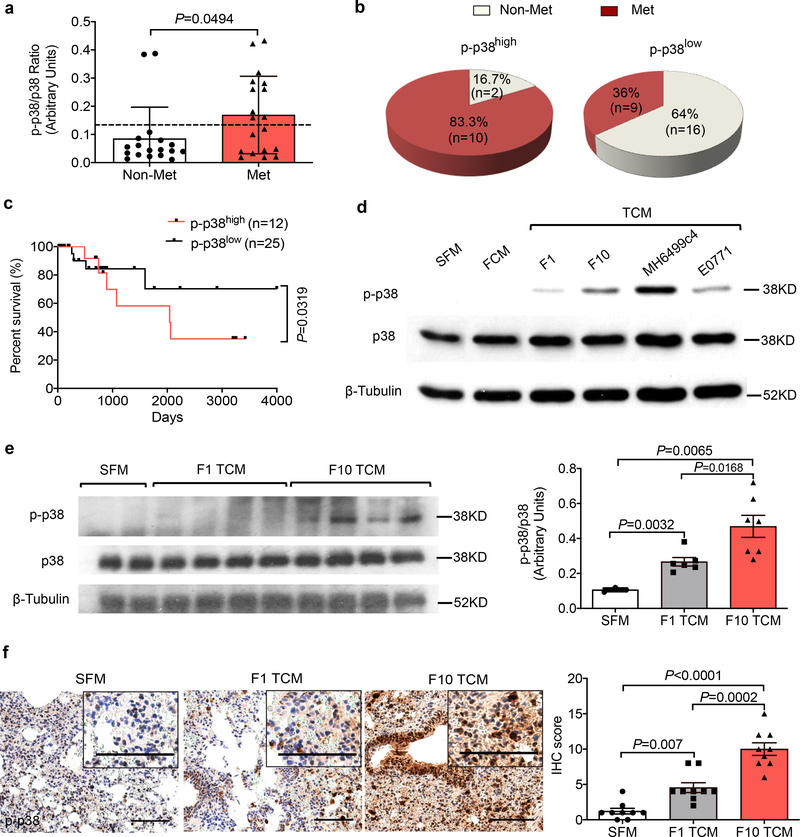
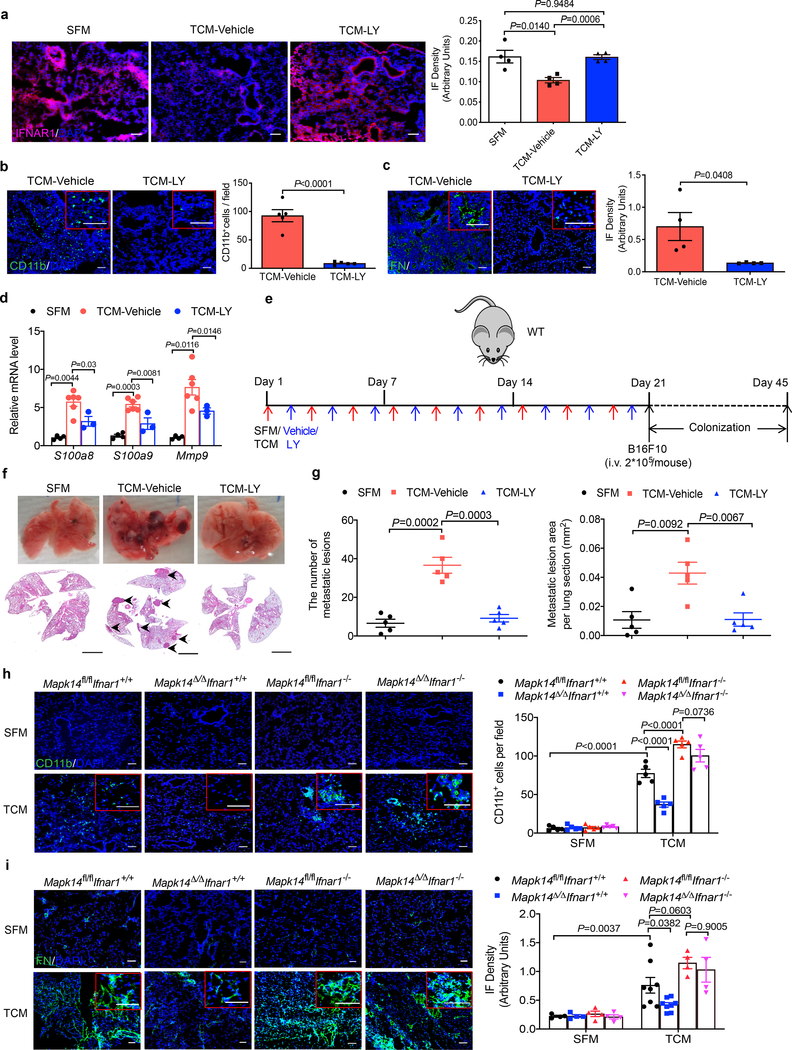
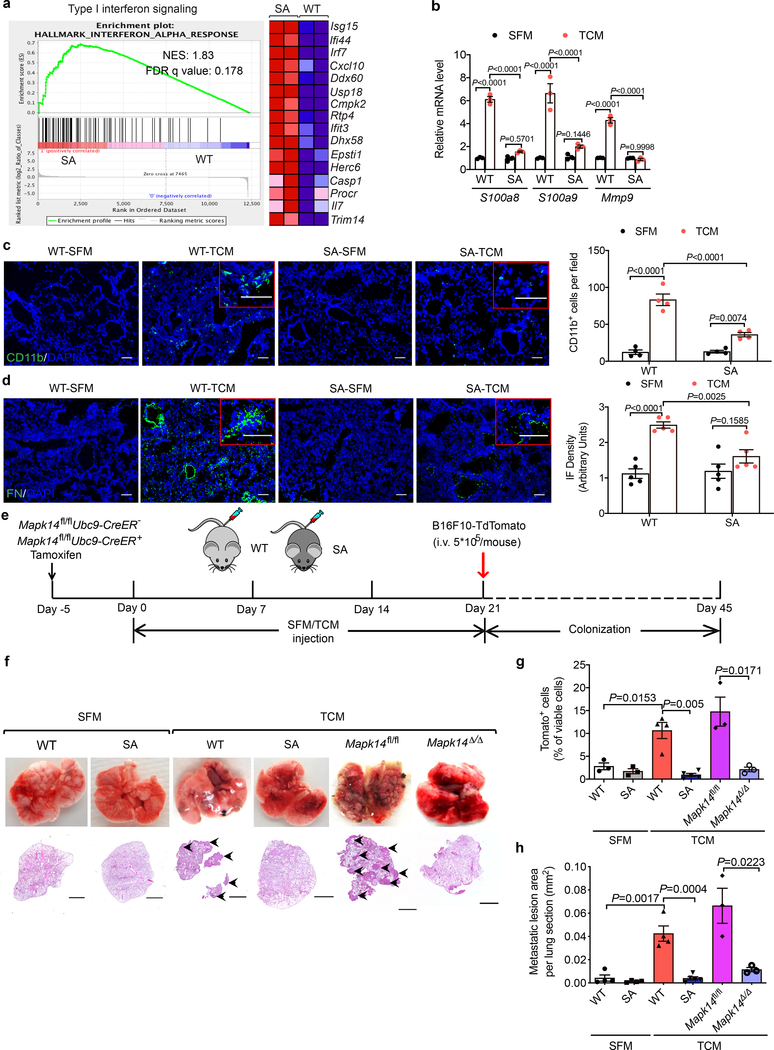
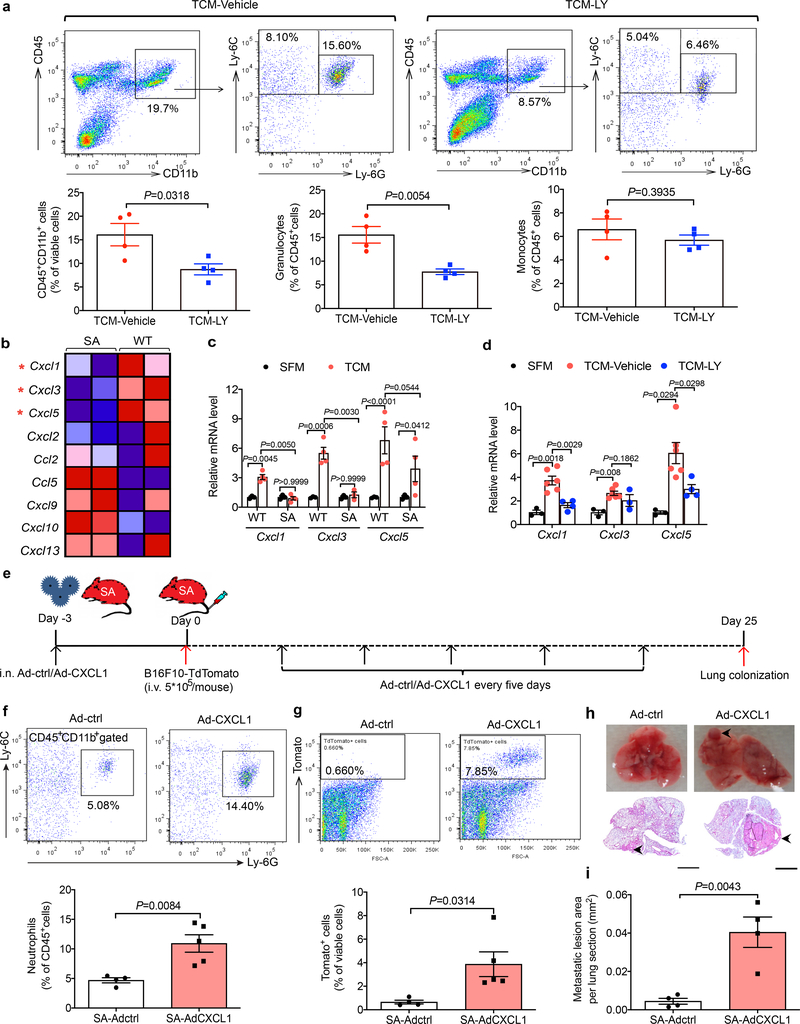
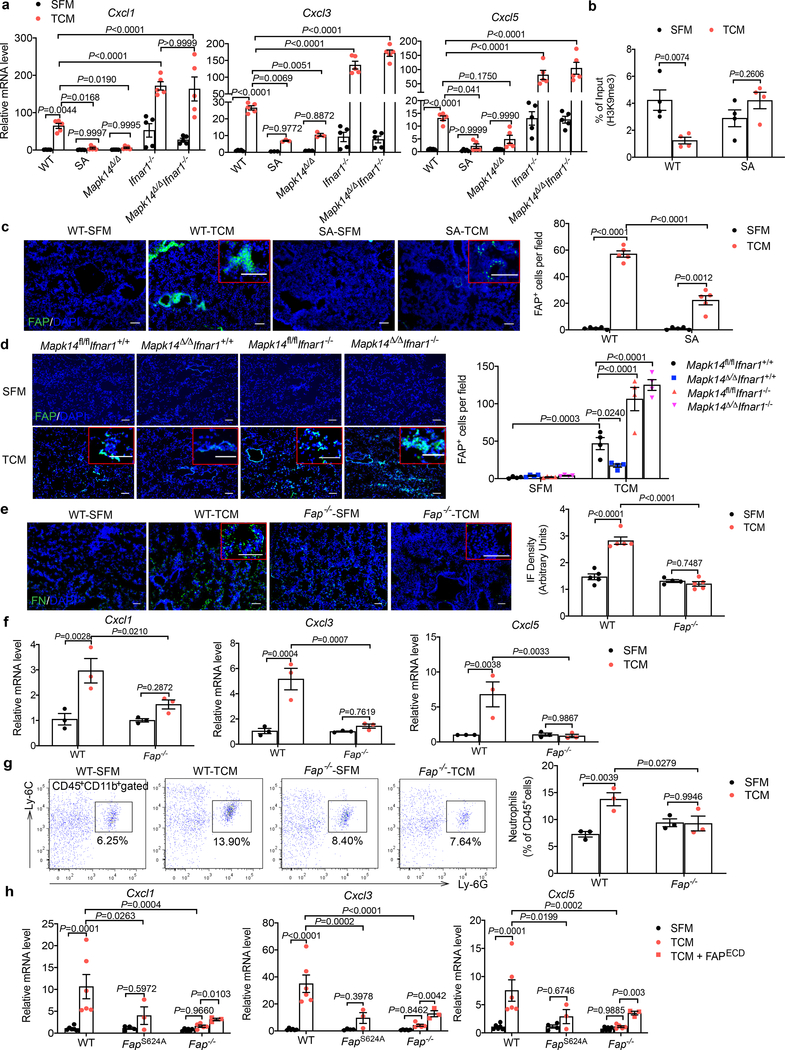
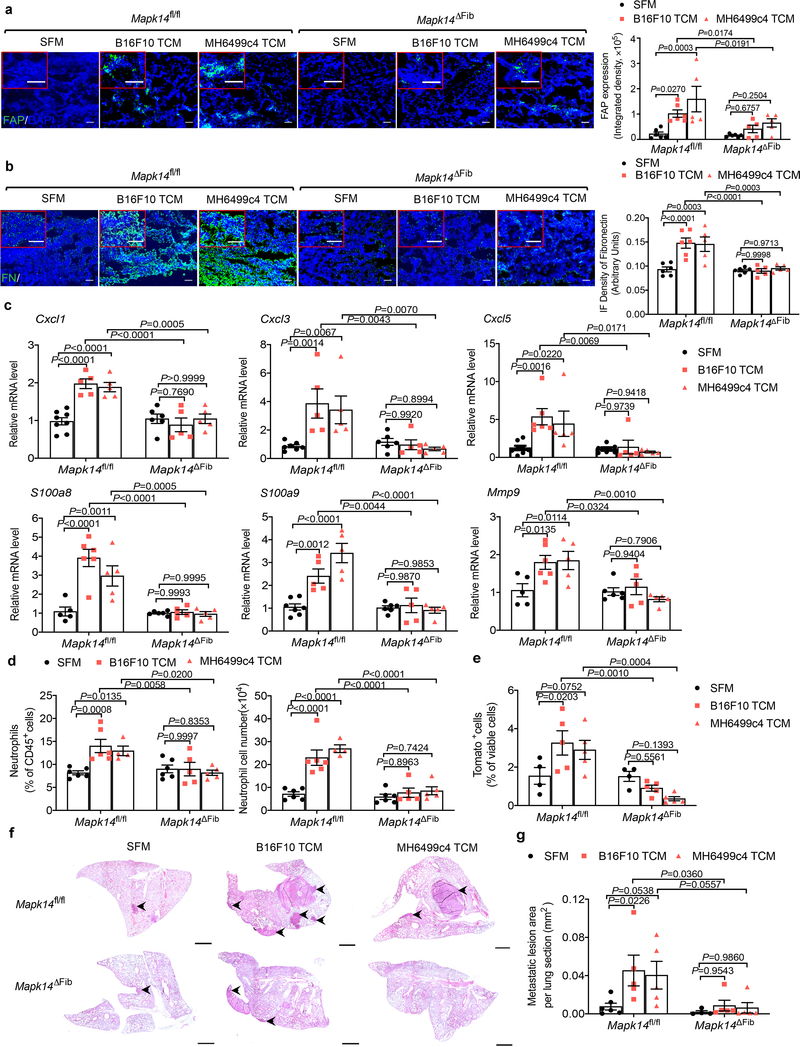
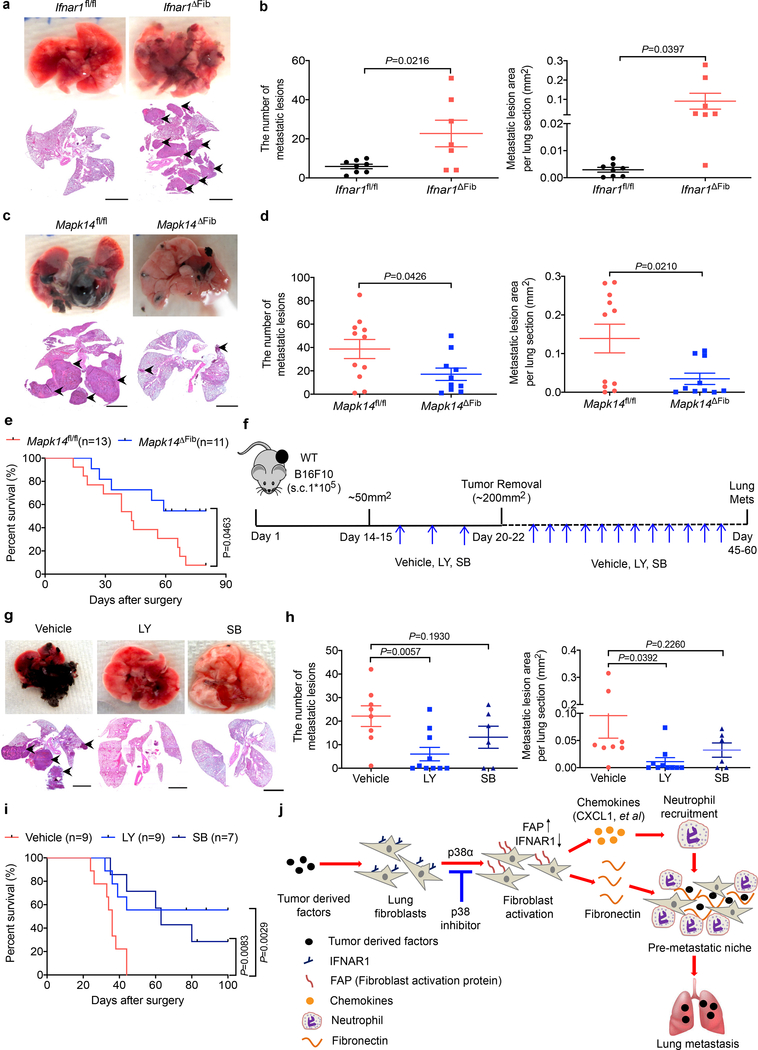
Primary tumor-derived factors (TDFs) act upon normal cells to generate a pre-metastatic niche, which promotes colonization of target organs by disseminated malignant cells. Here we report that TDFs-induced activation of the p38α kinase in lung fibroblasts plays a critical role in the formation of a pre-metastatic niche in the lungs and subsequent pulmonary metastases. Activation of p38α led to inactivation of type I interferon signaling and stimulation of expression of fibroblast activation protein (FAP). FAP played a key role in remodeling of the extracellular matrix as well as inducing the expression of chemokines that enable lung infiltration by neutrophils. Increased activity of p38 in normal cells was associated with metastatic disease and poor prognosis in human melanoma patients whereas inactivation of p38 suppressed lung metastases. We discuss the p38α-driven mechanisms stimulating the metastatic processes and potential use of p38 inhibitors in adjuvant therapy of metastatic cancers.

Keywords: IFNAR1; adjuvant therapy; fibroblast activation protein; interferon; lung metastasis; melanoma; metastatic cancer; p38 inhibitor; p38 kinase; pancreatic ductal adenocarcinoma; pre-metastatic niche; tumor-derived factors.


Conflict of interest statement

Competing Interests Statement The authors have declared that no conflict of interest exists

Figures

Extended Data Fig. 1:
Extended Data Fig. 1:. Characterization of the metastasis in the lung tissues of B16F1 and B16F10 tumor bearing mice
a. The primary tumor growth in WT mice s.c injected with 1*105 B16F1 or B16F10 tumor cells prior to surgery at equivalent tumor size (~200 mm2). Data shown as mean±SEM (n=7 mice per group). Repeated-measure two-way ANOVA and Sidak’s multiple comparisons test were performed. b. A representative lung images and the corresponding H&E stained lung sections in the B16F1 and B16F10 tumor bearing mice after surgery. Scale bar: 1 mm. This experiment was repeated three times independently with similar results. c. Quantification of the number of metastatic lesions and total area in the lung tissues from B16F1 and B16F10 tumor bearing mice after surgery as shown in b. Data shown as mean±SEM (n=7 mice per group). Two-tailed Unpaired t test was performed for the comparison. d. The primary tumor growth in the B16F1 tumor bearing mice treated with SFM or B16F10 TCM prior to surgery (100 μl every other day until primary tumor removal upon reaching the size ~200 mm2). n=5 mice per group.
Extended Data Fig. 2:
Extended Data Fig. 2:. Tumor derived factors induce p38 activation and IFNAR1 downregulation
a. A representative western blot analysis of p-p38 and total p38 in the leukocytes isolated from the peripheral blood of melanoma patients with metastasis (Met) and without metastasis (Non-Met). The ratio of p-38 to p38 was shown at bottom for each patient. This experiment was repeated three times independently with similar results. b. A representative flow cytometry histogram (left) and the quantification of surface IFNAR1 level (right) in WT lung fibroblasts 2 hr after SFM, conditioned media from normal lung fibroblasts (FCM), or TCM from different tumor cells including B16F1, B16F10, MH6499c4, and E0771. Quantitative data shown as mean±SEM (n=3 biologically independent samples). Two- tailed Unpaired t test was performed for the comparisons between two groups. c. A representative immunofluorescence staining of IFNAR1 (left) and the quantification of IFNAR1 level (right) in the lung tissues from WT mice treated with SFM, B16F1 TCM or B16F10 TCM (100 μl i.v., 3x per week for 3 weeks). Scale bar: 100 μm. Quantitative data shown as mean±SEM (n=10 mice per group). Two-tailed Unpaired t test was performed for the comparisons between two groups. d. Representative lung images and the corresponding H&E-stained lung sections in WT and Ifnar1−/− B16F1 tumor bearing mice after surgery. Lung metastases were analyzed around 30–60 days after primary tumor removal upon reaching the size ~200mm2. Scale bar: 1 mm. This experiment was repeated three times independently with similar results. e. Quantification of the number of metastatic lesions and total area in the lung tissues from WT (n=13 mice) and Ifnar1−/− (n=14 mice) B16F1 tumor bearing mice after surgery. Data shown as mean±SEM. Two-tailed Unpaired t test was performed for the comparison. f. Kaplan-Meier analysis of survival of WT (n=9 mice) and Ifnar1−/− (n=10 mice) B16F1 tumor bearing mice after surgery by Log-rank test.
Extended Data Fig. 3:
Extended Data Fig. 3:. p38α inhibition or gene deletion impede tumor derived factors-induced downregulation of IFNAR1
a. A representative flow cytometry analysis (left) and the quantification of surface IFNAR1 level (right) in WT lung fibroblasts pretreated with vehicle (DMSO) or p38 inhibitor Ralimetinib (LY2228820, 4 μM for 2 hr) followed by SFM, or B16F10 TCM treatment for additional 2 hr. Quantitative data shown as mean±SEM (n=5,and n=6 biologically independent samples in Vehicle and LY treated group). Two-way ANOVA and Sidak’s multiple comparisons test were performed. b. A representative western blot analysis of total p38α protein level in the lung tissues of Mapk14fl/fl Ubc9-CreER- and Mapk14fl/flUbc9-CreER+ mice after tamoxifen treatment. Similar results were obtained from three independent experiments. c. A representative immunofluorescence staining of IFNAR1 (left) and the quantification of IFNAR1 level (right) in the lung tissues from Mapk14 competent mice (Mapk14fl/fl) and Mapk14 deleted mice (Mapk14Δ/Δ) treated with SFM or B16F10 TCM (100 μl i.v., 3x per week for 3 weeks). Scale bar: 100 μm. Quantitative data shown as mean±SEM (n=5 mice per group). Two-way ANOVA and Sidak’s multiple comparisons test were performed.
Extended Data Fig. 4:
Extended Data Fig. 4:. p38α-mediated IFNAR1 downregulation drives the formation of pre-metastatic niche in the lungs
a. A representative immunofluorescence staining of IFNAR1 (left) and the quantification of IFNAR1 level (right) in the lung tissues from WT and SA mice treated with SFM or B16F10 TCM. Scale bar: 100 μm. Quantitative data shown as mean±SEM (n=5 mice per group). Two-way ANOVA and Sidak’s multiple comparisons test were performed. b. qPCR analysis of mRNA levels of indicated interferon stimulated genes in the lung tissues of WT and SA mice treated with SFM or B16F10 TCM. Data shown as mean±SEM (n=3, n=4 mice in SFM and TCM treated group respectively). Two-way ANOVA and Tukey’s multiple comparisons test were performed. c. Schematic illustration for analysis of the lung metastasis in the B16F1 tumor bearing SA mice treated with SFM or B16F10 TCM (100 μl i.v. every other day until primary tumor removal upon reaching the size ~200 mm2). d. The primary tumor growth of B16F1 in SA mice treated with SFM or B16F10 TCM prior to surgery. Data shown as mean±SEM (n=4 mice per group). Repeated-measure two-way ANOVA and Sidak’s multiple comparisons test were performed. e. Representative lung images and the corresponding H&E-stained lung sections of indicated mice as described in c. Scale bar: 1 mm. Similar results were obtained from three independent experiments. f. Quantification of the number of metastatic lesions and total area in the lung tissues from B16F1 tumor bearing SA mice treated with SFM (n=10 mice) or B16F10 TCM (n=9 mice) after surgery. Data shown as mean±SEM. Two-tailed Unpaired t test was performed for the comparison. g. Kaplan-Meier analysis of survival of B16F1 tumor bearing SA mice treated with SFM (n=9 mice) or B16F10 TCM (n=9 mice) after surgery by Log-rank test. h. Representative flow cytometry analysis of tumor cells (TdTomato+) in the lung tissues of WT, SA, and tamoxifen treated-Mapk14fl/flUbc9-CreER- (Mapk14fl/fl) and Mapk14fl/flUbc9-CreER+ (Mapk14Δ/Δ) mice pretreated with SFM or B16F10 TCM followed by intravenous injection of 5*105 B16F10-TdTomato cells. Similar results were obtained from three independent experiments.
Extended Data Fig. 5:
Extended Data Fig. 5:. p38α-mediated IFNAR1 downregulation induces CXCL1/CXCL3/CXCL5-CXCR2 axis which is critical for the neutrophil recruitment
a. Representative flow cytometry analysis of myeloid cell subpopulations (above) and the quantification of these cell subpopulations (below) in the lung tissues of WT and SA mice treated with SFM or B16F10 TCM. Quantitative data shown as mean±SEM (n=4 mice per group). Two-way ANOVA and Sidak’s multiple comparisons test were performed. b. Representative flow cytometry analysis of the purity of the isolated granulocytes from lung tissues of WT and SA mice treated with B16F10 TCM. Similar results were obtained from three independent experiments. c. Antigen-specific proliferation of CD8+ T cells in the presence of isolated granulocytes (Ly-6G+) from the lung tissues of WT and SA mice treated with B16F10 TCM at a ratio of 1:1, 1:2 or 1:4 measured as the uptake of 3H thymidine and presented relative to that in the absence of granulocytes which set as 100%. Splenic PMN-MDSC isolated from MC38 tumor-bearing mice served as a positive control for the suppression. Data shown as mean±SEM (n=6 mice for WT and SA group, n=3 mice for PMN-MDSC). Two-way ANOVA and Sidak’s multiple comparisons test were performed. d. qPCR analysis of mRNA levels of the indicated chemokines in WT lung fibroblasts 6 hr after SFM, conditioned media from normal lung fibroblasts (FCM), or TCM from different tumor cells including B16F1, B16F10, MH6499c4, and E0771. Data shown as mean±SEM (n=3 biologically independent samples). Two-tailed Unpaired t test was performed for the comparisons between two groups. e. qPCR analysis of mRNA levels of the indicated chemokines in the lung tissues of WT mice treated with SFM (n=3 mice), B16F1 TCM (n=4 mice) or B16F10 TCM (n=4 mice). Data shown as mean±SEM. Two-way ANOVA and Tukey’s multiple comparisons test were performed. f. Representative flow cytometry analysis (left) and the quantification of percent of neutrophils (right) in the lung tissues of WT mice treated with SFM (n=5 mice), B16F10 TCM plus vehicle (n=4 mice) or CXCR2 inhibitor (n=5 mice). Quantitative data shown as mean±SEM. Two-tailed Unpaired t test was performed for the comparisons between two groups. g. qPCR analysis of mRNA level of Cxcl1 in the lung tissues of SA mice intranasally administered with control (n=3 mice) or CXCL1 (n=7 mice) expressing adenovirus. Data shown as mean±SEM. Two-tailed Unpaired t test was performed for the comparison. h. The percent of total myeloid cells in the lung tissues of SA mice intranasally administered with control (n=4 mice) or CXCL1 (n=5 mice) expressing adenovirus. Data shown as mean±SEM. Two-tailed Unpaired t test was performed for the comparison.
Extended Data Fig. 6:
Extended Data Fig. 6:. p38α-mediated IFNAR1 downregulation induces FAP expression
a. A representative western blot analysis of p-p38 and total p38 in the lung fibroblasts of WT, SA, Ifnar1 null (Ifnar1−/−), Mapk14 deletion (Mapk14Δ/Δ), Mapk14 deletion along with Ifnar1 null (Mapk14Δ/Δ Ifnar1−/−) 1 hr after SFM or B16F10 TCM treatment in vitro. b. A representative flow cytometry analysis of surface IFNAR1 level in the lung fibroblasts of WT, SA, Ifnar1−/−, Mapk14Δ/Δ, Mapk14Δ/Δ Ifnar1−/− 2 hr after SFM or B16F10 TCM treatment in vitro. c. The decay of Cxcl1 mRNA in WT and SA lung fibroblasts treated with SFM, or B16F10 TCM for 12 hr, then exposed to Actinomycin D (5 μg/ml) to terminate transcription. Cxcl1 mRNA level was determined by qPCR. Data shown as mean±SEM (n=3 independent experiments). Repeated-measure two-way ANOVA and Sidak’s multiple comparisons test were performed. d. ChIP analysis of H3K4me3 binding to the Cxcl1 promoter in the isolated WT and SA lung fibroblasts treated with SFM or B16F10 TCM for 12 hr. Data shown as mean±SEM (n=3 independent experiments). Two-way ANOVA and Sidak’s multiple comparisons test were performed. e. The mRNA level of Setdb2 in WT and SA lung fibroblasts treated with PBS or murine IFNβ (1000 IU/ml) for 4 hr. Data shown as mean±SEM (n=3 biologically independent samples). Two-way ANOVA and Sidak’s multiple comparisons test were performed. f. The mRNA level of Setdb2 in WT and SA lung fibroblasts treated with SFM or B16F10 TCM for 4 hr. Data shown as mean±SEM (n=3 biologically independent samples). Two-way ANOVA and Sidak’s multiple comparisons test were performed. g. A representative flow cytometry histogram (left) and the quantification of FAP expression (right) in the lung fibroblasts of WT, SA, and Fap−/− 24 hr after SFM or B16F10 TCM treatment. Quantitative data shown as mean±SEM (n=3 biologically independent samples). Two-way ANOVA and Sidak’s multiple comparisons test were performed. h. A representative immunofluorescence staining of FAP (left) and the quantification of FAP+ cells (right) in the lung tissues from WT mice treated with B16F10 TCM plus vehicle or p38 inhibitor LY2228820. Scale bar: 100 μm. Quantitative data shown as mean±SEM (n=5 mice per group). Two-tailed Unpaired t test was performed for the comparison. i. A representative western blot analysis of p-p38 and total p38 in the lung fibroblasts of WT and Fap−/− 1 hr after SFM or B16F10 TCM treatment in vitro. j. A representative flow cytometry histogram (above) and the quantification of surface IFNAR1 level (bottom) in the lung fibroblasts of WT and Fap−/− 2 hr after SFM or B16F10 TCM treatment in vitro. Quantitative data shown as mean±SEM (n=3 biologically independent samples). Two-way ANOVA and Sidak’s multiple comparisons test were performed. k. Genotyping of FapS624A mutant mice. A 677 bp amplicon was amplified by PCR both in the wild-type and FapS624A knock-in mouse. The 1 bp change generated a Stu1 restriction site (AGG|CCT) only in the knock-in mice. The PCR products were cleaned up and then digested with Stu1 producing the cut size of 210 bp and 467 bp. l. A representative flow cytometry analysis of FAP levels in the adult dermal fibroblasts isolated from Fap+/+, Fap−/−, FapS624A/S624A and FapS624A/+ mice. The experiments in a, b, i, k, l were repeated three times independently with similar results, and the results of one representative experiment are shown.
Extended Data Fig. 7:
Extended Data Fig. 7:. P38α expression in fibroblasts is critical for the generation of pre-metastatic
a. Representative western blot analysis of p38α protein level in the isolated lung fibroblasts from tamoxifen-treated Mapk14fl/flCol1a2-CreER- (Mapk14fl/fl) and Mapk14fl/flCol1a2-CreER+ (Mapk14ΔFib, p38α knock out specific in fibroblasts) mice. b. A representative flow cytometry gating and histogram of IFNAR1 level in the lung fibroblasts of Mapk14fl/fl and Mapk14ΔFib mice injected with SFM, B16F10 TCM, or MH6499c4 TCM. c. Representative flow cytometry analysis of neutrophils in the lung tissues of Mapk14fl/fl and Mapk14ΔFib mice injected with SFM, B16F10 TCM, MH6499c4 TCM. d. qPCR analysis of the indicated chemokines in the lung tissues of Mapk14fl/fl and Mapk14ΔFib mice pretreated with SFM, B16F10 TCM, or MH6499c4 TCM followed by intravenous injection of 5*105 B16F10-TdTomato cells. Data shown as mean±SEM (n=4 mice for SFM treated Mapk14ΔFib group, n=5 mice for all the other groups). Two-way ANOVA and Tukey’s multiple comparisons test were performed. e. Representative flow cytometry analysis (left) and the quantification of percent and absolute number (right) of neutrophils in the lung tissues of Mapk14fl/fl and Mapk14ΔFib mice pretreated with SFM, B16F10 TCM, MH6499c4 TCM followed by intravenous injection of 5*105 B16F10-TdTomato cells. Quantitative data shown as mean±SEM (n=4 mice for SFM treated group, n=5 mice for TCM treated group). Two-way ANOVA and Tukey’s multiple comparisons test were performed. f. Representative flow cytometry analysis of tumor cells (TdTomato+) in the lung tissues of Mapk14fl/fl and Mapk14ΔFib mice pretreated with SFM, B16F10 TCM, or MH6499c4 TCM followed by intravenous injection of 5*105 B16F10-TdTomato cells. The experiments in a, b, c, f were repeated three times independently with similar results, and the results of one representative experiment are shown.
Extended Data Fig. 8:
Extended Data Fig. 8:. The effect of p38α deficiency specifically in fibroblasts and p38 inhibitors on the primary tumor
a. Representative flow cytometry analysis of IFNAR1 level in the isolated lung fibroblasts from tamoxifen treated Ifnar1fl/flCol1a2-CreER- (Ifnar1fl/fl) and Ifnar1fl/flCol1a2-CreER+ (Ifnar1ΔFib, Ifnar1 knock out specific in fibroblasts) mice. Similar results were obtained from three independent experiments. b. qPCR analysis of the indicated chemokines in the lung tissues of Ifnar1fl/fl (n=7 mice) and Ifnar1ΔFib mice (n=6 mice) after intravenous injection with 5*105 B16F10-TdTomato cells. Data shown as mean±SEM. Two-way ANOVA and Sidak’s multiple comparisons test were performed. c. Representative flow cytometry analysis of neutrophils in the lung tissues of Ifnar1fl/fl and Ifnar1ΔFib mice after intravenous injection with 5*105 B16F10-TdTomato cells. Similar results were obtained from three independent experiments. d. Quantification of the percent (left) and the absolute number of neutrophils (right) in the lung tissues as described in c. Data shown as mean±SEM (n=6 mice for Ifnar1fl/fl group, n=7 for Ifnar1ΔFib group). Two-tailed Unpaired t test was performed for the comparison. e. The primary tumor growth of B16F10 in the Mapk14fl/fl (n=5 mice) and Mapk14ΔFib (n=8 mice) mice s.c injected with 1×10⁵ B16F10 tumor cells prior to surgery at equivalent tumor size (~200 mm2). f. A representative western blot analysis of p-p38 and total p38 in the WT lung fibroblasts 1 hr after treatment with SFM, or TCM from B16F10 tumor cells pretreated with vehicle (DMSO) or p38 inhibitor LY2228820 (4 μM) for 24 hr. Similar results were obtained from three independent experiments. g. A representative flow cytometry histogram (left) and the quantification of surface IFNAR1 level (right) in WT lung fibroblasts 2 hr after treatment with SFM, or TCM from B16F10 tumor cells pretreated with vehicle (DMSO) or p38 inhibitor LY2228820 (4 μM) for 24 hr. Quantitative data shown as mean±SEM (n=3 biologically independent samples). Two- tailed Unpaired t test was performed for the comparisons between two groups. h. Primary tumor growth of B16F10 in mice that received vehicle, LY2228820 (LY), or SB203580 (SB) treatment prior to surgery at equivalent tumor size (~200 mm2). Data shown as mean±SEM (n=6 mice per group).
Figure 1.
Figure 1.. Tumor derived factors from highly metastatic melanoma cells induce the pre-metastatic niche and stimulate pulmonary metastases.
a. A representative immunofluorescence staining of CD11b (left) and quantification of CD11b+ cells (right) in the lung tissues from WT mice treated with tumor cell conditioned media (TCM) from B16F1, or B16F10 cells or with serum-free media (SFM) as control (100 μl i.v., 3x per week for 3 weeks). Quantitative data shown as mean±SEM (n=4 mice for SFM and F10 TCM group, n=7 mice for F1 TCM group). Two-tailed Unpaired t test was performed for the comparisons between two groups. Here and henceforth, the inset shows a zoomed (2x) area of the stained image. Scale bar: 100 μm. b. A representative immunofluorescence staining of fibronectin (left) and the quantification of fibronectin level (right) in the lung tissues from WT mice treated with B16F1 TCM, or B16F10 TCM or SFM as control (100 μl i.v., 3x per week for 3 weeks). Scale bar: 100 μm. Quantitative data shown as mean±SEM (n=7 mice per group). Two-tailed Unpaired t test was performed for the comparisons between two groups. c. qPCR analysis of mRNA levels of the niche genes in the lung tissues from WT mice treated with B16F1 TCM, or B16F10 TCM or SFM as control (100 μl i.v., 3x per week for 3 weeks). Data shown as mean±SEM (n=3 mice for SFM group, n=4 mice for F1 TCM and F10 TCM group). Two-way ANOVA and Tukey’s multiple comparisons test were performed. d. Schematic illustration for analysis of the lung metastasis in the B16F1 tumor bearing mice treated with SFM or B16F10 TCM (100 μl every other day until primary tumor removal upon reaching the size ~200 mm2). e. Representative lung images and the corresponding H&E-stained lung sections in the B16F1 tumor bearing mice treated with SFM or B16F10 TCM after surgery. Scale bar: 1 mm. Similar results were obtained from three independent experiments. f. Quantification of the number of metastatic lesions and total area in the lung tissue sections from B16F1 tumor bearing mice treated with SFM (n=9 mice) or B16F10 TCM (n=10 mice) after surgery. Data shown as mean±SEM. Two-tailed Unpaired t test was performed. g. Kaplan-Meier analysis of survival of B16F1 tumor bearing mice treated with SFM (n=10 mice) or B16F10 TCM (n=9 mice) after surgery by Gehan-Breslow-Wilcoxon test.
Figure 2.
Figure 2.. Tumor derived factors-induced activation of p38 kinase correlates with metastatic disease in human melanoma patients and mouse melanoma model.
a. The phospho-p38 (p-p38)/total p38 ratio in the leukocytes isolated from the peripheral blood of melanoma patients with metastasis (n=19) and without metastasis (n=18). The dash line denotes the average p-p38/p38 ratio among all melanoma patients. Data shown as mean±SEM. Two-tailed Unpaired t test was performed. b. Documented metastases in melanoma patients whose lymphocytes had greater (p-p38/p38high) or lower (p-p38/p38low) levels of p-p38/p38 signal ratio compared to the average p-p38/p38 ratio among all melanoma patients. Fisher’s exact test was performed. P = 0.0128. c. Kaplan-Meier analysis of survival of melanoma patients classified as p-p38/p38high (n=12) or p-p38/p38low (n=25) by Log-rank test. d. A representative western blot analysis of p-p38 and total p38 in the WT lung fibroblasts 1 hr after SFM, conditioned media from normal lung fibroblasts (FCM), or TCM from different malignant cells including B16F1 and B16F10 melanoma, MH6499c4 pancreatic ductal adenocarcinoma and E0771 mammary adenocarcinoma cell lines. Similar results were obtained from three independent experiments. e. A representative western blot analysis of p-p38/p38 (left) and quantification of the ratio of p-p38/p38 (right) in the lung tissue lysates isolated from WT mice treated with B16F1 TCM (n=6 mice), or B16F10 TCM (n=7 mice) or SFM (n=3 mice) as control (100 μl i.v., 3x per week for 3 weeks). Quantitative data shown as mean±SEM. Two-tailed Unpaired t test was performed for the comparisons between two groups. f. A representative IHC staining of p-p38 (left) and quantification of IHC score for p-p38 (right) in the lung tissue sections from WT mice treated with B16F1 TCM, or B16F10 TCM or SFM as control (100 μl i.v., 3x per week for 3 weeks). Scale bar: 100 μm. Quantitative data shown as mean±SEM (n=9 mice per group). Two-tailed Unpaired t test was performed for the comparisons between two groups.
Figure 3.
Figure 3.. P38α is essential for generation of the pre-metastatic niche.
a. A representative immunofluorescence staining of IFNAR1 (left) and quantification of IFNAR1 level (right) in the lung tissues from WT mice treated with SFM, B16F10 TCM plus vehicle or p38 inhibitor Ralimetinib (LY2228820). Scale bar: 100 μm. Quantitative data shown as mean±SEM (n=4 mice per group). Two-tailed Unpaired t test was performed for the comparisons between two groups. b. A representative immunofluorescence staining of CD11b (left) and quantification of CD11b+ cells (right) in the lung tissues from WT mice treated with B16F10 TCM plus vehicle or p38 inhibitor LY2228820. Scale bar: 100 μm. Quantitative data shown as mean±SEM (n=5 mice per group). Two-tailed Unpaired t test was performed for the comparison. c. A representative immunofluorescence staining of fibronectin (left) and quantification of fibronectin level (right) in the lung tissues from WT mice treated with B16F10 TCM plus vehicle or p38 inhibitor LY2228820. Scale bar: 100 μm. Quantitative data shown as mean±SEM (n=4 mice per group). Two-tailed Unpaired t test was performed for the comparison. d. qPCR analysis of mRNA levels of the niche genes in the lung tissues from WT mice treated with SFM (control, n=4 mice), B16F10 TCM plus vehicle (n=6 mice) or LY2228820 (n=3 mice). Data shown as mean±SEM. Two-way ANOVA and Tukey’s multiple comparisons test were performed. e. Schematic illustration for analysis of the tumor cell colonization in the lung of the mice pretreated with SFM (control), B16F10 TCM plus vehicle or LY2228820 followed by intravenous injection of 2×10⁵ B16F10 tumor cells per mouse. f. Representative lung images and the corresponding H&E-stained lung sections from the mice pretreated with SFM (control), B16F10 TCM plus vehicle or LY2228820 followed by intravenous injection of 2×10⁵ B16F10 tumor cells as described in e. Scale bar: 1 mm. The experiment was repeated three times independently with similar results. g. Quantification of the number of metastatic lesions and total area in the lung tissue sections of the mice as shown in f. Data shown as mean±SEM (n=5 mice per group). Two-tailed Unpaired t test was performed for the comparisons between two groups. h. A representative immunofluorescence staining of CD11b (left) and quantification of CD11b+ cells (right) in the lung tissues from tamoxifen-treated Ubc9-CreER- Mapk14fl/fl Ifnar1+/+ (Mapk14fl/fl Ifnar1+/+), Ubc9-CreER+ Mapk14fl/fl Ifnar1+/+ (Mapk14Δ/ΔIfnar1+/+), Ubc9-CreER- Mapk14fl/fl Ifnar1−/− (Mapk14fl/flIfnar1−/−), and Ubc9-CreER+ Mapk14fl/fl Ifnar1−/− (Mapk14Δ/ΔIfnar1−/−) mice treated with SFM or B16F10 TCM (100 μl i.v., 3x per week for 3 weeks). Scale bar: 100 μm. Quantitative data shown as mean±SEM (n=5 mice per group). Two-way ANOVA and Tukey’s multiple comparisons test were performed. i. A representative immunofluorescence staining of fibronectin (left) and the quantification of fibronectin level (right) in the lung tissues from tamoxifen-treated Ubc9-CreER- Mapk14fl/fl Ifnar1+/+ (Mapk14fl/fl Ifnar1+/+), Ubc9-CreER+ Mapk14fl/fl Ifnar1+/+ (Mapk14Δ/ΔIfnar1+/+), Ubc9-CreER- Mapk14fl/fl Ifnar1−/− (Mapk14fl/flIfnar1−/−), and Ubc9-CreER+ Mapk14fl/fl Ifnar1−/− (Mapk14Δ/ΔIfnar1−/−) mice treated with SFM or B16F10 TCM (100 μl i.v., 3x per week for 3 weeks). Scale bar: 100 μm. Quantitative data shown as mean±SEM (n=4 mice in all SFM treated group, n=8 mice in TCM treated Mapk14fl/flIfnar1+/+ and Mapk14Δ/ΔIfnar1+/+ group, n=4 mice in TCM treated Mapk14fl/flIfnar1−/− and Mapk14Δ/ΔIfnar1−/− group). Two-way ANOVA and Tukey’s multiple comparisons test were performed.
Figure 4.
Figure 4.. p38α-driven inactivation of type I interferon pathway drives the formation of a pre-metastatic niche in the lungs.
a. The heatmap and GSEA analysis of type I IFN signature genes in the lung tissues of WT and SA mice treated with B16F10 TCM (100 μl i.v., 3x per week for 3 weeks). Expression values were represented as colors, where the range of colors (red, pink, light blue, dark blue) showed the range of expression values (high, moderate, low, lowest). n=2 mice per group. NES, normalized enrichment score; FDR, false discovery rate. b. qPCR analysis of mRNA levels of indicated genes in the lung tissues from WT and SA mice treated with SFM or B16F10 TCM (100 μl i.v., 3x per week for 3 weeks). Data shown as mean±SEM (n=3 mice per group). Two-way ANOVA and Tukey’s multiple comparisons test were performed. c. A representative immunofluorescence staining of CD11b+ (left) and quantification of CD11b+ cells (right) in the lung tissues from WT and SA mice treated with SFM or B16F10 TCM (100 μl i.v., 3x per week for 3 weeks). Scale bar: 100 μm. Quantitative data shown as mean±SEM (n=4 mice per group). Two-way ANOVA and Sidak’s multiple comparisons test were performed. d. A representative immunofluorescence staining of fibronectin (left) and quantification of fibronectin level (right) in the lung tissues from WT and SA mice treated with SFM or B16F10 TCM (100 μl i.v., 3x per week for 3 weeks). Scale bar: 100 μm. Quantitative data shown as mean±SEM (n=5 mice per group). Two-way ANOVA and Sidak’s multiple comparisons test were performed. e. Schematic illustration for analysis of the tumor cell colonization in the lung of WT, SA, and tamoxifen-treated Mapk14fl/flUbc9CreER- (Mapk14fl/fl) and Mapk14fl/flUbc9CreER+ (Mapk14Δ/Δ, p38α knock out in the whole body) mice pretreated with SFM or B16F10 TCM (100 μl i.v., 3x per week for 3 weeks) followed by intravenous injection of 5*105 B16F10-TdTomato cells. f. Representative lung images and the corresponding H&E-stained lung sections of the indicated mice as described in e. Scale bar: 1 mm. Similar results were obtained from three independent experiments. g. The percent of TdTomato+ tumor cells analyzed by flow cytometry in the lung tissues of indicated mice as described in e. Data shown as mean±SEM (n=3 mice for SFM treated WT and SA group, n=3 mice for TCM treated Mapk14fl/fl and Mapk14Δ/Δ group, n=4 mice for TCM treated WT group, n=5 for TCM treated SA group). Two-tailed Unpaired t test was performed for the comparisons between two groups. h. Quantification of metastatic lesion area in the lung tissues of indicated mice as described in e. Data shown as mean±SEM (n=4 mice for SFM treated WT and SA group, and TCM treated WT group, n=3 mice for TCM treated Mapk14fl/fl and Mapk14Δ/Δ group, n=5 mice for TCM treated SA group). Two tailed-Unpaired t test was performed for the comparisons between groups.
Figure 5.
Figure 5.. p38α activation-mediated induction of the neutrophil-attracting chemokines stimulates melanoma cell colonization in the lungs.
a. Representative flow cytometry analysis of myeloid cell subpopulations (total myeloid cells: CD45+CD11b+; granulocytes: CD45+CD11b+Ly-6G+Ly-6Clow; monocytes: CD45+CD11b+Ly-6G-Ly-6C+) (above) and quantification of these cell subpopulations (below) in the lung tissues of WT mice treated with B16F10 TCM plus vehicle or p38 inhibitor LY2228820. Quantitative data shown as mean±SEM (n=4 mice per group). Two-tailed Unpaired t test was performed for the comparison. b. Heatmap of gene expression of chemokines in the lung tissues of WT and SA mice treated with B16F10 TCM (100 μl i.v., 3x per week for 3 weeks). Expression values were represented as colors, where the range of colors (red, pink, light blue, dark blue) showed the range of expression values (high, moderate, low, lowest). The red asterisks denote core enriched genes in WT mice compared to SA mice. c. qPCR analysis of mRNA levels of the indicated chemokines in the lung tissues of WT and SA mice treated with SFM or B16F10 TCM (100 μl i.v., 3x per week for 3 weeks). Data shown as mean±SEM (n=3 mice for SFM group, n=4 mice for TCM group). Two-way ANOVA and Tukey’s multiple comparisons test were performed. d. qPCR analysis of mRNA levels of the indicated chemokines in the lung tissues of WT mice treated with SFM (n=3 mice), B16F10 TCM plus vehicle (n=6 mice) or p38 inhibitor LY2228820 (n=4 mice). Data shown as mean±SEM. Two-way ANOVA and Tukey’s multiple comparisons test were performed. e. Schematic illustration for analysis of the tumor cell colonization in the lungs of SA mice engineered to re-express CXCL1 by intranasally delivered adenoviruses. f. Representative flow cytometry analysis of neutrophils (above) and quantification of the percent of neutrophils (below) in the lung tissues of SA mice as described in e. Quantitative data shown as mean±SEM (n=4 mice for Adctrl group, n=5 for AdCXCL1 group). Two-tailed Unpaired t test was performed for the comparison. g. Representative flow cytometry analysis of TdTomato+ tumor cells (above) and the quantification (below) in the lung tissues of SA mice as described in e. Quantitative data shown as mean±SEM (n=4 mice for Adctrl group, n=5 mice for AdCXCL1 group). Two-tailed Unpaired t test was performed for the comparison. h. Representative lung images and the corresponding H&E-stained lung sections of SA mice as described in e. Scale bar: 1 mm. Similar results were obtained from three independent experiments. i. Quantification of metastatic lesion area in the lung tissues of SA mice as shown in h. Data shown as mean±SEM (n=4 mice per group). Two-tailed Unpaired t test was performed for the comparison.
Figure 6.
Figure 6.. Tumor-derived factors-induced p38α-dependent expression of FAP in the lungs plays a key role in the generation of the pre-metastatic niche.
a. qPCR analysis of indicated chemokines mRNA levels in the lung fibroblasts (from indicated mice) at 6 hr after SFM or B16F10 TCM treatment in vitro. Data shown as mean±SEM (n=5 biologically independent samples). Two-way ANOVA and Tukey’s multiple comparisons test were performed. b. ChIP analysis of H3K9me3 binding to the Cxcl1 promoter in the isolated WT and SA lung fibroblasts treated with SFM or B16F10 TCM for 12 hr. Data shown as mean±SEM (n=4 independent experiments). Two-way ANOVA and Sidak’s multiple comparisons test were performed. c. A representative immunofluorescence staining of FAP (left) and quantification of FAP+ cells (right) in the lung tissues of WT and SA mice treated with SFM, or B16F10 TCM (100 μl i.v., 3x per week for 3 weeks). Scale bar: 100 μm. Quantitative data shown as mean±SEM (n=5 mice per group). Two-way ANOVA and Sidak’s multiple comparisons test were performed. d. A representative immunofluorescence staining of FAP (left) and quantification of FAP+ cells (right) in the lung tissues of indicated mice treated with SFM, or B16F10 TCM (100 μl i.v., 3x per week for 3 weeks). Scale bar: 100 μm. Quantitative data shown as mean±SEM (n=4 mice per group). Two-way ANOVA and Tukey’s multiple comparisons test were performed. e. A representative immunofluorescence staining of fibronectin (left) and quantification of fibronectin level (right) in the lung tissues from WT and Fap−/− mice treated with SFM or B16F10 TCM (100 μl i.v., 3x per week for 3 weeks). Scale bar: 100 μm. Quantitative data shown as mean±SEM (n=5 mice per group). Two-way ANOVA and Sidak’s multiple comparisons test were performed. f. qPCR analysis of mRNA levels of the indicated chemokines in the lung tissues of WT and Fap−/− mice treated with SFM or B16F10 TCM (100 μl i.v., 3x per week for 3 weeks). Data shown as mean±SEM (n=3 mice per group). Two-way ANOVA and Sidak’s multiple comparisons test were performed. g. Representative flow cytometry analysis of neutrophils (left) and quantification of their percent (right) in the lung tissues of WT and Fap−/− mice treated with SFM or B16F10 TCM (100 μl i.v., 3x per week for 3 weeks). Quantitative data shown as mean±SEM (n=3 mice per group). Two-way ANOVA and Sidak’s multiple comparisons test were performed. h. qPCR analysis of mRNA levels of the indicated chemokines in the lung fibroblasts isolated from WT, FapS624A knock-in and knockout Fap−/− mice 6 hr after SFM or B16F10 TCM treatment with or without adding FAP extracellular domain (FAPECD, 0.3 μg/ml). Data shown as mean±SEM (n=6, n=4, n=3 biological independent samples in SFM/TCM treated WT and Fap−/− cells, SFM treated FapS624A cells, TCM treated FapS624A cells and FAPECD treated Fap−/− cells respectively). Two-way ANOVA and Tukey’s multiple comparisons test were performed.
Figure 7.
Figure 7.. P38α deficiency specifically in fibroblasts impairs the generation of pre-metastatic niche in the lung.
a. A representative immunofluorescence staining of FAP (left) and quantification of FAP level (right) in the lung tissues of tamoxifen-treated Mapk14fl/flCol1a2-CreER- (Mapk14fl/fl) and Mapk14fl/flCol1a2-CreER+ (Mapk14ΔFib, p38α knock out specifically in fibroblasts) mice injected with SFM, B16F10 TCM, or MH6499c4 TCM (100 μl i.v., 3x per week for 3 weeks). Scale bar: 100 μm. Quantitative data shown as mean±SEM (n=6 mice for SFM and B16F10 TCM treated group, n=5 mice for MH6499c4 TCM treated group). Two-way ANOVA and Tukey’s multiple comparisons test were performed. b. A representative immunofluorescence staining of fibronectin (left) and quantification of fibronectin level (right) in the lung tissues of Mapk14fl/fl and Mapk14ΔFib mice injected with SFM, B16F10 TCM, or MH6499c4 TCM (100 μl i.v., 3x per week for 3 weeks). Scale bar: 100 μm. Quantitative data shown as mean±SEM (n=6 mice for SFM and B16F10 TCM treated group, n=5 mice for MH6499c4 TCM treated group). Two-way ANOVA and Tukey’s multiple comparisons test were performed. c. qPCR analysis of mRNA levels of the indicated chemokines and niche genes in the lung tissues of Mapk14fl/fl and Mapk14ΔFib mice injected with SFM, B16F10 TCM, or MH6499c4 TCM (100 μl i.v., 3x per week for 3 weeks). Data shown as mean±SEM (n=6 mice for SFM treated group, n=5 mice for B16F10 and MH6499c4 TCM treated group). Two-way ANOVA and Tukey’s multiple comparisons test were performed. d. The percent (left) and the absolute number of neutrophils (right) analyzed by flow cytometry in the lung tissues of Mapk14fl/fl and Mapk14ΔFib mice injected with SFM, B16F10 TCM, or MH6499c4 TCM (100 μl i.v., 3x per week for 3 weeks). Data shown as mean±SEM (n=6 mice for SFM and B16F10 TCM treated group, n=5 mice for MH6499c4 TCM treated group). Two-way ANOVA and Tukey’s multiple comparisons test were performed. e. The percent of tumor cells (TdTomato+ cells) analyzed by flow cytometry in the lung tissues of Mapk14fl/fl and Mapk14ΔFib mice injected with SFM, B16F10 TCM, or MH6499c4 TCM (100 μl i.v., 3x per week for 3 weeks) followed by intravenous injection of 5*105 B16F10-TdTomato cells. Data shown as mean±SEM (n=4 mice for SFM treated group, n=5 mice for B16F10 and MH6499c4 TCM treated group). Two-way ANOVA and Tukey’s multiple comparisons test were performed. f. Representative lung images and the corresponding H&E-stained lung sections of Mapk14fl/fl and Mapk14ΔFib mice injected with SFM, B16F10 TCM, or MH6499c4 TCM (100 μl i.v., 3x per week for 3 weeks) followed by intravenous injection of 5*105 B16F10-TdTomato cells. Scale bar: 1 mm. Similar results were obtained from three independent experiments. g. Quantification of metastatic lesion area in the lung sections of indicated mice as shown in f. Data shown as mean±SEM (n=6 mice for SFM treated group, n=5 mice for B16F10 and MH6499c4 TCM treated group). Two-way ANOVA and Tukey’s multiple comparisons test were performed.
Figure 8.
Figure 8.. P38α deficiency specifically in fibroblasts attenuates lung metastasis and p38 inhibitors show efficient adjuvant therapeutic effects.
a. Representative lung images and the corresponding H&E-stained lung sections from the tamoxifen treated Ifnar1fl/flCol1a2-CreER- (Ifnar1fl/fl) and Ifnar1fl/flCol1a2CreER+ (Ifnar1ΔFib, IFNAR1 knock out specific in fibroblasts) mice after intravenous injection with B16F10 tumor cells (2×10⁵/mouse). Scale bar: 1 mm. Similar results were obtained from three independent experiments. b. Quantification of the number of metastatic lesions and total area in the lung tissues of Ifnar1fl/fl (n=8) and Ifnar1ΔFib (n=7) mice after B16F10 tumor cells injection as shown in a. Data shown as mean±SEM. Two-tailed Unpaired t test was performed for the comparison. c. Representative lung images and the corresponding H&E-stained lung sections from the tamoxifen-treated B16F10 tumor bearing Mapk14fl/fl and Mapk14ΔFib mice after primary tumor removal at equivalent size (~200 mm2). Scale bar: 1 mm. Similar results were obtained from three independent experiments. d. Quantification of the number of metastatic lesions and total area in the lung tissues of Mapk14fl/fl (n=11) and Mapk14ΔFib mice (n=10) after surgery as shown in c. Data shown as mean±SEM. Two-tailed Unpaired t test was performed for the comparison. e. Kaplan-Meier analysis of survival of B16F10 tumor bearing Mapk14fl/fl (n=13) and Mapk14ΔFib (n=11) mice after surgery by Log-rank test. f. Schematic illustration for analysis of the effect of p38 inhibitors Ralimetinib (LY) or SB203580 (SB) as neoadjuvant/adjuvant therapeutic agents. g. Representative lung images and the corresponding H&E-stained lung sections in the mice after surgery as described in f. Scale bar: 1 mm. Similar results were obtained from three independent experiments. h. Quantification of the number of metastatic lesions and total area in the lung tissues of the mice after surgery as shown in g. Data shown as mean±SEM (n=8 mice in Vehicle group, n=10 mice in LY group, n=6 mice in SB group). Two-tailed Unpaired t test was performed for the comparison. i. Kaplan-Meier analysis of survival of B16F10 tumor bearing mice after surgery as described in f by Log-rank test. Groups included 9 mice for “Vehicle” and “LY” and 7 mice for ““SB”. j. A model highlighting the key role of p38α kinase and downstream activation of FAP in the generation of the pre-metastatic niche in lung.

Comment in

References

    1. Joyce JA & Pollard JW Microenvironmental regulation of metastasis. Nat Rev Cancer 9, 239–252 (2009). - PMC - PubMed
    1. Kaplan RN, et al. VEGFR1-positive haematopoietic bone marrow progenitors initiate the pre-metastatic niche. Nature 438, 820–827 (2005). - PMC - PubMed
    1. Peinado H, Lavotshkin S & Lyden D The secreted factors responsible for pre-metastatic niche formation: old sayings and new thoughts. Semin Cancer Biol 21, 139–146 (2011). - PubMed
    1. Peinado H, et al. Pre-metastatic niches: organ-specific homes for metastases. Nat Rev Cancer 17, 302–317 (2017). - PubMed
    1. Francia G, Cruz-Munoz W, Man S, Xu P & Kerbel RS Mouse models of advanced spontaneous metastasis for experimental therapeutics. Nat Rev Cancer 11, 135–141 (2011). - PMC - PubMed

Publication types

Substances