Comparative Study
. 2021 Nov;31(6):1874-1885.
doi: 10.1111/ina.12875. Epub 2021 Jun 14.

Comparison of three air samplers for the collection of four nebulized respiratory viruses - Collection of respiratory viruses from air

Affiliations
Comparative Study

Comparison of three air samplers for the collection of four nebulized respiratory viruses - Collection of respiratory viruses from air

Jasmin S Kutter et al. Indoor Air. 2021 Nov.

Abstract

Viral respiratory tract infections are a leading cause of morbidity and mortality worldwide. Unfortunately, the transmission routes and shedding kinetics of respiratory viruses remain poorly understood. Air sampling techniques to quantify infectious viruses in the air are indispensable to improve intervention strategies to control and prevent spreading of respiratory viruses. Here, the collection of infectious virus with the six-stage Andersen cascade impactor was optimized with semi-solid gelatin as collection surface. Subsequently, the collection efficiency of the cascade impactor, the SKC BioSampler, and an in-house developed electrostatic precipitator was compared. In an in vitro set-up, influenza A virus, human metapneumovirus, parainfluenza virus type 3, and respiratory syncytial virus were nebulized and the amount of collected infectious virus and viral RNA was quantified with each air sampler. Whereas only low amounts of virus were collected using the electrostatic precipitator, high amounts were collected with the BioSampler and cascade impactor. The BioSampler allowed straight-forward sampling in liquid medium, whereas the more laborious cascade impactor allowed size fractionation of virus-containing particles. Depending on the research question, either the BioSampler or the cascade impactor can be applied in laboratory and field settings, such as hospitals to gain more insight into the transmission routes of respiratory viruses.

Keywords: air sampling; collection efficiency; electrostatic precipitator; impactor; impinger.


Conflict of interest statement

The authors declare no competing interests.

Figures

FIGURE 1
FIGURE 1
The different samplers that were compared in this study (A) Six‐stage Andersen cascade impactor. Aerosols and droplets are collected from the air according to their size in 10 cm dishes filled with semi‐solid gelatin, agar, or VTM. An accurate jet‐to‐plate distance is important to ensure a correct size fractionation. (B) SKC BioSampler (all‐glass impinger). Air is drawn in and accelerated in the three nozzles. Particles are subsequently collected into swirling VTM by impingement. (C) Electrostatic precipitator. Inside a box, air is drawn into a glass chamber in which air is ionized. Cations bind to the particles and drag aerosols and droplets to the bottom reservoir which is filled with VTM. Orange arrows indicate airflow. Blue spheres indicate aerosols and droplets of different sizes.
FIGURE 2
FIGURE 2
Schematic representation of the nebulizer control and experimental air sampling set‐up. (A) Virus suspensions were directly nebulized into 15 ml VTM in a T75 cell culture flask. (B) Virus suspensions were nebulized (1) to generate aerosols and droplets containing virus particles in an air‐tight chamber (3), which was connected via a tube (4) to an air sampler (5). A second tube (6) was placed between the air sampler and a vacuum pump (8) that was placed outside the BSL II cabinet. High‐efficiency particulate air (HEPA) filters (2,7) were installed on both sides of the air sampling set‐up to guarantee that clean air entered the box and to prevent contamination of the environment. The direction of airflow is indicated with orange arrows. The flow rate through the system equals the recommended flow rate of the different samplers. For each experiment, nebulized viruses were collected from the chamber with air samplers for 5 min
FIGURE 3
FIGURE 3
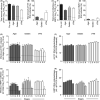
Evaluation of different collection media for the cascade impactor. pH1N1 virus and HMPV were collected on agar, semi‐solid gelatin, or VTM to compare the collection efficiency of the cascade impactor with each medium. For both viruses and the different collection media, the total amount of collected infectious virus (A and C) and viral RNA (B and D), as well as the distribution of the amount of infectious virus (E and G) and viral RNA (F and H) over the six stages, is shown. Dotted lines indicate the detection limit of the virus titrations. Bars represent mean values of 3 experiments. Error bars indicate SD of 3 experiments
FIGURE 4
FIGURE 4
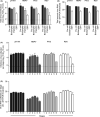
Performance of all air samplers with different respiratory viruses. To compare the performance of the three air samplers, pH1N1 virus, HMPV, PIV3, and RSV were each nebulized and collected with the BioSampler, cascade impactor (with semi‐solid gelatin), and electrostatic precipitator. For all viruses, the amount of collected infectious virus (A and C) and viral RNA (B and D) is shown for each air sampler. Dotted lines indicate the detection limit of the virus titrations. Bars represent mean values of 3 experiments. Error bars indicate SD of 3 experiments
FIGURE 5
FIGURE 5
Collection efficiency of the BioSampler and cascade impactor for diluted virus stocks. 105.7 and 103.7 TCID50 of pH1N1 virus (A) and HMPV (B) were nebulized and the total amount of infectious virus was determined by virus titration. Dotted lines indicate the detection limit of virus titrations. Bars represent mean values of 3 experiments. Error bars indicate SD of 3 experiments

References

    1. World Health Organization . The top 10 causes of death. 2019. https://www.who.int/news‐room/fact‐sheets/detail/the‐top‐10‐causes‐of‐death. Accessed January 12, 2021.
    1. Shi T, McAllister DA, O'Brien KL, et al. Global, regional, and national disease burden estimates of acute lower respiratory infections due to respiratory syncytial virus in young children in 2015: a systematic review and modelling study. Lancet. 2017;390:946‐958. - PMC - PubMed
    1. Shi T, Arnott A, Semogas I, et al. The etiological role of common respiratory viruses in acute respiratory infections in older adults: a systematic review and meta‐analysis. J Infect Dis. 2020;222:S563‐S569. - PMC - PubMed
    1. Troeger C, Blacker B, Khalil IA, et al. Estimates of the global, regional, and national morbidity, mortality, and aetiologies of lower respiratory infections in 195 countries, 1990–2016: a systematic analysis for the Global Burden of Disease Study 2016. Lancet Infect Dis. 2018;18:1191‐1210. - PMC - PubMed
    1. Kutter JS, Spronken MI, Fraaij PL, Fouchier RA, Herfst S. Transmission routes of respiratory viruses among humans. Curr Opin Virol. 2018;28:142‐151. - PMC - PubMed

Publication types

MeSH terms