. 2021 Sep 1;175(9):e211573.
doi: 10.1001/jamapediatrics.2021.1573. Epub 2021 Sep 7.

Association Between Childhood Consumption of Ultraprocessed Food and Adiposity Trajectories in the Avon Longitudinal Study of Parents and Children Birth Cohort

Affiliations

Association Between Childhood Consumption of Ultraprocessed Food and Adiposity Trajectories in the Avon Longitudinal Study of Parents and Children Birth Cohort

Kiara Chang et al. JAMA Pediatr. .

Abstract

Importance: Reports of associations between higher consumption of ultraprocessed foods (UPF) and elevated risks of obesity, noncommunicable diseases, and mortality in adults are increasing. However, associations of UPF consumption with long-term adiposity trajectories have never been investigated in children.

Objective: To assess longitudinal associations between UPF consumption and adiposity trajectories from childhood to early adulthood.

Design, setting, and participants: This prospective birth cohort study included children who participated in the Avon Longitudinal Study of Parents and Children (ALSPAC) in Avon County, southwest England. Children were followed up from 7 to 24 years of age during the study period from September 1, 1998, to October 31, 2017. Data were analyzed from March 1, 2020, to January 31, 2021.

Exposures: Baseline dietary intake data were collected using 3-day food diaries. Consumption of UPF (applying the NOVA food classification system) was computed as a percentage of weight contribution in the total daily food intake for each participant and categorized into quintiles.

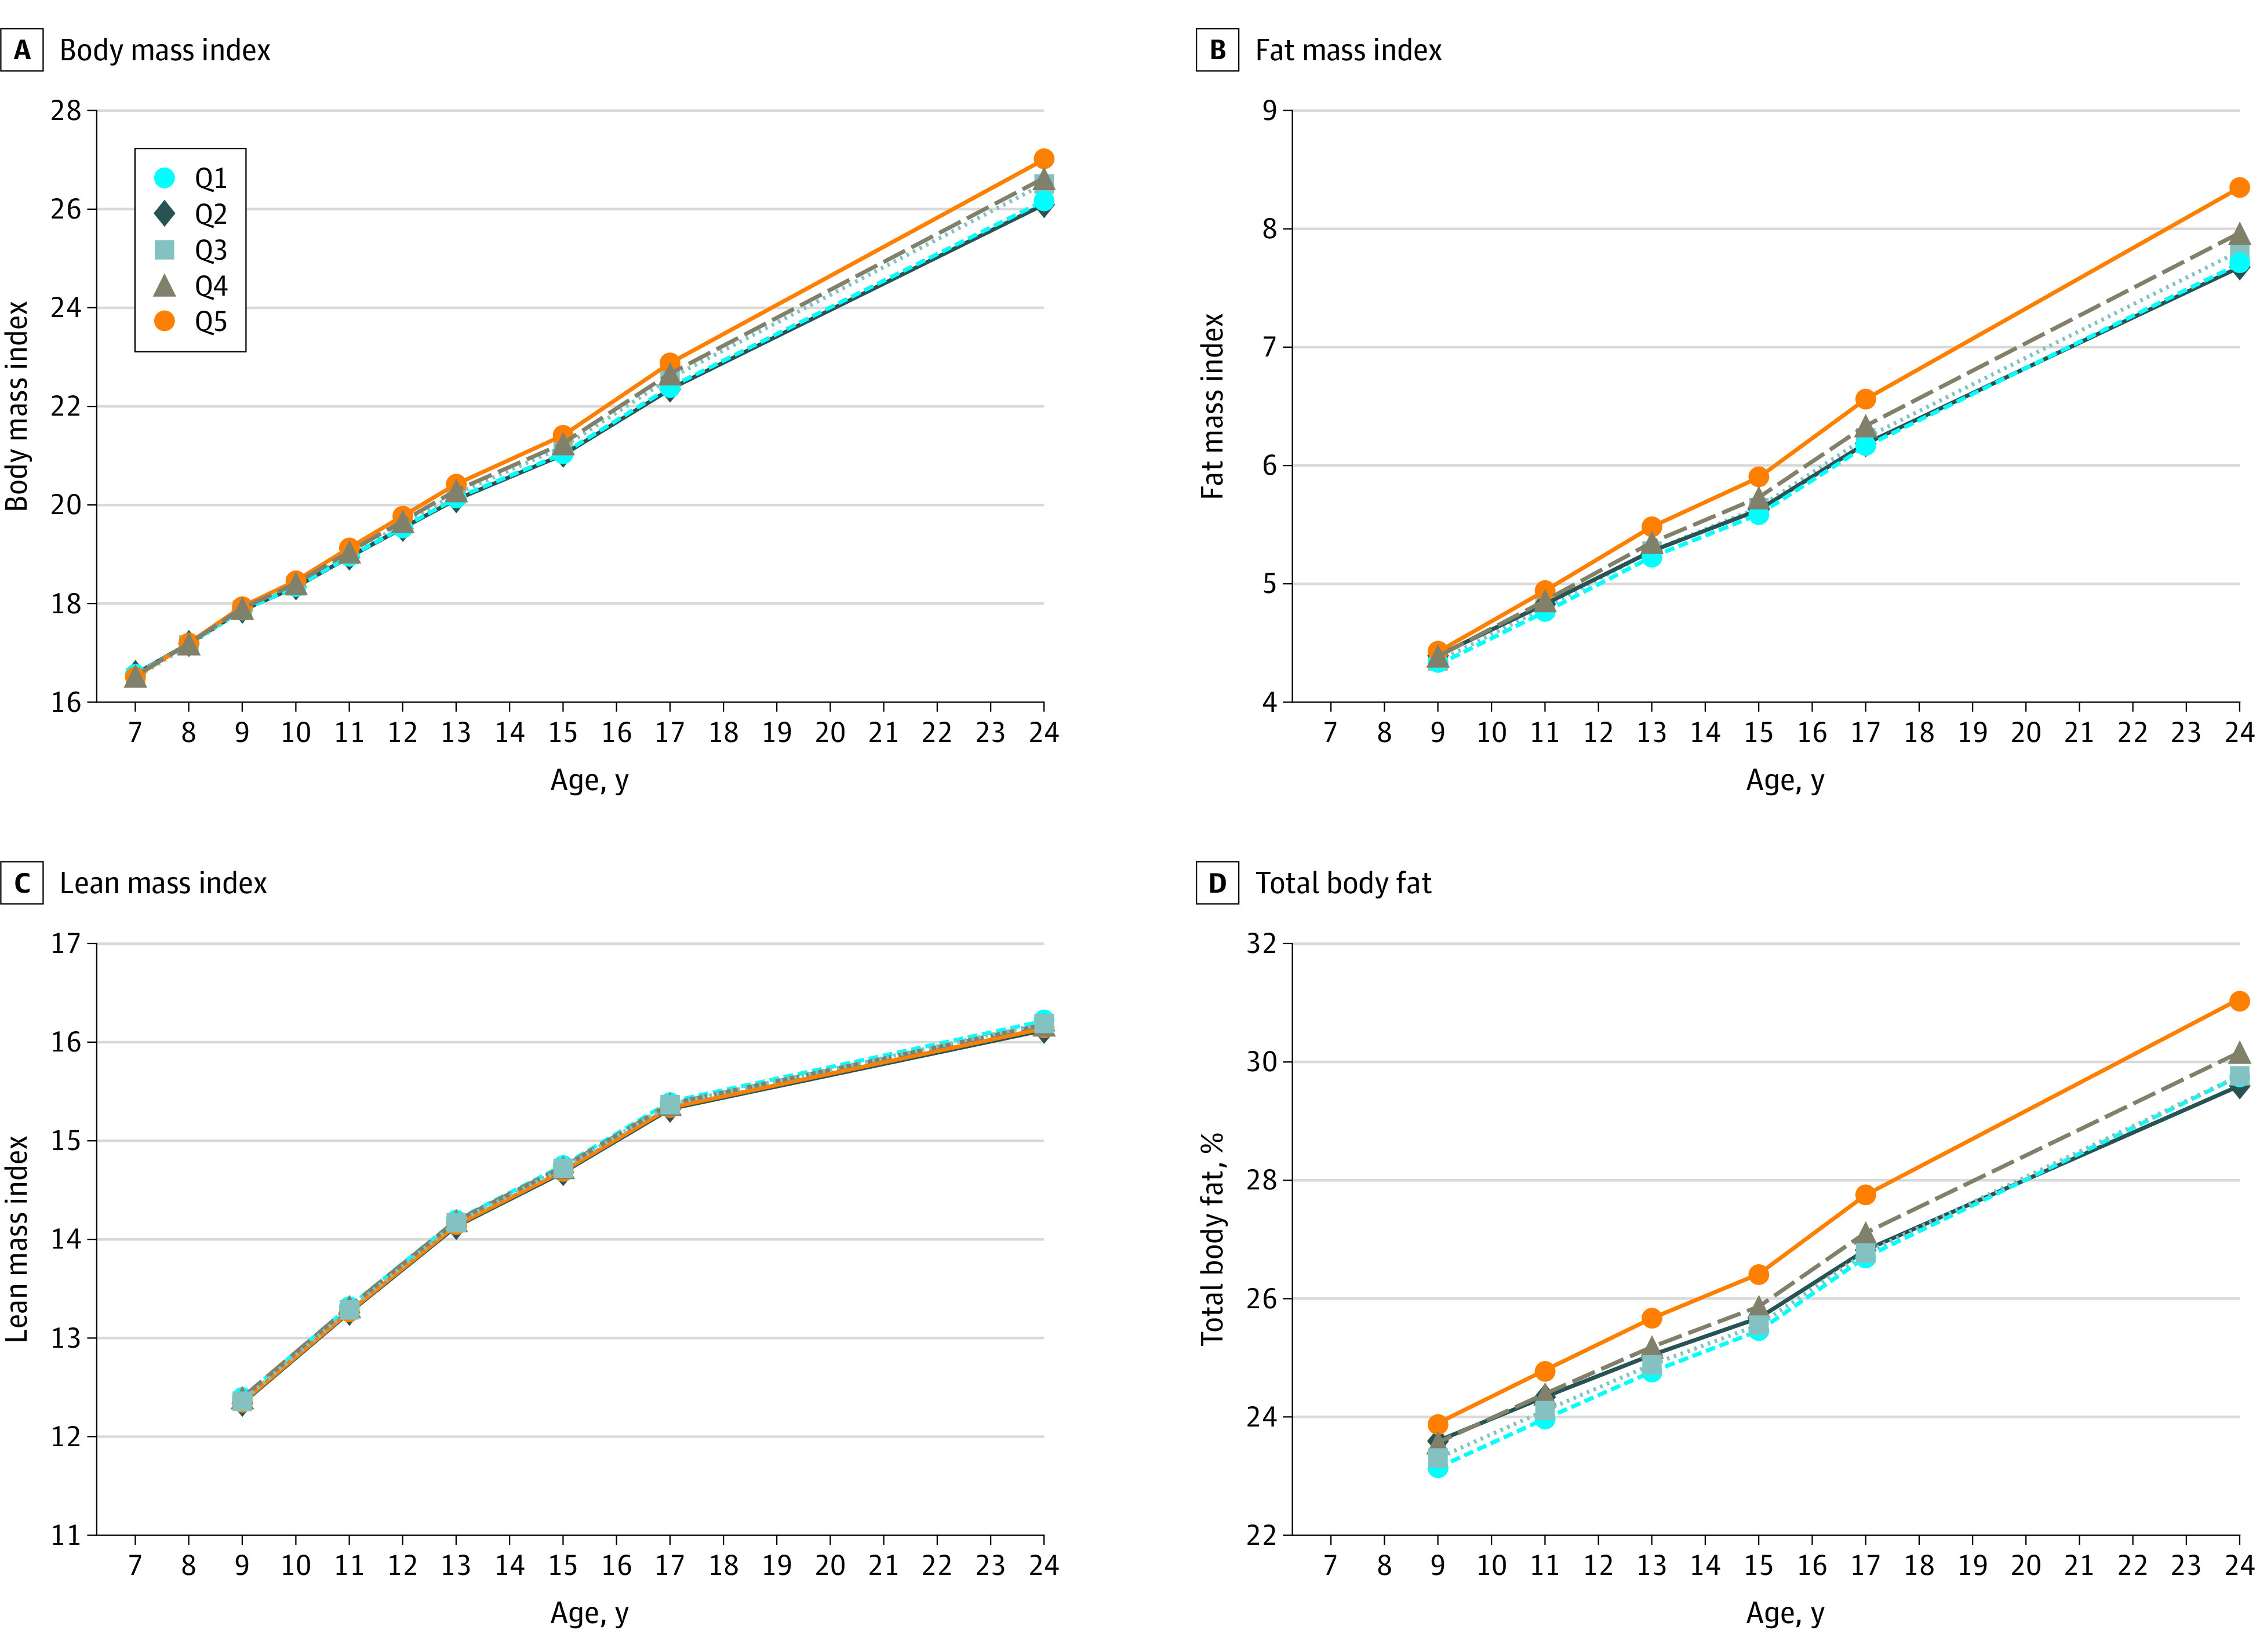
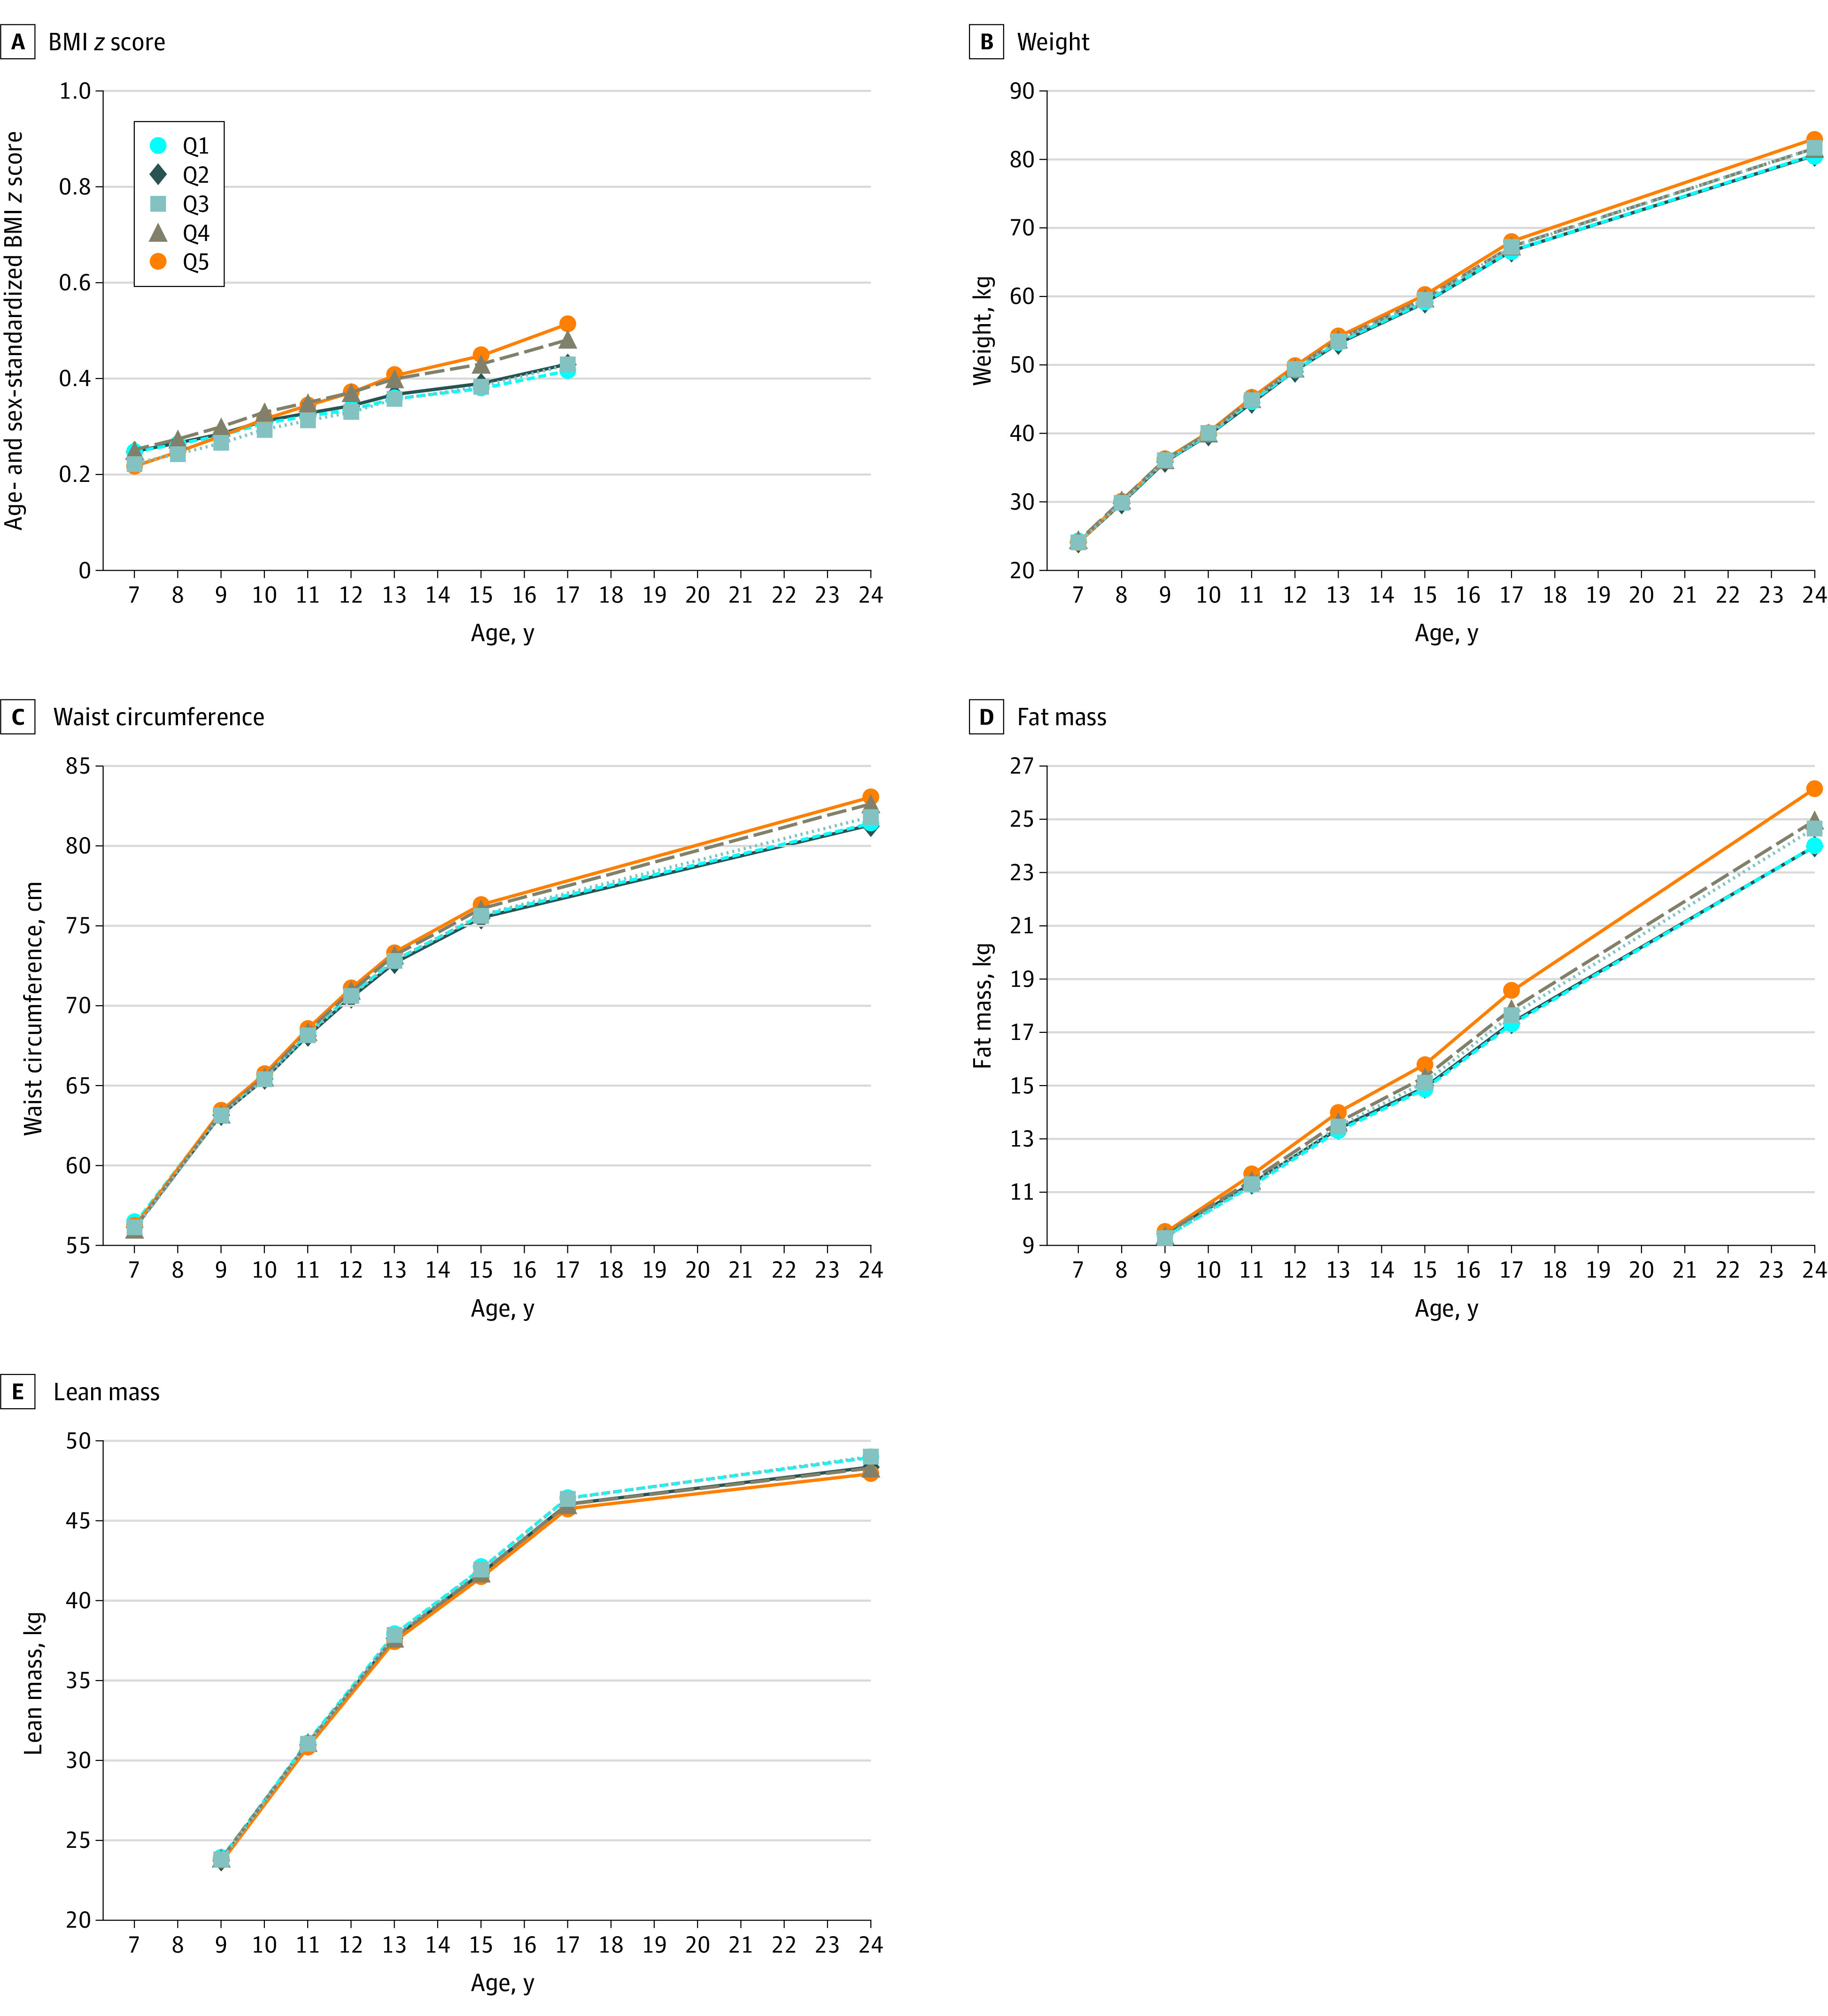
Main outcomes and measures: Repeated recordings of objectively assessed anthropometrics (body mass index [BMI; calculated as weight in kilograms divided by height in meters squared], weight, and waist circumference) and dual-energy x-ray absorptiometry measurements (fat and lean mass indexes [calculated as fat and lean mass, respectively, divided by height in meters squared] and body fat percentage). Associations were evaluated using linear growth curve models and were adjusted for study covariates.

Results: A total of 9025 children (4481 [49.7%] female and 4544 [50.3%] male) were followed up for a median of 10.2 (interquartile range, 5.2-16.4) years. The mean (SD) UPF consumption at baseline was 23.2% (5.0%) in quintile 1, 34.7% (2.5%) in quintile 2, 43.4% (2.5%) in quintile 3, 52.7% (2.8%) in quintile 4, and 67.8% (8.1%) in quintile 5. Among those in the highest quintile of UPF consumption compared with their lowest quintile counterpart, trajectories of BMI increased by an additional 0.06 (95% CI, 0.04-0.08) per year; fat mass index, by an additional 0.03 (95% CI, 0.01-0.05) per year; weight, by an additional 0.20 (95% CI, 0.11-0.28) kg per year; and waist circumference, by an additional 0.17 (95% CI, 0.11-0.22) cm per year.

Conclusions and relevance: These findings suggest that higher UPF consumption is associated with greater increases in adiposity from childhood to early adulthood. Robust public health measures that promote minimally processed foods and discourage UPF consumption among children are urgently needed to reduce obesity in England and globally.


Conflict of interest statement

Conflict of Interest Disclosures: None reported.

Figures

Figure 1.
Figure 1.. Trajectories of Primary Outcomes by Baseline Quintile of Ultraprocessed Food (UPF) Consumption
Data are from 9025 children who participated in the Avon Longitudinal Study of Parents and Children. Percentage of daily food intake contributed by UPFs at baseline was categorized into quintiles (Q1-Q5, lowest to highest quintile of UPF consumption). Trajectories were plotted for the values estimated from the growth curve models at each age (wave) of clinical assessment. All linear growth models were fitted with individualized random intercept and random slope using age (and quadratic age for lean mass index outcome) as the underlying timescale and included baseline UPF quintile and an interaction term between age and baseline UPF quintile. Models were further adjusted for the child’s sex (male or female), race (White or non-White), birth weight (<2500, 2500-3999, or ≥4000 g), physical activity (moderate to vigorous physical activity per day ≥60 minutes or otherwise), quintiles of Index of Multiple Deprivation; the mother’s prepregnancy body mass index (BMI; calculated as weight in kilograms divided by height in square meters) (<18.5, 18.5-24.9, 25.0-29.9, or ≥30.0), marital status (single or married/living with partner), highest educational attainment (Certificate of Secondary Education or none, vocational, O level, A level, or degree or above), socioeconomic status based on UK National Statistics Socioeconomic Classification (higher managerial, administrative, and professional; intermediate; or routine and manual occupation); and the child’s total energy intake (continuous) at baseline. Baseline refers to 7 years of age for BMI and 9 years of age for fat or lean mass index (calculated as fat and lean mass, respectively, divided by height in meters squared), and percentage of body fat percentage outcomes.
Figure 2.
Figure 2.. Trajectories of Secondary Outcomes by Baseline Quintile of Ultraprocessed Food (UPF) Consumption
Data are from 9025 children who participated in the Avon Longitudinal Study of Parents and Children. Percentage of daily food intake contributed by UPFs at baseline was further categorized into quintiles (Q1-Q5, lowest to highest quintile of UPF consumption). Trajectories were plotted for the values estimated from the growth curve models at each age (wave) of clinic assessment. All linear growth models were fitted with individualized random intercept and random slope using age (and quadratic age for weight, waist circumference, and lean mass outcomes) as the underlying timescale and included baseline UPF quintile and an interaction term between age and baseline UPF quintile. Models were further adjusted for the child’s sex (male or female), race (White or non-White), birth weight (<2500, 2500-3999, or ≥4000 g), physical activity (moderate to vigorous physical activity per day ≥60 minutes or otherwise), quintiles of Index of Multiple Deprivation; the mother’s prepregnancy body mass index (BMI; calculated as weight in kilograms divided by height in square meters) (<18.5, 18.5-24.9, 25.0-29.9, or ≥30.0), marital status (single or married/living with partner), highest educational attainment (Certificate of Secondary Education or none, vocational, O level, A level, or degree or above), socioeconomic status based on UK National Statistics Socioeconomic Classification (higher managerial, administrative, and professional; intermediate; or routine and manual occupation); and the child’s total energy intake (continuous) at baseline. Baseline refers to BMI z score, weight, and waist circumference outcomes at 7 years of age and fat and lean mass and percentage of body fat outcomes at 9 years of age.

References

    1. Hall KD, Ayuketah A, Brychta R, et al. . Ultra-processed diets cause excess calorie intake and weight gain: an inpatient randomized controlled trial of ad libitum food intake. Cell Metab. 2019;30(1):67-77.e3. doi:10.1016/j.cmet.2019.05.008 - DOI - PMC - PubMed
    1. Rauber F, Chang K, Vamos EP, et al. . Ultra-processed food consumption and risk of obesity: a prospective cohort study of UK Biobank. Eur J Nutr. 2020;1-12. - PMC - PubMed
    1. Beslay M, Srour B, Méjean C, et al. . Ultra-processed food intake in association with BMI change and risk of overweight and obesity: a prospective analysis of the French NutriNet-Santé cohort. PLoS Med. 2020;17(8):e1003256. doi:10.1371/journal.pmed.1003256 - DOI - PMC - PubMed
    1. Srour B, Fezeu LK, Kesse-Guyot E, et al. . Ultraprocessed food consumption and risk of type 2 diabetes among participants of the NutriNet-Santé prospective cohort. JAMA Intern Med. 2020;180(2):283-291. doi:10.1001/jamainternmed.2019.5942 - DOI - PMC - PubMed
    1. Levy RB, Rauber F, Chang K, et al. . Ultra-processed food consumption and type 2 diabetes incidence: a prospective cohort study. Clin Nutr. 2020;S0261-5614(20)30693-2. doi:10.1016/j.clnu.2020.12.018 - DOI - PubMed

Publication types