. 2021 Sep 30;72(18):6570-6580.
doi: 10.1093/jxb/erab277.

Plant neighbour-modulated susceptibility to pathogens in intraspecific mixtures

Affiliations

Plant neighbour-modulated susceptibility to pathogens in intraspecific mixtures

Rémi Pélissier et al. J Exp Bot. .

Abstract

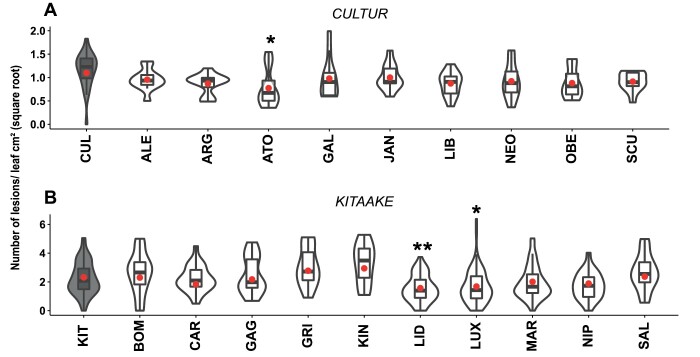
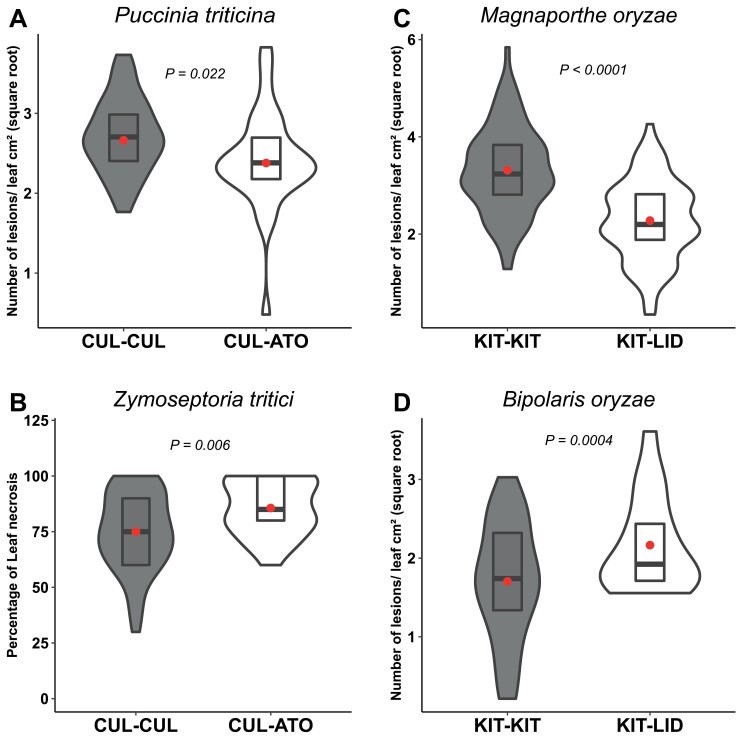
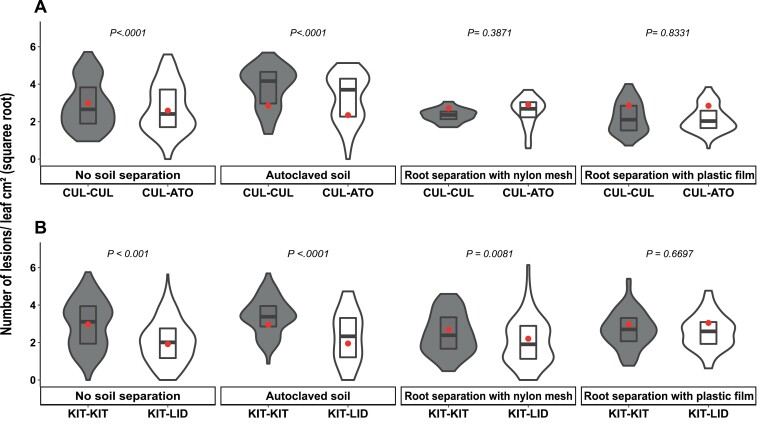
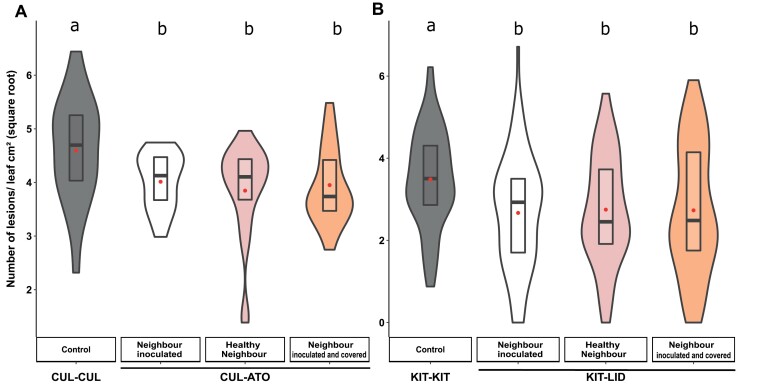
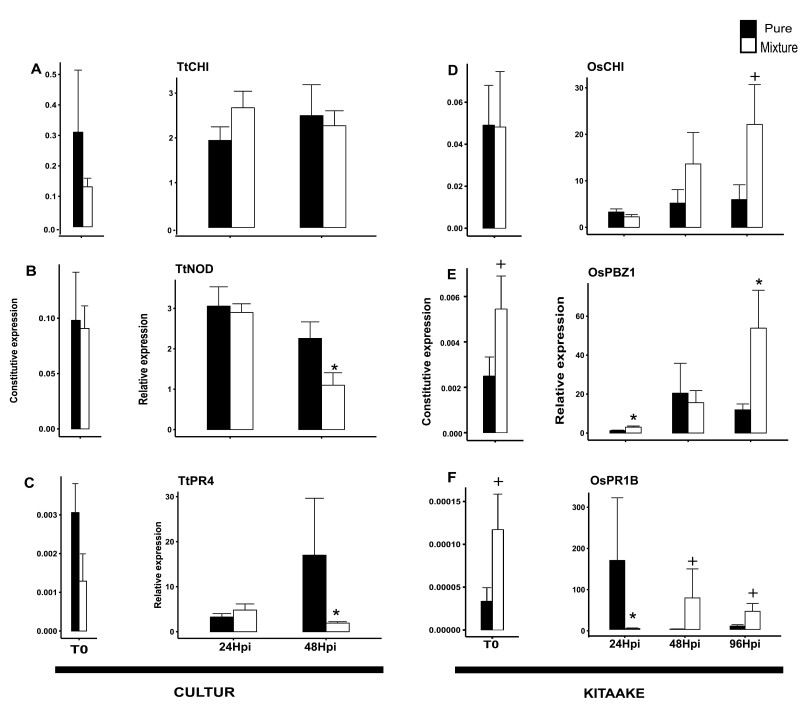
As part of a trend towards diversifying cultivated areas, varietal mixtures are subject to renewed interest as a means to manage diseases. Besides the epidemiological effects of varietal mixtures on pathogen propagation, little is known about the effect of intraspecific plant-plant interactions and their impact on responses to disease. In this study, genotypes of rice (Oryza sativa) or durum wheat (Triticum turgidum) were grown with different conspecific neighbours and manually inoculated under conditions preventing pathogen propagation. Disease susceptibility was measured together with the expression of basal immunity genes as part of the response to intra-specific neighbours. The results showed that in many cases for both rice and wheat susceptibility to pathogens and immunity was modified by the presence of intraspecific neighbours. This phenomenon, which we term 'neighbour-modulated susceptibility' (NMS), could be caused by the production of below-ground signals and does not require the neighbours to be infected. Our results suggest that the mechanisms responsible for reducing disease in varietal mixtures in the field need to be re-examined.

Keywords: Oryza sativa; Triticum turgidum; Disease; immunity; intraspecific mixture; neighbour; plant–plant interactions; rice; wheat.


Figures

Fig. 1.
Fig. 1.
Disease susceptibility of durum wheat and rice in intraspecific mixtures. (A) Plants of the wheat genotype Cultur (CUL) and (B) the temperate japonica rice genotype Kitaake (KIT) were grown with neighbours of the same genotype (grey shading, ‘pure’ condition) or of a conspecific genotype (white shading, mixture), and the plants were inoculated with Puccinia triticina (leaf rust disease) for wheat and Magnaporthe oryzae (blast disease) for rice (see Methods). For genotype abbreviations see Supplementary Tables S2 and S3. Susceptibility was measured as the number of lesions cm–2 of leaf area on the CUL and rice KIT focal plants (data are square-root transformed). The violin plots represent at least n=42 plants for rice and n=36 plants for wheat. The red dots represent the least-square means as determined using a linear model. For wheat, each combination was performed eight times in three separate experiments, and for rice, each combination was performed 12 times in three separate experiments. Significant differences compared with the ‘pure’ control were determined using ANOVA of the linear model followed by Dunnett’s tests: *P<0.05; **P<0.01.
Fig. 2.
Fig. 2.
Impact of conspecific mixtures of durum wheat and rice genotypes on disease susceptibility to different fungal pathogens. (A, C) Plants of the wheat genotype Cultur were grown either with itself (CUL-CUL, ‘pure’ condition) or with the genotype Atoudur (CUL-ATO), and (B, D) plants of the temperate japonica rice genotype Kitaake were grown either with itself (KIT-KIT, ‘pure’) or with the genotype Lido (KIT-LID). The plants were inoculated with the fungal pathogens as indicated (see Methods). Puccinia triticina is a biotrophic fungus whlist Zymoseptoria tritici, Magnaporthe oryzae, and Biopolris oryzae are all hemibiotrophic. All measurements were made on the CUL and KIT focal plants. Susceptibility was measured as the number of lesions cm–2 of leaf area (data are square-root transformed), except for Z. tritici were it was measured as percentage of leaf necrosis. The violin plots represent at least n=42 plants for rice and n=36 plants for wheat. The red dots represent the least-square means as determined using a linear model. The data represent at least three experiments of four and six replicates for wheat and rice, respectively. Significant differences were determined using ANOVA followed by Dunnett’s tests of the linear model. The corresponding data with ATO and LID as the focal plants are given in Supplementary Fig. S5.
Fig. 3.
Fig. 3.
Effects of soil sterilization and root separation on disease susceptibility of durum wheat and rice genotypes grown in different conspecific mixtures. (A) Plants of the wheat genotype Cultur were grown either with itself (CUL-CUL, ‘pure’ condition) or with the genotype Atoudur (CUL-ATO) and were inoculated with Puccinia triticina. (B) Plants of the temperate japonica rice genotype Kitaake were grown either with itself (KIT-KIT, ‘pure’) or with the genotype Lido (KIT-LID) and inoculated with Magnaporthe oryzae. Susceptibility was measured as the number of lesions cm–2 of leaf area on the CUL and rice KIT focal plants (data are square-root transformed). The plants were grown in normal soil without any root separation, in autoclaved soil without any root separation, in normal soil with roots separated by a porous nylon mesh, and in normal soil with roots separated by a non-porous plastic film (see Methods). The violin plots represent at least n=42 plants for rice and n=36 plants for wheat. The red dots represent the least-square means as determined using a linear model. For wheat, each combination was performed eight times in three separate experiments, and for rice, each combination was performed 12 times in three separate experiments. Significant differences were determined using ANOVA of the linear model followed by Dunnett’s tests.
Fig. 4.
Fig. 4.
Effects of healthy and diseased neighbours on disease susceptibility of durum wheat and rice genotypes grown in different conspecific mixtures. (A) Plants of the wheat genotype Cultur were grown either with itself (CUL-CUL, ‘pure’ condition) or with the genotype Atoudur (CUL-ATO) and were inoculated with Puccinia triticina. (B) Plants of the temperate japonica rice genotype Kitaake were grown either with itself (KIT-KIT, ‘pure’) or with the genotype Lido (KIT-LID) and inoculated with Magnaporthe oryzae. Susceptibility was measured as the number of lesions cm–2 of leaf area on the CUL and rice KIT focal plants (data are square-root transformed). In each case, plants were also grown with inoculated neighbours that were covered to limit aerial contact (see Methods). The violin plots represent at least n=42 plants for rice and n=36 plants for wheat. The red dots represent the least-square means as determined using a linear model. For wheat, each combination was performed eight times in three separate experiments, and for rice, each combination was performed 12 times in three separate experiments. Different letters indicate significant differences as determined using ANOVA followed by Tukey’s HSD tests of the linear model (P<0.05).
Fig. 5.
Fig. 5.
Expression of immunity-related genes in response to fungal pathogens in durum wheat and rice genotypes grown in different conspecific mixtures. (A–C) Plants of the wheat genotype Cultur were grown either with itself ( ‘pure’ condition) or with the genotype Atoudur (mixture) and were inoculated with Puccinia triticina. (D–F) Plants of the temperate japonica rice genotype Kitaake were grown either with itself (‘pure’) or with the genotype Lido (mixture) and inoculated with Magnaporthe oryzae. The ‘pure’ condition and the mixtures are as indicated in the key. Tt, durum wheat (Triticum turgidum); Os, rice (Oryza sativa). Gene expression was measured in leaves before infection (T0) and at 24 h post-inoculation (hpi) and 48 hpi for wheat, and at 24, 48, and 96 hpi for rice. Expression was determined by RT-qPCR and normalized using the actin and ubiquitin genes for rice and wheat, respectively. The constitutive expression is shown for T0, and for the subsequent time-points expression is relative to that at T0 (i.e. ratio of inoculated/non-inoculated). Data are means (SE) of at least n=6 replicates. Significant differences between the ‘pure’ conditions and the mixtures were determined using Wilcoxon tests: +P<0.1; *P<0.05. The corresponding data with Atoudur and Lido as the focal plants are given in Supplementary Fig. S6.

References

    1. Ali S, Ganai BA, Kamili AN, et al. . 2018. Pathogenesis-related proteins and peptides as promising tools for engineering plants with multiple stress tolerance. Microbiological Research 212–213, 29–37. - PubMed
    1. Ballaré CL, Pierik R. 2017. The shade-avoidance syndrome: multiple signals and ecological consequences. Plant, Cell & Environment 40, 2530–2543. - PubMed
    1. Ballini E, Tavaud M, Ducasse A, et al. . 2020. Genome wide association mapping for resistance to multiple fungal pathogens in a panel issued from a broad composite cross-population of tetraploid wheat Triticum turgidum. Euphytica 216, 92.
    1. Barot S, Allard V, Cantarel A, Enjalbert J, Gauffreteau A, Goldringer I, Lata J-C, Le Roux X, Niboyet A, Porcher E. 2017. Designing mixtures of varieties for multifunctional agriculture with the help of ecology. A review. Agronomy for Sustainable Development 37, 13.
    1. Berruyer R, Adreit H, Milazzo J, Gaillard S, Berger A, Dioh W, Lebrun MH, Tharreau D. 2003. Identification and fine mapping of Pi33, the rice resistance gene corresponding to the Magnaporthe grisea avirulence gene ACE1. Theoretical and Applied Genetics 107, 1139–1147. - PubMed

Publication types