. 2021 Dec;150(1-3):195-211.
doi: 10.1007/s11120-021-00853-z. Epub 2021 Jun 14.

Electron and proton transport in wheat exposed to salt stress: is the increase of the thylakoid membrane proton conductivity responsible for decreasing the photosynthetic activity in sensitive genotypes?

Affiliations

Electron and proton transport in wheat exposed to salt stress: is the increase of the thylakoid membrane proton conductivity responsible for decreasing the photosynthetic activity in sensitive genotypes?

Ulkar Ibrahimova et al. Photosynth Res. 2021 Dec.

Abstract

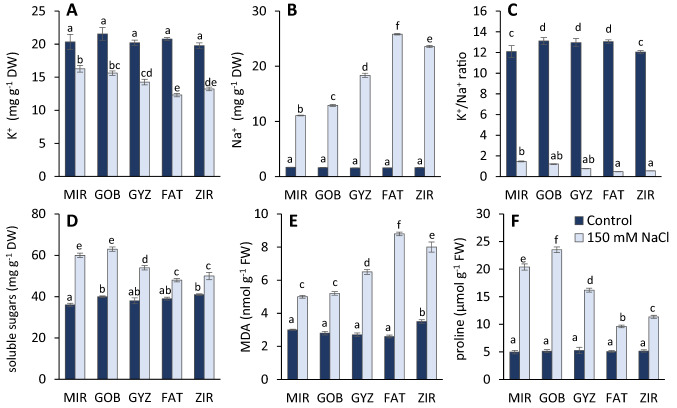
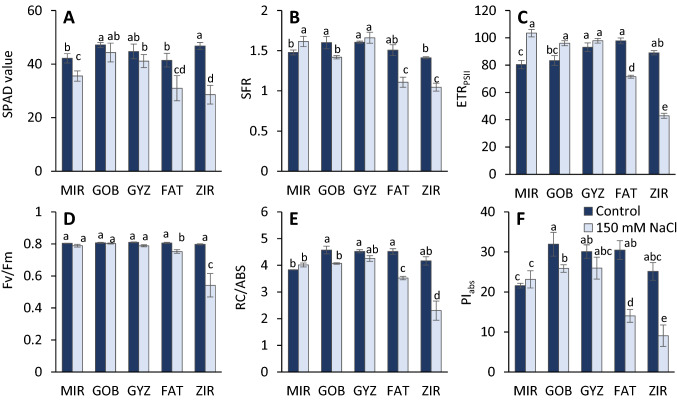
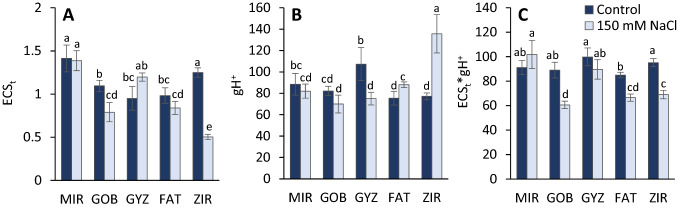
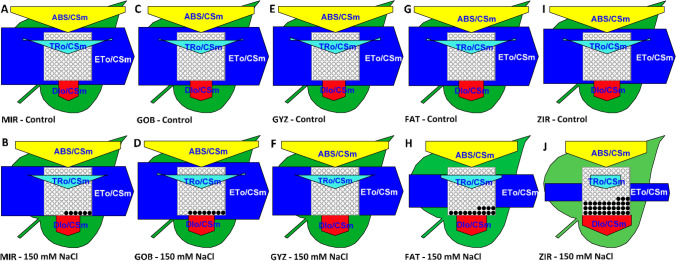
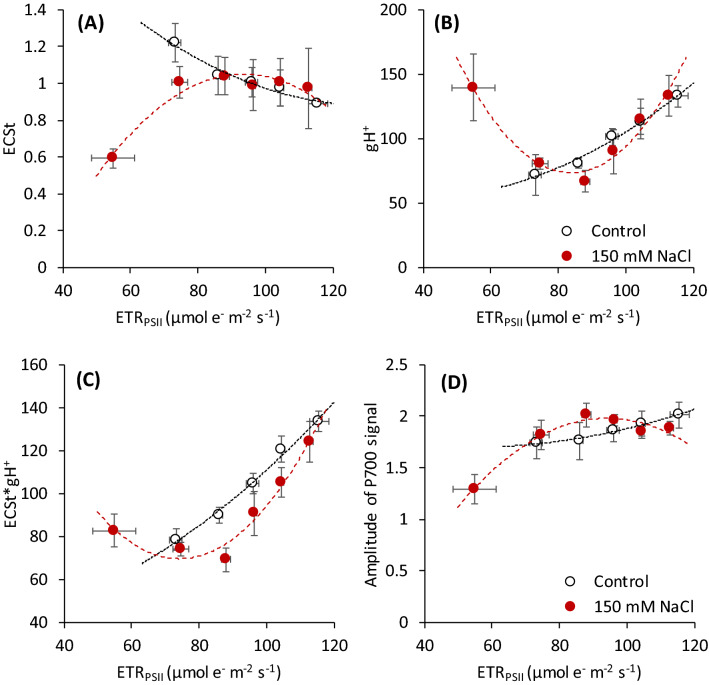
Effects of salinity caused by 150 mM NaCl on primary photochemical reactions and some physiological and biochemical parameters (K+/Na+ ratio, soluble sugars, proline, MDA) have been studied in five Triticum aestivum L. genotypes with contrasting salt tolerance. It was found that 150 mM NaCl significantly decreased the photosynthetic efficiency of two sensitive genotypes. The K+/Na+ ratio decreased in all genotypes exposed to salinity stress when compared with the control. Salinity stress also caused lipid peroxidation and accumulation of soluble sugars and proline. The amounts of soluble sugars and proline were higher in tolerant genotypes than sensitive ones, and lipid peroxidation was higher in sensitive genotypes. The noninvasive measurements of photosynthesis-related parameters indicated the genotype-dependent effects of salinity stress on the photosynthetic apparatus. The significant decrease of chlorophyll content (SPAD values) or adverse effects on photosynthetic functions at the PSII level (measured by the chlorophyll fluorescence parameters) were observed in the two sensitive genotypes only. Although the information obtained by different fast noninvasive techniques were consistent, the correlation analyses identified the highest correlation of the noninvasive records with MDA, K+/Na+ ratio, and free proline content. The lower correlation levels were found for chlorophyll content (SPAD) and Fv/Fm values derived from chlorophyll fluorescence. Performance index (PIabs) derived from fast fluorescence kinetics, and F735/F685 ratio correlated well with MDA and Na+ content. The most promising were the results of linear electron flow measured by MultispeQ sensor, in which we found a highly significant correlation with all parameters assessed. Moreover, the noninvasive simultaneous measurements of chlorophyll fluorescence and electrochromic band shift using this sensor indicated the apparent proton leakage at the thylakoid membranes resulting in a high proton conductivity (gH+), present in sensitive genotypes only. The possible consequences for the photosynthetic functions and the photoprotection are discussed.

Keywords: Chlorophyll fluorescence; Noninvasive measurements; Salt stress; Wheat.


Figures

Fig. 1
Fig. 1
Effect of salinity on potassium (K+) content (A), sodium (Na+) content (B), K+/Na+ ratio (C), soluble sugars (D), MDA content (E), and proline content (F) in different wheat genotypes (MIR Mirbashir 128, GOB Gobustan, GYZ Gyzyl Bughda, FAT Fatima, ZIR Zirva 80). All data are presented as the mean value ± standard error (SE). Data in columns with the different letters are significantly different according to Duncan's multiple range test at P = 0.05
Fig. 2
Fig. 2
Effect of salinity on the values of parameters derived from noninvasive measurements of leaf absorbance and fluorescence: chlorophyll content measured in SPAD values (A), fluorescence ratio F735/F685 derived from multispectral fluorescence records (B), rate of linear electron transport calculated from the fluorescence quenching analysis in the light-adapted state (C), the maximum quantum yield of PSII photochemistry (D), reaction centers per absorbed light unit: RC/ABS (E), and Performance Index: PIabs (F) derived from the analysis of fast fluorescence kinetics in dark-adapted leaves of different wheat genotypes (MIR Mirbashir 128, GOB Gobustan, GYZ Gyzyl Bughda, FAT Fatima, ZIR Zirva 80). All data are presented as the mean value ± standard error (SE). Data in columns with the different letters are significantly different according to Duncan's multiple range test at P = 0.05
Fig. 3
Fig. 3
Effect of salinity on the values of parameters derived from noninvasive measurements of the dark interval relaxation kinetics (DIRK) of leaf absorbance signal at 520 nm (electrochromic bandshift): maximum amplitude of ECS signal: ECSt (A), proton conductance of chloroplast ATP synthase: gH+ (B), estimated proton flux through thylakoid lumen calculated as a product of ECSt and gH+: ECSt * gH+ (C). The parameters were derived from the data obtained by the measurements in light-adapted leaves of different wheat genotypes (MIR Mirbashir 128, GOB Gobustan, GYZ Gyzyl Bughda, FAT Fatima, ZIR Zirva 80). All data are presented as the mean value ± standard error (SE). Data in columns with the different letters are significantly different according to Duncan's multiple range test at P = 0.05
Fig. 4
Fig. 4
Phenomenological leaf models based on calculations of parameters derived from the analysis of fast fluorescence kinetics in dark-adapted leaves of different wheat genotypes (MIR Mirbashir 128, GOB Gobustan, GYZ Gyzyl Bughda, FAT Fatima, ZIR Zirva 80) in non-stressed (Control) and salt-stressed (150 mM NaCl) variants. The thickness of each arrow represents the mean value of absorbance (ABS/CSm), trapping flux (TR/CSm), electron transport (ET/CSm), or heat dissipation of excess light (DI/CSm), all expressed per leaf cross-section. The black points represent the fraction of inactive reaction centers. The models were generated using software Biolyzer 3.06 (Maldonado-Rodriguez, Laboratory of Bioenergetics, University of Geneva, Switzerland)
Fig. 5
Fig. 5
Relationship between the mean values of PSII electron transport rate (ETRPSII) and the parameters related to the proton transport and PSI activity analyzed simultaneously by the multisensor MultispeQ V2.0 (PhotosynQ, USA) in non-stressed (Control) and salt-stressed (150 mM NaCl) wheat plants. (A) The maximum amplitude of absorbance at 520 nm (ECS signal) measured with the far-red pulse and saturating light pulse, (B) proton conductivity of the thylakoid membrane through ATP synthase (gH+), (C) the proton flux estimated as a product of ECSt and gH+, and (D) the amplitude of P700 signal measured as an absorbance signal at 820 nm. Data originate from the entire tested collection of wheat genotypes. The points represent the mean values of the samples in two variants sorted according to the ETRPSII values into the six separate groups. The samples with very low ETRPSII values (< 60 µmol e m−2 s−1) were present only in the salt-stress variant. Data are presented as the mean value ± standard error (SE) from 10 to 20 leaves

References

    1. Ahmad P, Kumar A, Ashraf M, Akram NA. Salt-induced changes in photosynthetic activity and oxidative defense system of three cultivars of mustard (Brassica juncea L.) Afr J Biotechnol. 2012;11(11):2694–2703.
    1. Allakhverdiev SI, Nishiyama Y, Suzuki I, Tasaka Y, Murata N. Genetic engineering of the unsaturation of fatty acids in membrane lipids alters the tolerance of Synechocystis to salt stress. Proc Natl Acad Sci USA. 1999;96(10):5862–5867. doi: 10.1073/pnas.96.10.5862. - DOI - PMC - PubMed
    1. Allen S, Grimshaw H, Rowland A. Chemical analysis. In: Chapman SB, Moore PD, editors. Methods in plant ecology. Oxford: Blackwell Scientific Publications; 1986.
    1. Almeida DM, Oliveira MM, Saibo NJM. Regulation of Na+ and K+ homeostasis in plants: towards improved salt stress tolerance in crop plants. Genet Mol Biol. 2017;40(1 suppl 1):326–345. doi: 10.1590/1678-4685-gmb-2016-0106. - DOI - PMC - PubMed
    1. Arif MR, Islam MT, Robin AHK. Salinity stress alters root morphology and root hair traits in Brassica napus. Plants. 2019;8(7):192. doi: 10.3390/plants8070192. - DOI - PMC - PubMed