. 2021 Jun 14;17(6):e1009647.
doi: 10.1371/journal.ppat.1009647. eCollection 2021 Jun.

Sustained viremia suppression by SHIVSF162P3CN-recalled effector-memory CD8+ T cells after PD1-based vaccination

Affiliations

Sustained viremia suppression by SHIVSF162P3CN-recalled effector-memory CD8+ T cells after PD1-based vaccination

Yik Chun Wong et al. PLoS Pathog. .

Abstract

HIV-1 functional cure requires sustained viral suppression without antiretroviral therapy. While effector-memory CD8+ T lymphocytes are essential for viremia control, few vaccines elicit such cellular immunity that could be potently recalled upon viral infection. Here, we investigated a program death-1 (PD1)-based vaccine by fusion of simian immunodeficiency virus capsid antigen to soluble PD1. Homologous vaccinations suppressed setpoint viremia to undetectable levels in vaccinated macaques following a high-dose intravenous challenge by the pathogenic SHIVSF162P3CN. Poly-functional effector-memory CD8+ T cells were not only induced after vaccination, but were also recalled upon viral challenge for viremia control as determined by CD8 depletion. Vaccine-induced effector memory CD8+ subsets displayed high cytotoxicity-related genes by single-cell analysis. Vaccinees with sustained viremia suppression for over two years responded to boost vaccination without viral rebound. These results demonstrated that PD1-based vaccine-induced effector-memory CD8+ T cells were recalled by AIDS virus infection, providing a potential immunotherapy for functional cure.


Conflict of interest statement

I have read the journal’s policy and the authors of this manuscript have the following competing interests: Z.C. is a co-inventor on the PD1-based vaccine patent. However, ZC and all other authors do not have any competing interests or additional financial interests.

Figures

Fig 1
Fig 1. Immunogenicity of RhPD1-based vaccines in mice.
(A) Schematic of DNA vaccination in mice. C57BL/6 mice were immunized with the empty pVAX vector, pGag, pRhPD1-Gag or pRhPD1-p27 via intramuscular injection with 3 consecutive electroporation in 3-week intervals. Immunological analysis was performed at 2 weeks or 6 months after the last immunization. (B)—(E) Acute humoral and cellular immunity induced by sPD1-based vaccines 2 weeks post-last immunization. (B) Anti-Gag antibody titers in sera. (C) Gag-specific cellular immune responses in spleens evaluated by IFN-γ ELISpot assays. (D) Representative FACS plots showing the presence of H-2Db/AL11-specific CD8+ T cells in the spleens of vaccinated mice by tetramer staining analysis. (E) Frequencies of H-2Db/AL11-specific CD8+ T cells in vaccinated mice. (F) The efficacy of the sPD1-based vaccines against recombinant vaccinia virus challenge. Two weeks after last immunization, mice were challenged with recombinant vaccinia virus MVTT-SIVgpe via intranasal route. Viral loads in the lungs were determined two days after challenge. (G)—(I) Memory humoral and cellular immune responses elicited by the sPD1-based vaccines at 6 months post last immunization. (G) Anti-Gag IgG titers in sera. (H) Gag-specific IFN-γ ELISpot responses and (I) the frequencies of H-2Db/AL11-specific CD8+ T cells in spleens.
Fig 2
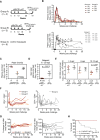
Fig 2. Viral suppression in rhesus macaques immunised with the PD1-based pRhPD1-p27 DNA vaccine after high dose pathogenic SHIVSF162P3CN challenge.
(A) Schematic of DNA vaccination in Chinese-origin rhesus macaques. Two studies with different vaccination durations were conducted. In both studies, Chinese-origin rhesus macaques were immunised with the PD1-based pRhPD1-p27 DNA vaccine via intramuscular injection with electroporation 4 times in 6- to 13-week intervals, followed by intravenous challenge with 5000 TCID50 of SHIVSF162P3CN at 23 or 36 weeks after last immunization. Unvaccinated animals were included as controls. (B) Plasma viral loads of the vaccinated (top) and unvaccinated macaques (below) after SHIV challenge. Animals that were euthanised were marked with †. Anti-CD8β antibody (clone CD8b255R1) was infused into the vaccinated macaques of Group A intravenously at 17 weeks post-challenge, after confirming pVL were below detection levels. Data of this treatment is presented in Fig 5D. (C) Comparison of the peak viremia and (D) geometric means of setpoint viremia determined from 6–20 weeks post-infection (wpi). (E) Proviral DNA loads in PBMC in vaccinated and unvaccinated macaques. Geometric means ± geometric SD are shown in (C)–(E). Significances of differences were determined by the Kruskal-Wallis test followed by the Dunn’s multiple comparisons test (C), or the two-tailed Wilcoxon rank sum test (D and E). (F) The CD4+/CD8+ T cell ratios in vaccinated rhesus macaques from Group A and B (left) or unvaccinated macaques (right) after SHIVSF162P3CN challenge. (G) Changes of body weight of the vaccinated (left) and unvaccinated macaques (right). Animals that were euthanised over the measurement period were marked with †. (H) Survival of vaccinated and unvaccinated macaques after SHIV challenge. The significance of difference was determined by log-rank test.
Fig 3
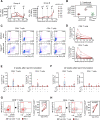
Fig 3. T cell immunogenicity of the pRhPD1-p27 vaccine in rhesus macaques.
(A) Kinetics of p27-specific cellular immune responses in peripheral blood measured by IFN-γ ELISpot. (B) Comparison of ELISpot-detected p27-specific T cell responses induced in Groups A and B by the pRhPD1-p27 vaccine with historical data of Gag-specific T cell responses induced by MVTTSIVgpe/AD5SIVgpe vaccination in Chinese-origin rhesus macaques 12. (C) Representative FACS plots demonstrating the production of IFN-γ, TNF-α and IL-2 by CD8+ (left) and CD4+ T cells (right) at 2 weeks post last immunization, as detected by ICS assays after ex vivo stimulation with the overlapping SIV Gag-p27 peptide pool. (D) Kinetics of p27-specific CD8+ (top) and CD4+ T cells (bottom) in PBMCs after last immunization, as detected by ICS assays. (E) Poly-functionality analysis of p27-specific CD8+ (left) and CD4+ T cell responses (right) at 2 weeks after last immunisation. (F) Poly-functionality analysis of CD8+ (left) and CD4+ T cell responses (right) during memory phase at 22 weeks after last immunisation. For (E) and (F), means ± SEM are shown. (G) Phenotypes of p27-specific CD8+ and (H) CD4+ T cells induced by pRhPD1-p27 vaccination in macaques. PBMC isolated at 8 weeks post last immunisation were stimulated with the overlapping Gag-p27 peptide pool, followed by surface and ICS analysis. Representative FACS plots (left) show the expression of CD95, CD28, and CCR7 on the overall T cell populations (grey) and IFN-γ-producing T cells (red). Frequencies of TEM (CD95+ CD28+or—CCR7-) were compared between the overall and IFN-γ-producing T cells (right). Statistical significance was determined by the Wilcoxon matched-pairs signed rank test.
Fig 4
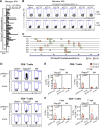
Fig 4. Specificities of the T cell responses induced by the pRhPD1-p27 vaccine.
Representative results of T cell epitope mapping based on the IFN-γ ELISpot and ICS assays on macaque A04 from Group A. (A) PBMC isolated after third/fourth vaccination were stimulated with individual overlapping 15mer peptides spanning the Gag-p27 antigen in IFN-γ ELISpot assays. The dotted line represents the cut-off value. (B) Peptides that successfully induced responses above cut-off values (2x medium alone values) in IFN-γ ELISpot assays were then tested for their ability to induce IFN-γ production in T cells by ICS assays. (C) Epitope mapping analysis of the pRhPD1-p27-vaccinated macaques. CD8+ and CD4+ T cell epitopes are represented by orange and green boxes respectively. (D) Representative ICS FACS plots showing IFN-γ expression in CD8+ (upper) and CD4+ T cells (lower) from pRhPD1-p27-vaccinated or unvaccinated macaques 4 weeks after SHIVSF162P3CN challenge, after ex vivo stimulation with SIV p27 or Nef peptide pools. (E) Frequencies of CD8+ and (F) CD4+ T cells specific to Gag-p27 and Nef antigens at 4 or 17 weeks after SHIVSF162P3CN challenge, as determined by ICS analysis. Means ± SEM are shown. Significance of difference was determined by the two-tailed Wilcoxon rank sum test.
Fig 5
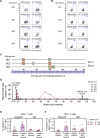
Fig 5. Reactivity of T cell epitopes induced by the pRhPD1-p27 vaccine during SHIVSF162P3CN challenge.
(A) T cell responses against the PD1-based vaccine-induced CD8+ and (B) CD4+ T cell epitopes at 17 weeks after SHIVSF162P3CN challenge. (C) T cell epitope profiles on Gag-p27 of vaccinated macaques in Group B after SHIVSF162P3CN challenge. (D) Long-term pVL monitoring in the vaccinated/challenged macaques from Group A. Anti-CD8β antibody (clone CD8b255R1) was infused into these vaccinated macaques intravenously at 17 weeks post-challenge, after confirming pVL had reduced to undetectable levels. At 103 weeks post-SHIVSF162P3CN challenge, these macaques also received a boost immunisation of the pRhPD1-p27 vaccine via i.m./EP. (E) Frequencies of CD8+ and (F) CD4+ T cells specific to Gag-p27 and Nef antigens 3 weeks after pRhPD1-p27 re-immunization. Means ± SEM are shown.
Fig 6
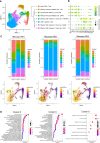
Fig 6. Single-cell RNA sequencing analysis of CD8+ T cells induced by pRhPD1-p27 immunisation.
CD8+ T cell from macaques B01, B02, and B03 in Study B were purified at before, 4 weeks post, and 12 weeks post last immunisation followed by scRNAseq using the 10X scRNAseq platform. (A) UMAP clustering analysis revealed 8 major CD8+ T cell clusters. (B) Expression of different marker genes of the indicated CD8+ T cell clusters. (C) Fractions of different CD8+ T cell clusters at different time points after vaccination (top) and trajectory inference (below) showing the dynamic of cell progression after receiving vaccination of individual macaques. (D) GO analysis of differentially expressed genes of different pathways related to biological process. GeneRatio represents the ratio of the number of genes related to the GO term to the total number of significant genes.

Similar articles

Cited by

References

    1. Katlama C, Deeks SG, Autran B, Martinez-Picado J, van Lunzen J, Rouzioux C, et al.. Barriers to a cure for HIV: new ways to target and eradicate HIV-1 reservoirs. The Lancet. 2013;381(9883):2109–17. doi: 10.1016/S0140-6736(13)60104-X - DOI - PMC - PubMed
    1. Sáez-Cirión A, Lacabaratz C, Lambotte O, Versmisse P, Urrutia A, Boufassa F, et al.. HIV controllers exhibit potent CD8 T cell capacity to suppress HIV infection ex vivo and peculiar cytotoxic T lymphocyte activation phenotype. Proc Natl Acad Sci U S A. 2007;104(16):6776–81. doi: 10.1073/pnas.0611244104 Proceedings of the National Academy of Sciences. - DOI - PMC - PubMed
    1. Betts MR, Nason MC, West SM, De Rosa SC, Migueles SA, Abraham J, et al.. HIV nonprogressors preferentially maintain highly functional HIV-specific CD8+ T cells. Blood. 2006;107(12):4781–9. doi: 10.1182/blood-2005-12-4818 - DOI - PMC - PubMed
    1. Koup RA, Safrit JT, Cao Y, Andrews CA, McLeod G, Borkowsky W, et al.. Temporal association of cellular immune responses with the initial control of viremia in primary human immunodeficiency virus type 1 syndrome. Journal of Virology. 1994;68(7):4650–5. doi: 10.1128/JVI.68.7.4650-4655.1994 - DOI - PMC - PubMed
    1. Borrow P, Lewicki H, Hahn BH, Shaw GM, Oldstone MB. Virus-specific CD8+ cytotoxic T-lymphocyte activity associated with control of viremia in primary human immunodeficiency virus type 1 infection. Journal of Virology. 1994;68(9):6103–10. doi: 10.1128/JVI.68.9.6103-6110.1994 - DOI - PMC - PubMed

Publication types

MeSH terms

Substances