. 2021 Nov 5;219(3):iyab094.
doi: 10.1093/genetics/iyab094.

Revisiting the notion of deleterious sweeps

Affiliations

Revisiting the notion of deleterious sweeps

Parul Johri et al. Genetics. .

Abstract

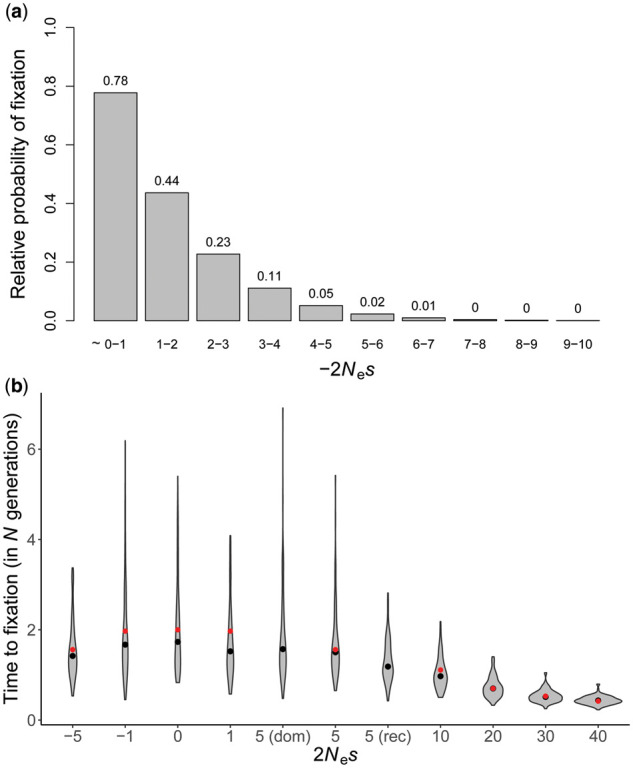
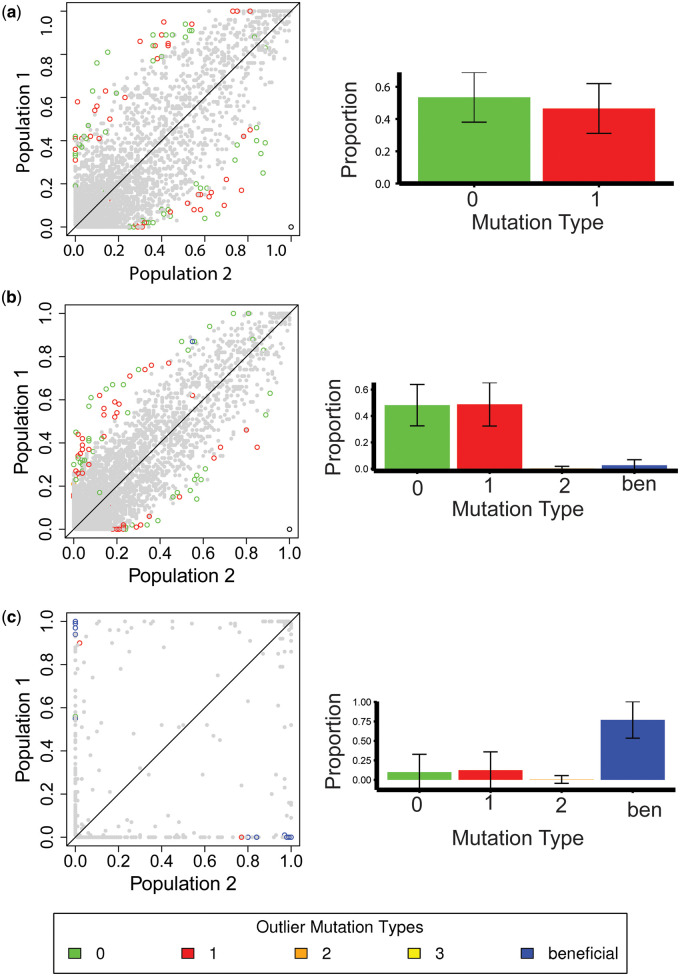
It has previously been shown that, conditional on its fixation, the time to fixation of a semi-dominant deleterious autosomal mutation in a randomly mating population is the same as that of an advantageous mutation. This result implies that deleterious mutations could generate selective sweep-like effects. Although their fixation probabilities greatly differ, the much larger input of deleterious relative to beneficial mutations suggests that this phenomenon could be important. We here examine how the fixation of mildly deleterious mutations affects levels and patterns of polymorphism at linked sites-both in the presence and absence of interference amongst deleterious mutations-and how this class of sites may contribute to divergence between-populations and species. We find that, while deleterious fixations are unlikely to represent a significant proportion of outliers in polymorphism-based genomic scans within populations, minor shifts in the frequencies of deleterious mutations can influence the proportions of private variants and the value of FST after a recent population split. As sites subject to deleterious mutations are necessarily found in functional genomic regions, interpretations in terms of recurrent positive selection may require reconsideration.

Keywords: deleterious mutations; genetic hitchhiking; population genetics; selective sweeps.


Figures

Figure 1
Figure 1
(A) Frequencies of fixations of weakly deleterious mutations relative to those of neutral mutations. (B) The distribution of fixation times (conditional on fixation) of mutations with varying selective effects, obtained from 100 simulated replicates. Fixation times are measured as the time taken for the mutant allele to spread from frequency 1/(2N) to frequency 1. Black solid circles are the means of the distributions obtained from simulations, and red solid circles are the mean expectations obtained by numerically integrating the expression of Kimura and Ohta (1969). The dominance coefficient is 0.5 for all mutations except in the cases “dom” and “rec” where h =1 and 0, respectively.
Figure 2
Figure 2
Recovery of nucleotide diversity per site (π) relative to the mean value in the absence of selection (π0), around a recent fixation (shown at position 0 on the x-axis). The target site has experienced (A) a neutral fixation (2Ns = 0; black lines), (B) a weakly deleterious fixation (2Nsd= 5; red line), and (C) a weakly beneficial fixation (2Nsa = 5; blue line). Solid lines represent mean values of 100 replicates, shaded regions correspond to 1 SE above and 1 SE below the mean. Solid circles show the theoretical predictions using Equation (14) of Charlesworth (2020b); and crosses correspond to simulations based on Equation (27) of Tajima (1990).
Figure 3
Figure 3
Predicted mean reductions of nucleotide diversity at linked neutral sites compared to neutrality (–Δπ), due to recurrent fixations of weakly deleterious semi-dominant mutations with 2.5  2Nsd10 in the presence and absence of gene conversion (GC). Results are shown for regions of varying cross-over (CO) rates of recombination. Nucleotide diversity at neutral sites was averaged across a gene comprised of five 300-bp exons and 100-bp introns, in which all intronic sites and 30% of exonic sites were neutral.
Figure 4
Figure 4
(A) Frequencies of fixation of weakly deleterious mutations relative to that of neutral mutations for different rates of recombination (r), when there is a potential for interference amongst deleterious mutations and BGS effects are accounted for. Red solid circles show the expected probability calculated by Equation (4) integrating over the interval of 2Nesd. (B–G) Effects of sweeps immediately post-fixation for (B–D) Drosophila-like and (E–G) human-like parameters and architecture. Recovery of nucleotide diversity per site (π) is shown relative to the mean intergenic diversity under BGS (π0), around a recent fixation (shown at position 0 on the x-axis). The target site has experienced a weakly deleterious fixation (2Nsd between 1 and 2). Solid lines represent mean values obtained from all substitutions in all replicates, shaded regions correspond to 1 SE above and 1 SE below the mean. Crosses correspond to simulations based on Equation (27) of Tajima (1990) for 2Ns = 0. The extent of BGS in these scenarios is: (B) B =0.81, (C) B =0.79, (D) B =0.67, (E) B =0.87, (F) B =0.85, and (G) B =0.83.
Figure 5
Figure 5
Allele frequencies of SNPs in simulated D. melanogaster population 1 (European) vs population 2 (African), using parameters of the Arguello et al. (2019) model, where the selective effects of all mutations were rescaled with respect to their population sizes after the split (i.e., keeping the strength of selection constant in both populations). Genomic elements experienced (A) purifying selection following the DFE inferred by Johri et al. (2020); (B) the same DFE, but with the addition of 1% beneficial mutations with selective effects between 1 < 2Nsa10; or (C) the same DFE, but with the addition of 1% beneficial mutations with selective effects of 2Nsa=1000. Left panel: Allele frequency plots for 10 (out of 100) replicates simulated. Colored open circles represent FSToutliers when single SNPs are used to calculate FST. Green depicts effectively neutral mutations (belonging to class 0), blue depicts beneficial mutations, and warm colors depict deleterious mutations (belonging to classes 1, 2, and 3), with red representing weakly deleterious mutations. Right panel: The distribution of fitness effects of outlier mutations for the corresponding scenarios, showing the mean and standard deviation for all 100 replicates. Sites that were fixed in both populations for the same allele were not included in this analysis.

References

    1. Andolfatto P. 2005. Adaptive evolution of non-coding DNA in Drosophila. Nature. 437:1149–1152. - PubMed
    1. Andolfatto P. 2007. Hitchhiking effects of recurrent beneficial amino acid substitutions in the Drosophila melanogaster genome. Genome Res. 17:1755–1762. - PMC - PubMed
    1. Arguello JR, Laurent S, Clark AG.. 2019. Demographic history of the human commensal Drosophila melanogaster. Genome Biol Evol. 11:844–854. - PMC - PubMed
    1. Atkinson KE. 1989. Introduction to Numerical Analysis. New York, NY: John Wiley.
    1. Bank C, Ewing GB, Ferrer-Admettla A, Foll M, Jensen JD.. 2014a. Thinking too positive? Revisiting current methods in population genetic selection inference. Trends Genet. 30:540–546. - PubMed

Publication types