Multicenter Study
. 2021 Jun;14(6):e012281.
doi: 10.1161/CIRCIMAGING.120.012281. Epub 2021 Jun 15.

Deep Learning to Predict Cardiac Magnetic Resonance-Derived Left Ventricular Mass and Hypertrophy From 12-Lead ECGs

Affiliations
Multicenter Study

Deep Learning to Predict Cardiac Magnetic Resonance-Derived Left Ventricular Mass and Hypertrophy From 12-Lead ECGs

Shaan Khurshid et al. Circ Cardiovasc Imaging. 2021 Jun.

Abstract

Background: Classical methods for detecting left ventricular (LV) hypertrophy (LVH) using 12-lead ECGs are insensitive. Deep learning models using ECG to infer cardiac magnetic resonance (CMR)-derived LV mass may improve LVH detection.

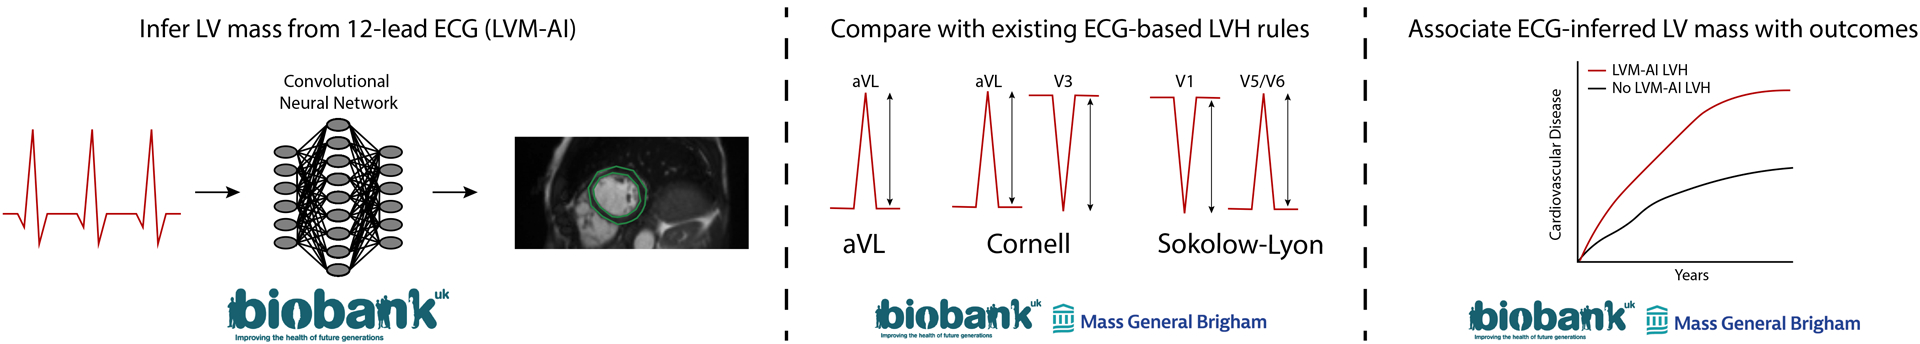
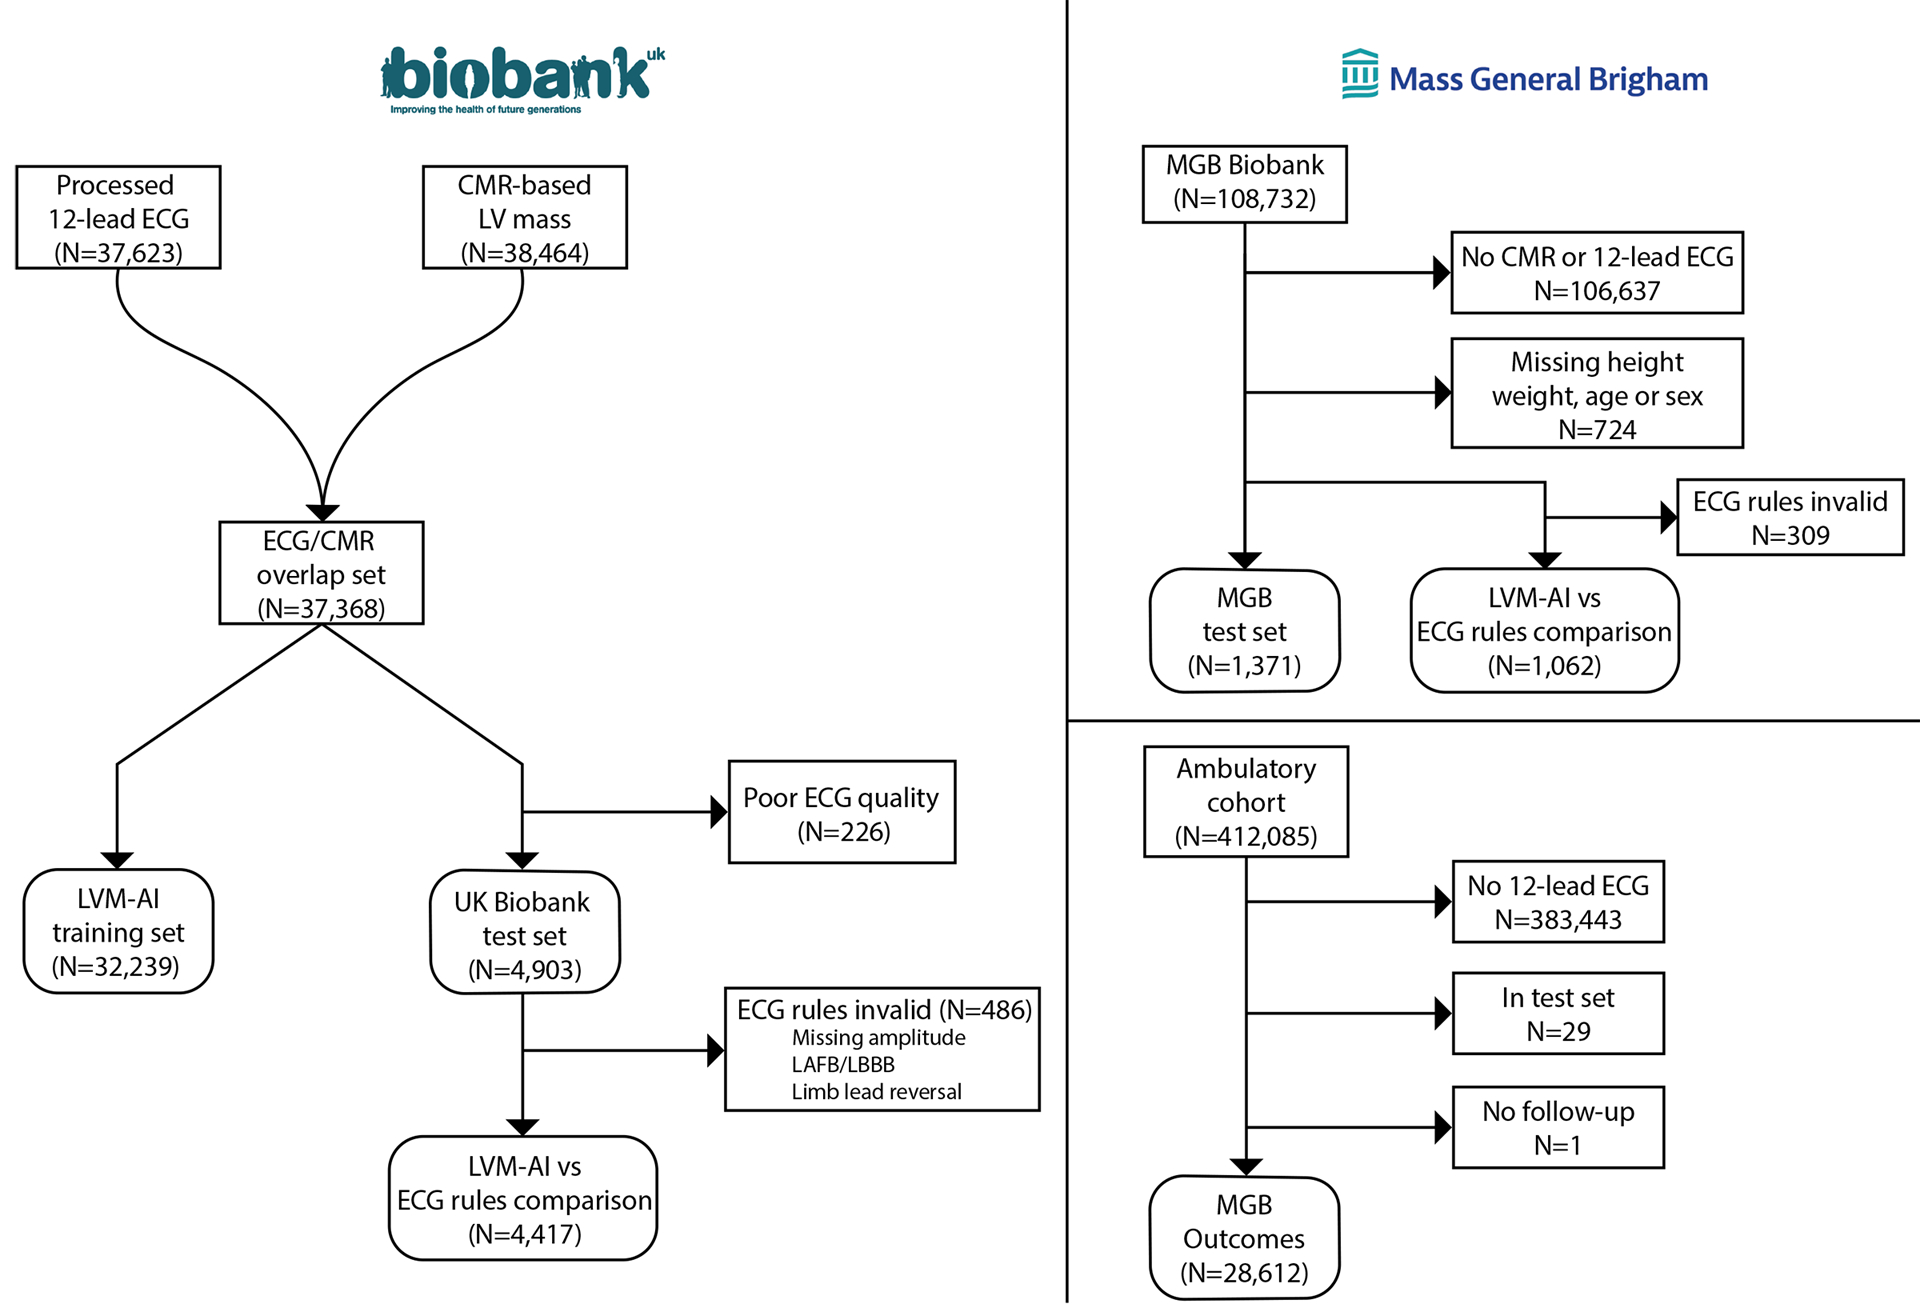
Methods: Within 32 239 individuals of the UK Biobank prospective cohort who underwent CMR and 12-lead ECG, we trained a convolutional neural network to predict CMR-derived LV mass using 12-lead ECGs (left ventricular mass-artificial intelligence [LVM-AI]). In independent test sets (UK Biobank [n=4903] and Mass General Brigham [MGB, n=1371]), we assessed correlation between LVM-AI predicted and CMR-derived LV mass and compared LVH discrimination using LVM-AI versus traditional ECG-based rules (ie, Sokolow-Lyon, Cornell, lead aVL rule, or any ECG rule). In the UK Biobank and an ambulatory MGB cohort (MGB outcomes, n=28 612), we assessed associations between LVM-AI predicted LVH and incident cardiovascular outcomes using age- and sex-adjusted Cox regression.

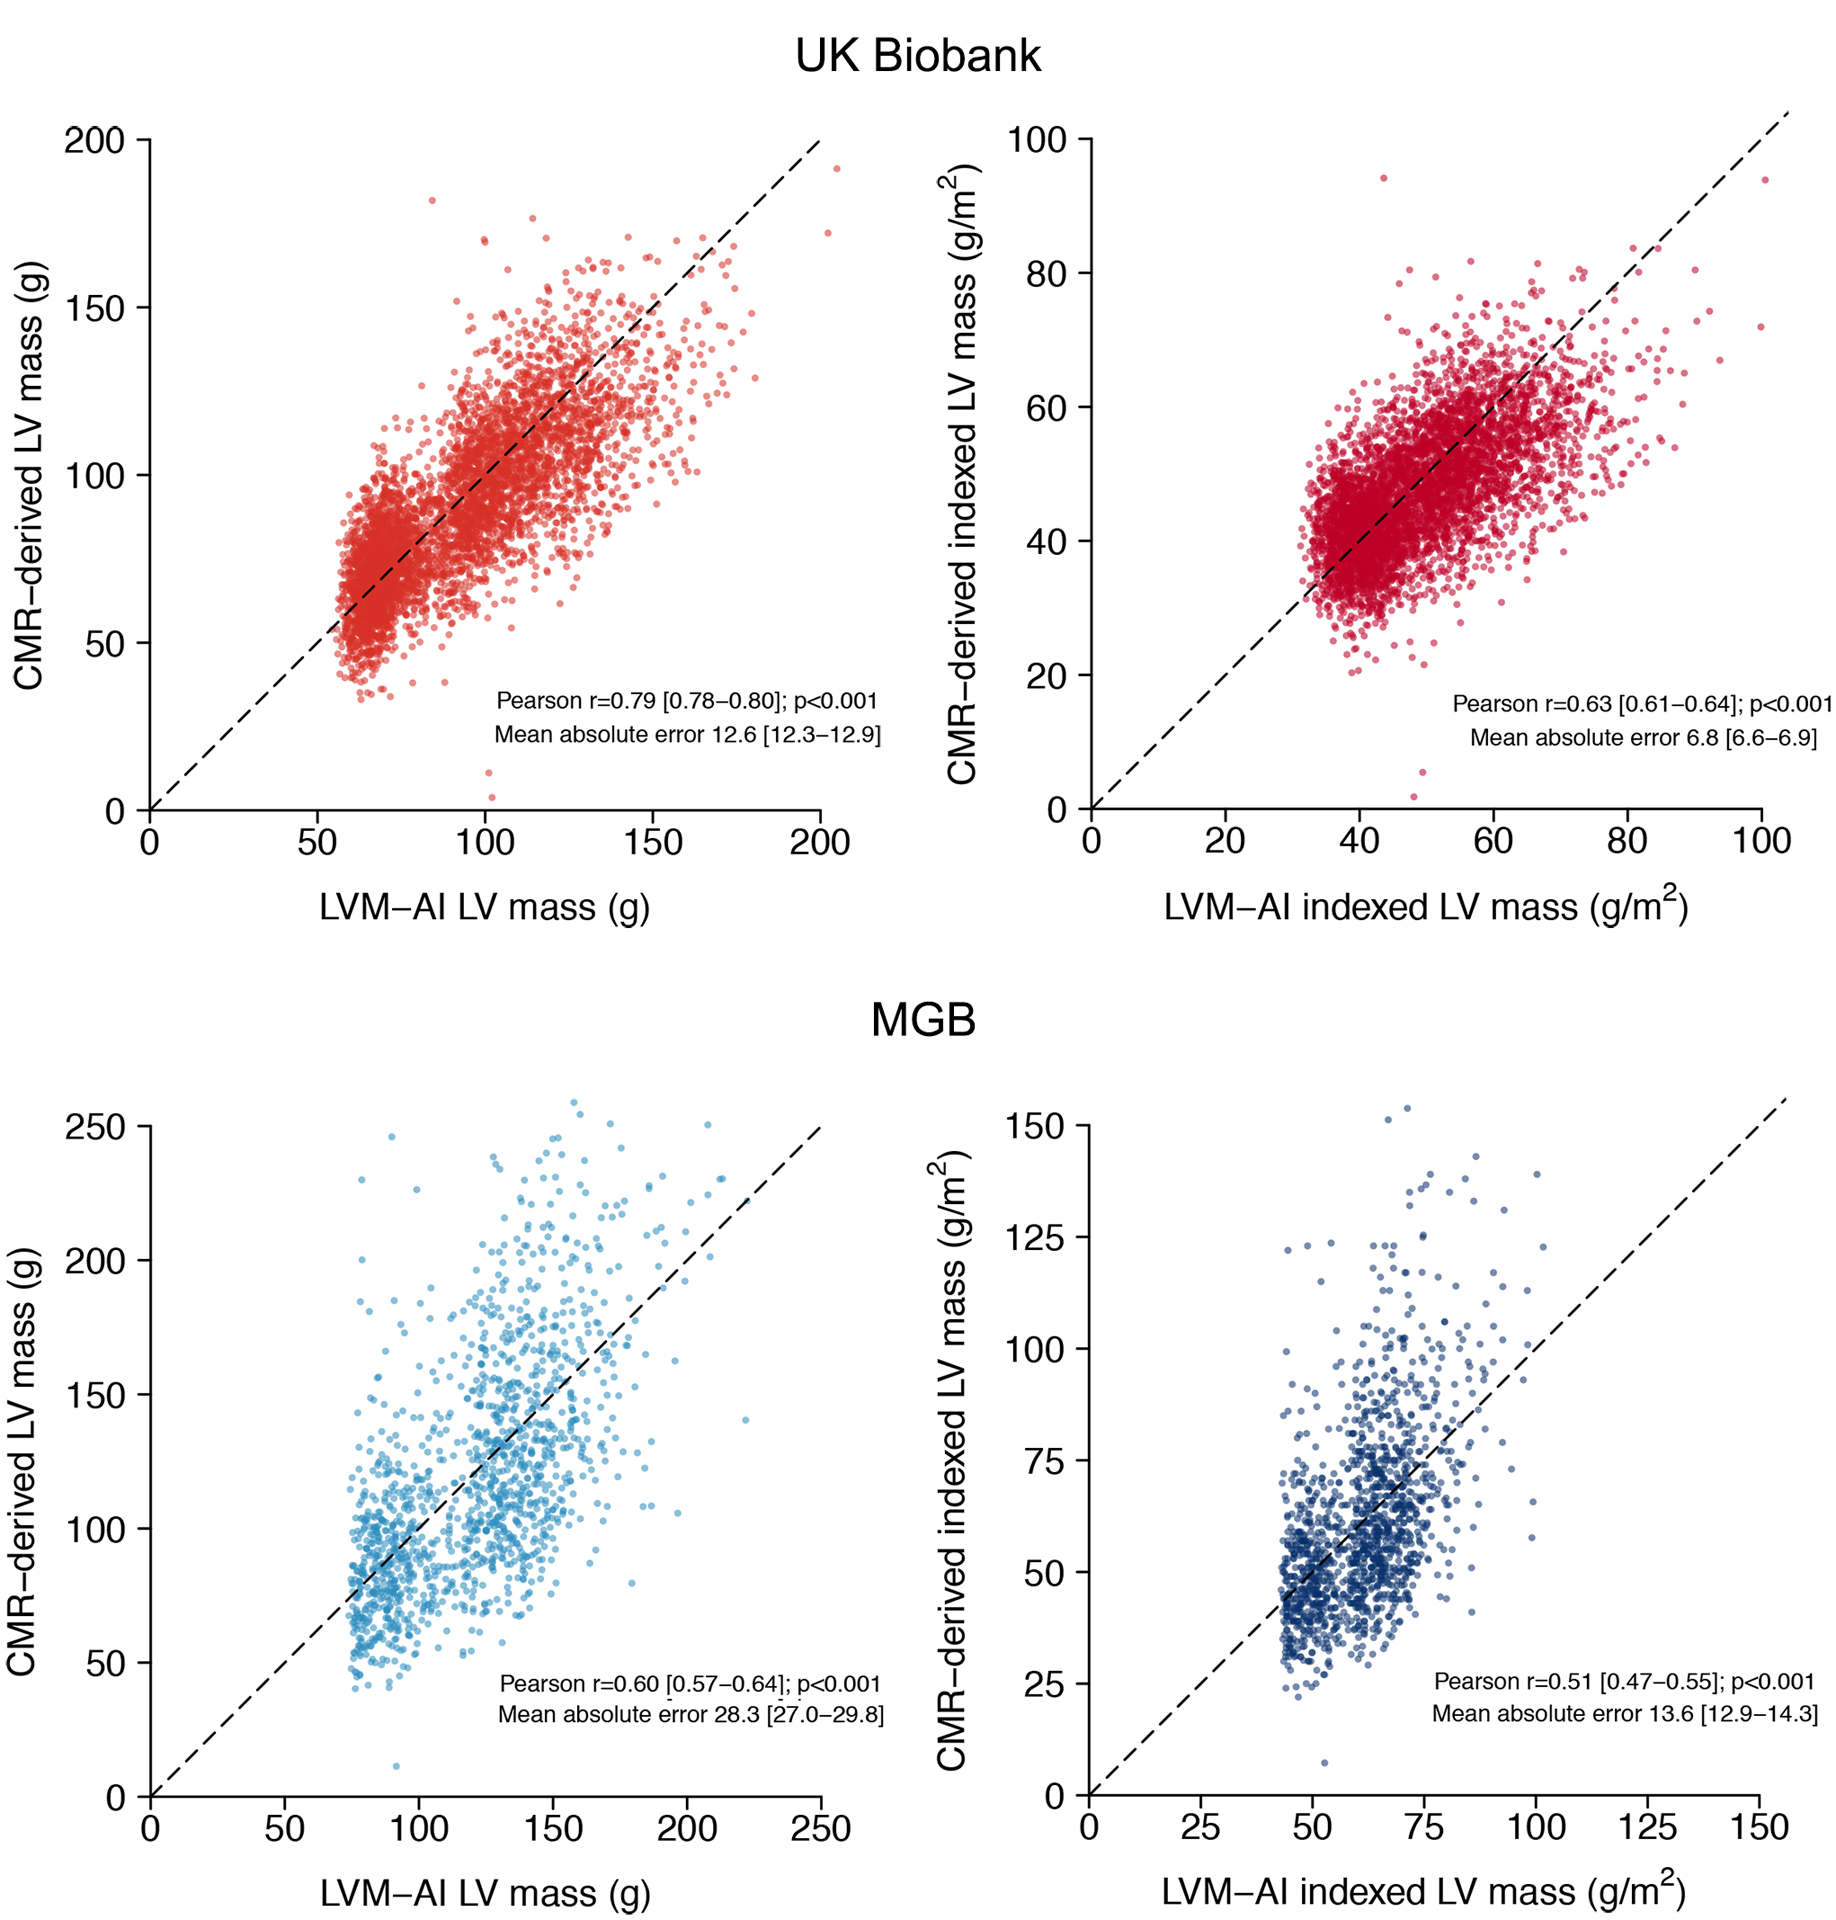
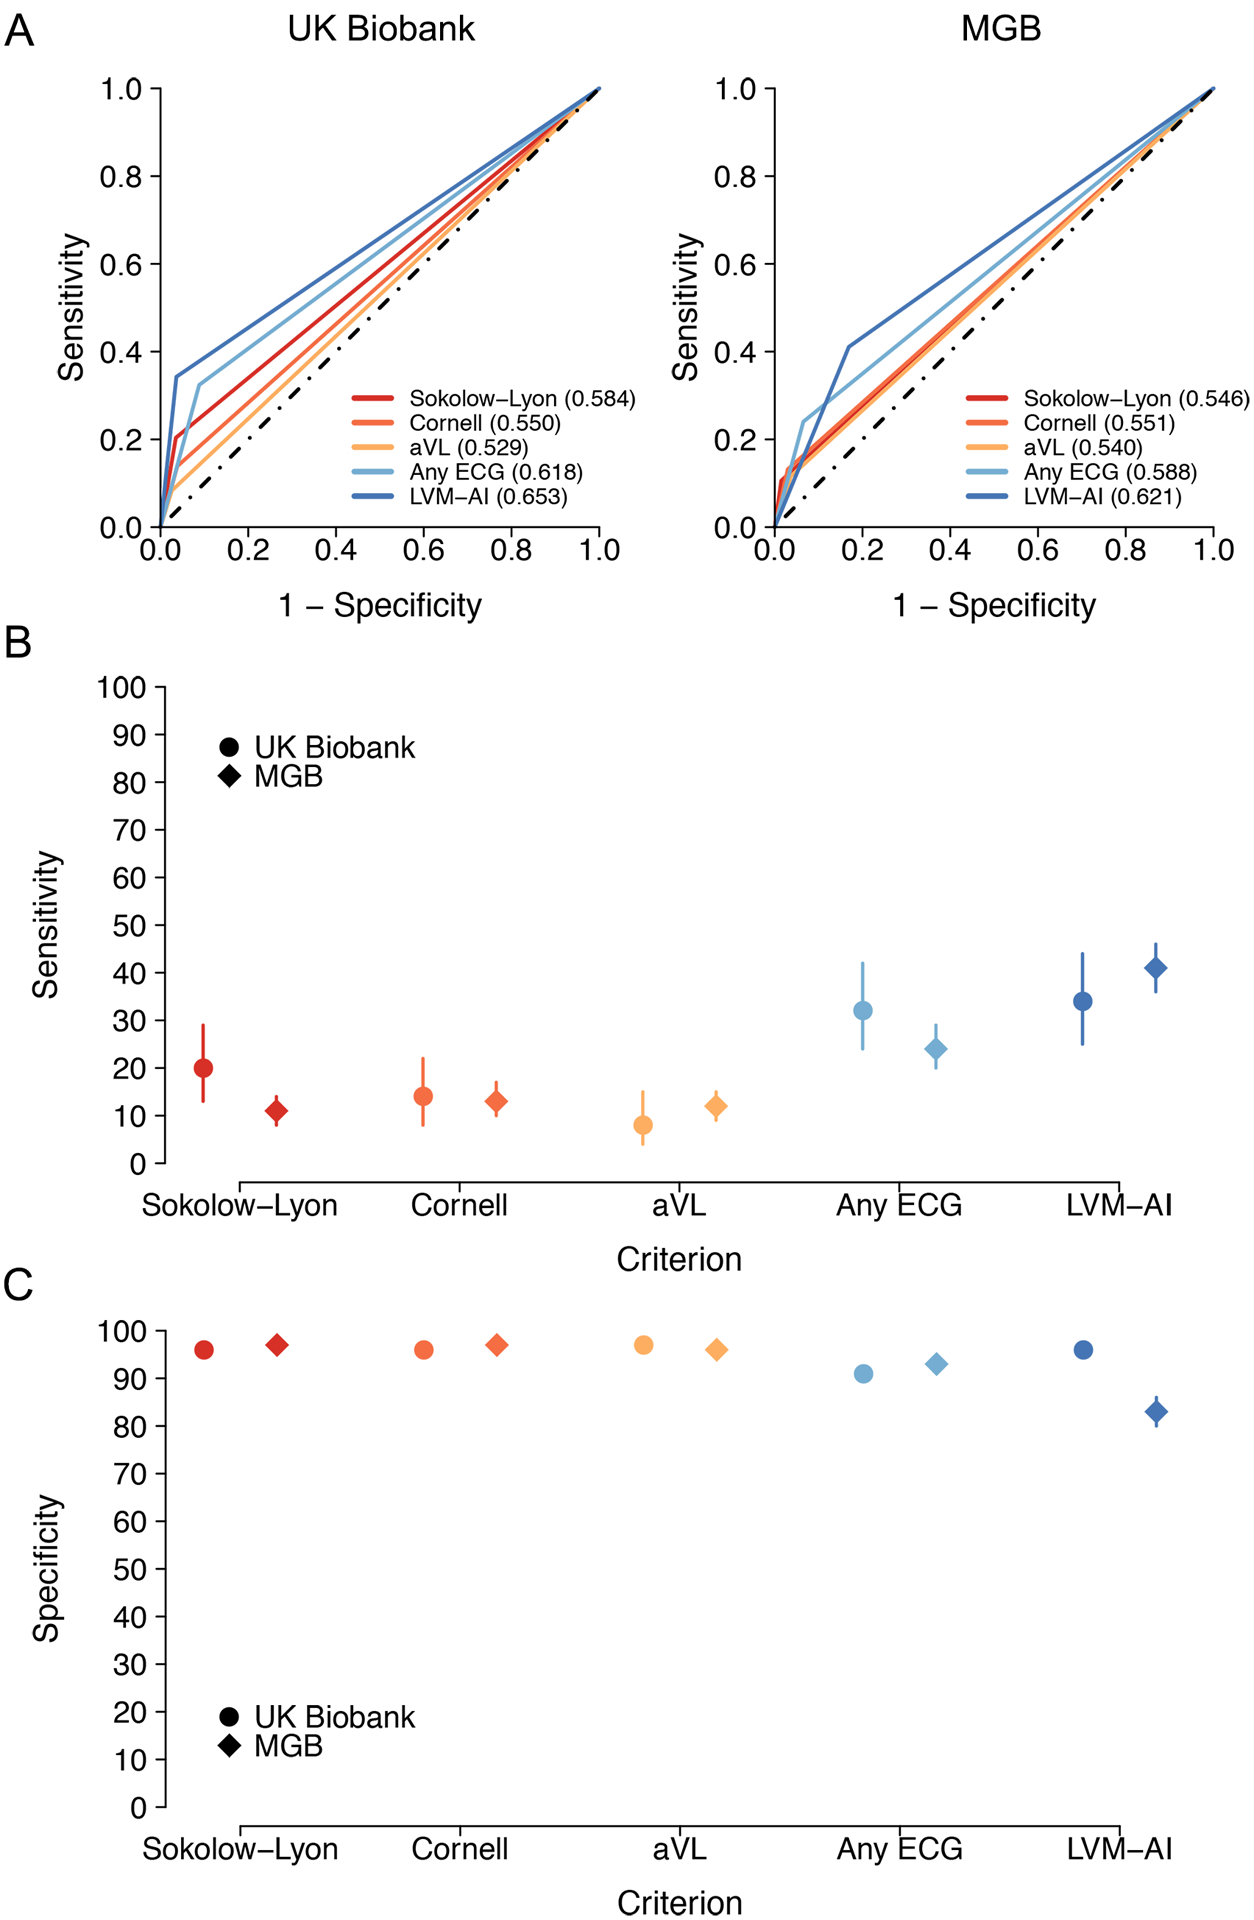
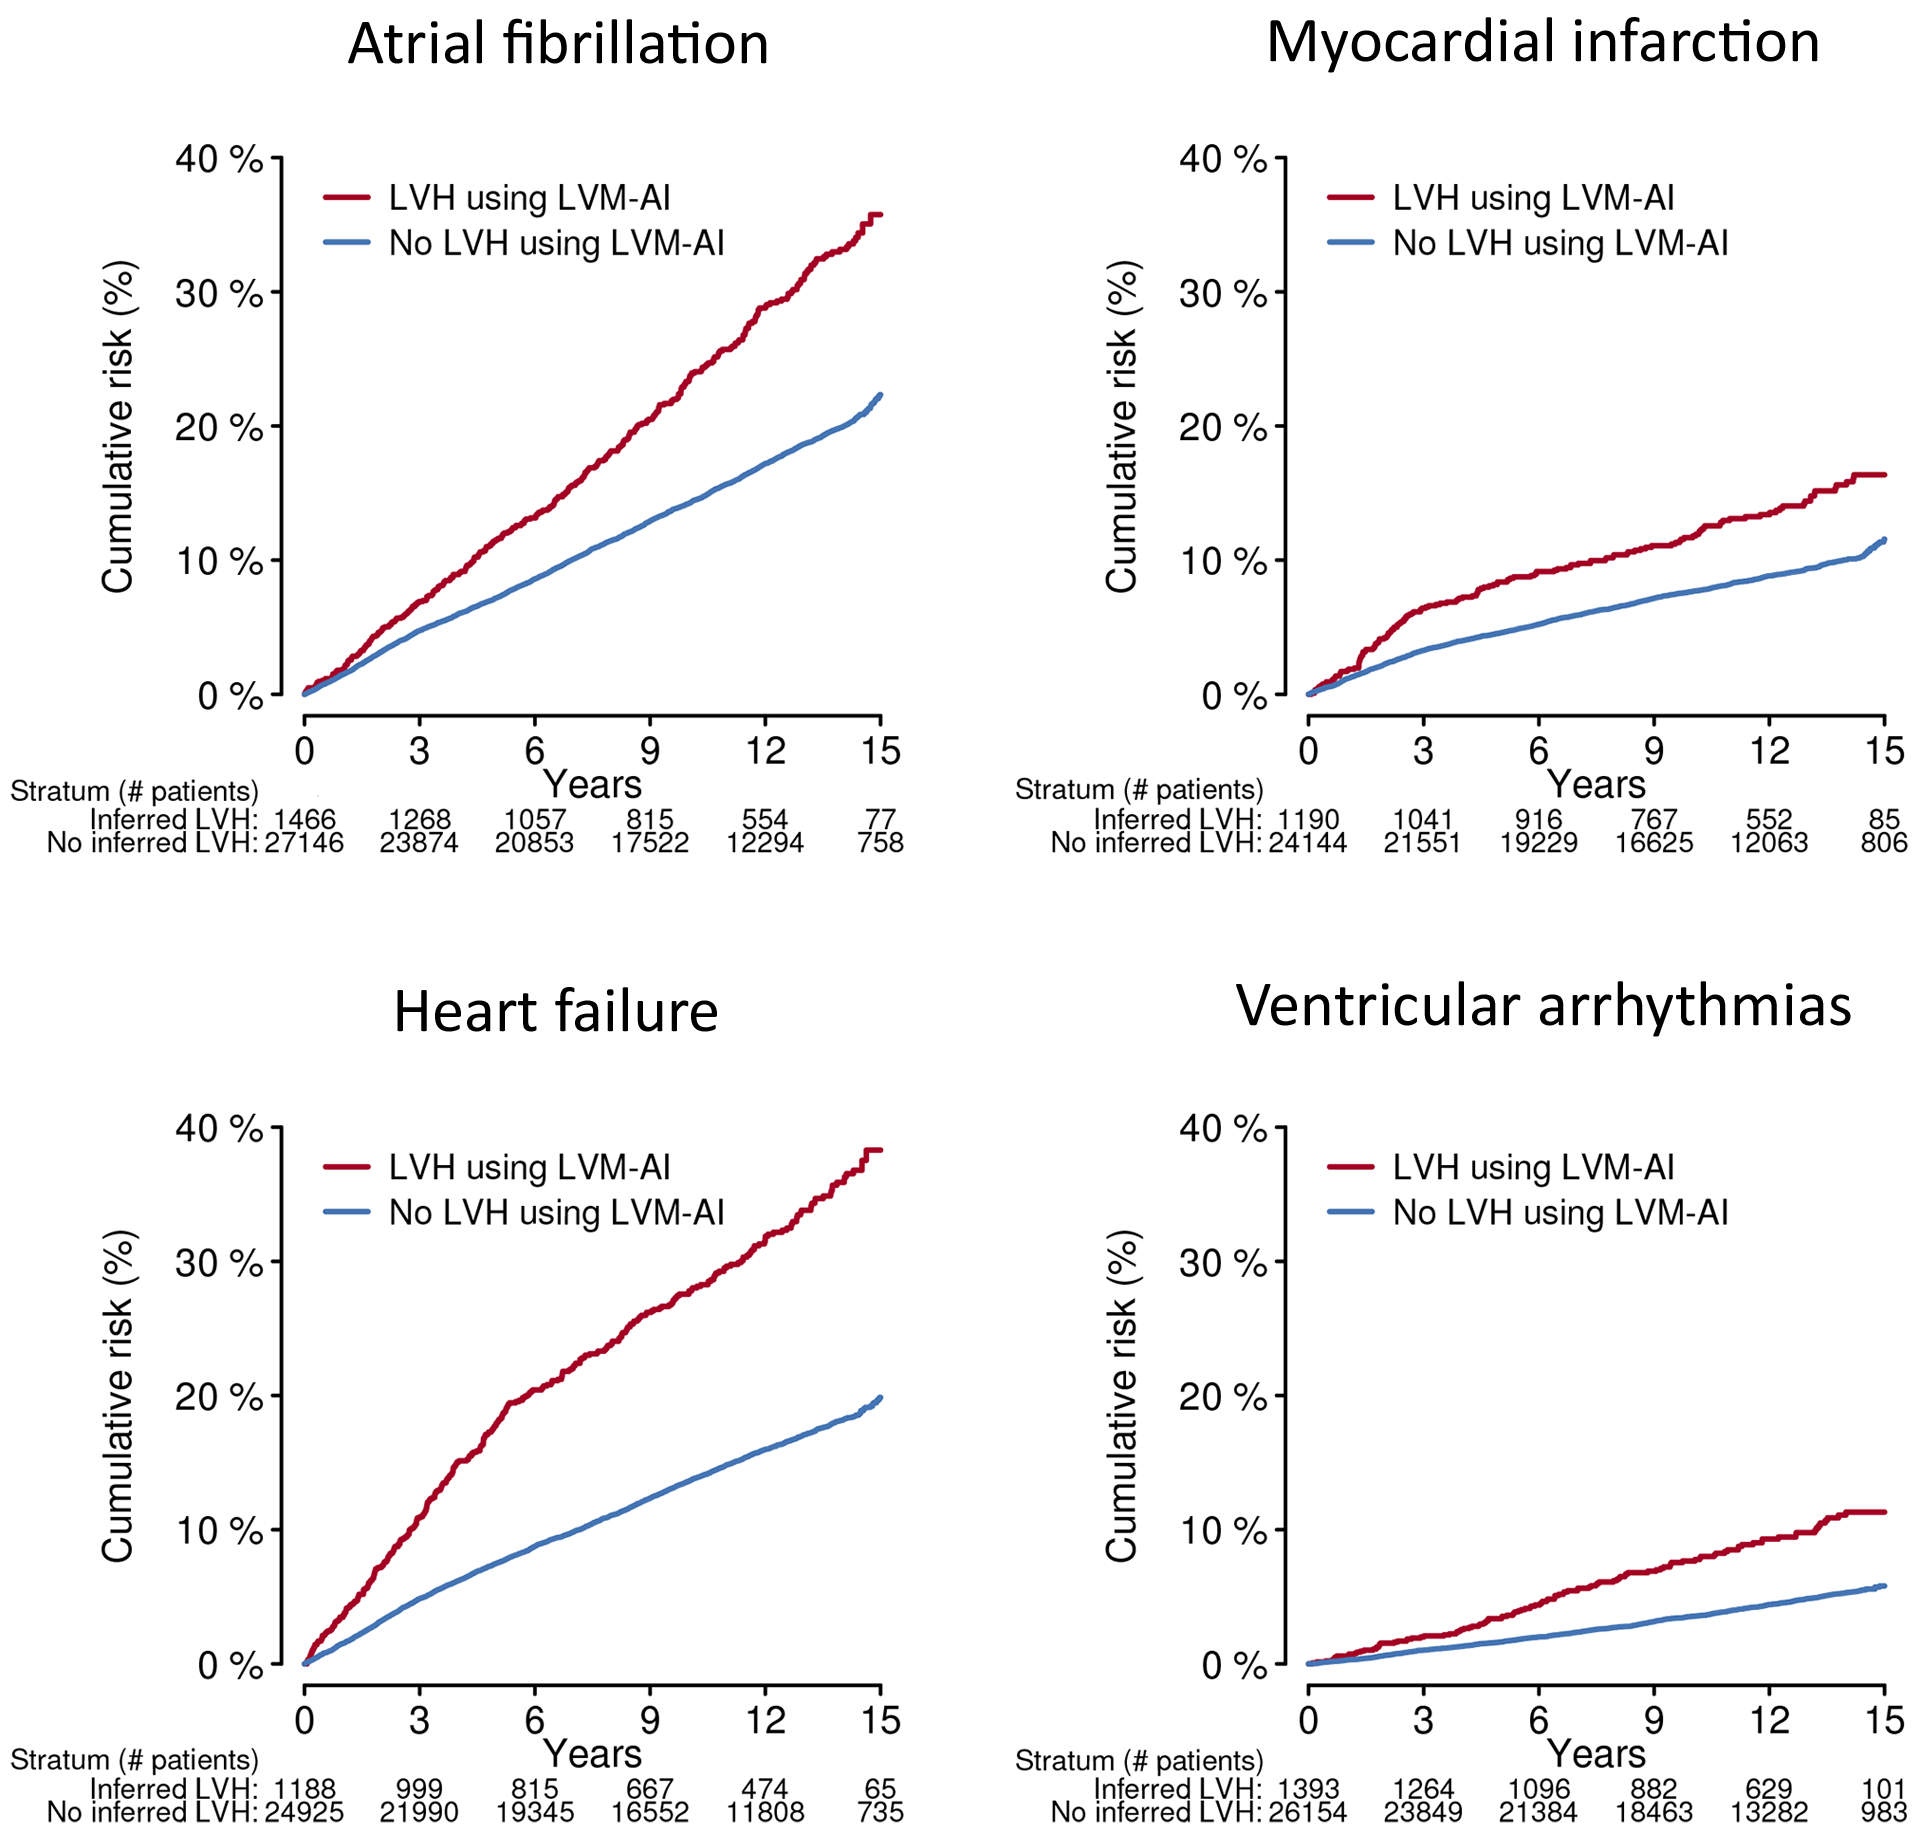
Results: LVM-AI predicted LV mass correlated with CMR-derived LV mass in both test sets, although correlation was greater in the UK Biobank (r=0.79) versus MGB (r=0.60, P<0.001 for both). When compared with any ECG rule, LVM-AI demonstrated similar LVH discrimination in the UK Biobank (LVM-AI c-statistic 0.653 [95% CI, 0.608 -0.698] versus any ECG rule c-statistic 0.618 [95% CI, 0.574 -0.663], P=0.11) and superior discrimination in MGB (0.621; 95% CI, 0.592 -0.649 versus 0.588; 95% CI, 0.564 -0.611, P=0.02). LVM-AI-predicted LVH was associated with incident atrial fibrillation, myocardial infarction, heart failure, and ventricular arrhythmias.

Conclusions: Deep learning-inferred LV mass estimates from 12-lead ECGs correlate with CMR-derived LV mass, associate with incident cardiovascular disease, and may improve LVH discrimination compared to traditional ECG rules.

Keywords: atrial fibrillation; heart failure; left ventricular hypertrophy; machine learning; myocardial infarction.


Figures

Figure 1.
Figure 1.
Study conceptual overview We developed LVM-AI – a deep learning model to infer CMR-derived LV mass using 12-lead ECG – in the UK Biobank. Then, we compared LVM-AI to traditional ECG-based rules for diagnosing CMR-derived LVH in independent test sets within the UK Biobank and Mass General Brigham (MGB). Lastly, we assessed for associations between LVM-AI predicted LVH and incident cardiovascular disease in the UK Biobank and an MGB-based ambulatory cohort.
Figure 2.
Figure 2.
Overview of training and test samples The training sample consisted of individuals in the UK Biobank with 12-lead ECG and CMR images available. LVM-AI was evaluated in a UK Biobank test set as well as an external healthcare-based MGB dataset. In both test sets, we compared LVM-AI to traditional ECG-based rules for diagnosing CMR-derived LVH. Associations between LVM-AI predicted LV mass index and incident cardiovascular events was performed in the UK Biobank and a separate MGB-based ambulatory cohort (MGB Outcomes).
Figure 3.
Figure 3.
Correlation between LVM-AI predicted and CMR-derived LV mass in test sets Depicted is the correlation between LVM-AI predicted (x-axis) and CMR-derived (y-axis) LV mass in UK Biobank (upper panels) and MGB (lower panels) test sets. Left panels compare unindexed LV mass and right panels compare indexed LV mass. Lower panels reflect LVM-AI predicted LV mass values after linear recalibration (see text). The diagonal line represents perfect correlation. The Pearson correlation coefficient and mean absolute error are shown on each plot.
Figure 4.
Figure 4.
LVM-AI saliency maps Depicted is a 12-lead ECG tracing and saliency map from a single individual correctly classified by LVM-AI as having LVH despite not meeting any ECG-based LVH rules. The red waveform is the individual’s ECG tracing. Blue shades depict the magnitude of the gradient of predicted LV mass with respect to the ECG waveform amplitude, where darker shades illustrate regions of the waveform exerting greater influence on predicted LV mass. Measured R and S wave amplitudes (μV) are depicted on the top left of each plot.
Figure 5.
Figure 5.
Diagnostic test performance of LVM-AI versus ECG rules for LVH Depicted are diagnostic test characteristics for LVH using LVM-AI predicted LV mass (dark blue) versus traditional ECG rules including Sokolow-Lyon (red), Cornell (orange), aVL (yellow), and any ECG rule (light blue) in both UK Biobank Test (circles) and MGB Test (diamonds). Panels A depict receiver operating characteristic curves for LVH, Panel B compares sensitivity for LVH, and Panel C compares specificity for LVH. LVH is defined as CMR-derived indexed left ventricular mass >72g/m2 in men and >55 g/m2 in women.
Figure 6.
Figure 6.
Cumulative risk of cardiovascular events stratified by LVM-AI predicted LVH in MGB Test Depicted are the cumulative risks of atrial fibrillation, myocardial infarction, heart failure, and ventricular arrhythmias in MGB Test, stratified by presence (red) versus absence (blue) of LVM-AI predicted LVH. The number remaining at risk within each stratum is listed below each plot. LVH was defined as LVM-AI predicted LV mass index >72g/m2 in men and >55 g/m2 in women.

Comment in

References

    1. Bluemke DA, Kronmal RA, Lima JAC, Liu K, Olson J, Burke GL, Folsom AR. The relationship of left ventricular mass and geometry to incident cardiovascular events: the MESA (Multi-Ethnic Study of Atherosclerosis) study. J Am Coll Cardiol. 2008;52:2148–2155. - PMC - PubMed
    1. Chrispin J, Jain A, Soliman EZ, Guallar E, Alonso A, Heckbert SR, Bluemke DA, Lima JAC, Nazarian S. Association of electrocardiographic and imaging surrogates of left ventricular hypertrophy with incident atrial fibrillation: MESA (Multi-Ethnic Study of Atherosclerosis). J Am Coll Cardiol. 2014;63:2007–2013. - PMC - PubMed
    1. Kawel-Boehm N, Kronmal R, Eng J, Folsom A, Burke G, Carr JJ, Shea S, Lima JAC, Bluemke DA. Left Ventricular Mass at MRI and Long-term Risk of Cardiovascular Events: The Multi-Ethnic Study of Atherosclerosis (MESA). Radiology. 2019;293:107–114. - PMC - PubMed
    1. Casale PN, Devereux RB, Kligfield P, Eisenberg RR, Miller DH, Chaudhary BS, Phillips MC. Electrocardiographic detection of left ventricular hypertrophy: development and prospective validation of improved criteria. J Am Coll Cardiol. 1985;6:572–580. - PubMed
    1. Sokolow M, Lyon TP. The ventricular complex in left ventricular hypertrophy as obtained by unipolar precordial and limb leads. Am Heart J. 1949;37:161–186. - PubMed

Publication types