. 2021 Jun 29;12(3):e0106121.
doi: 10.1128/mBio.01061-21. Epub 2021 Jun 15.

Mechanisms of Transforming DNA Uptake to the Periplasm of Bacillus subtilis

Affiliations

Mechanisms of Transforming DNA Uptake to the Periplasm of Bacillus subtilis

Jeanette Hahn et al. mBio. .

Abstract

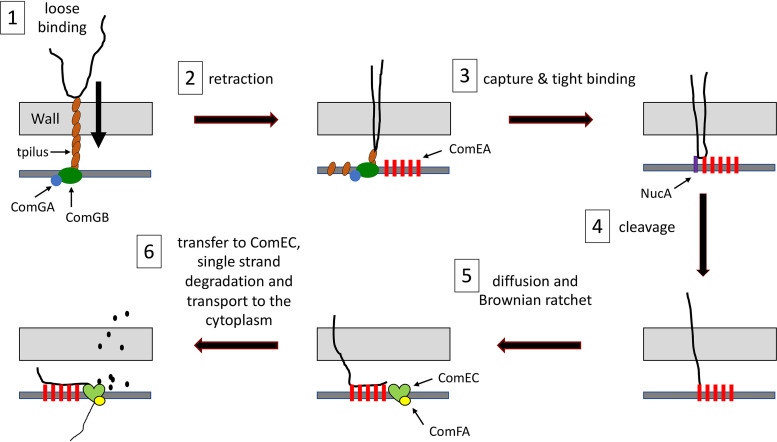
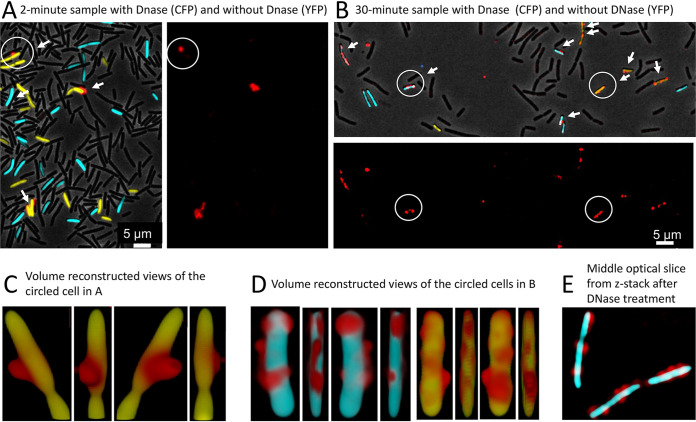
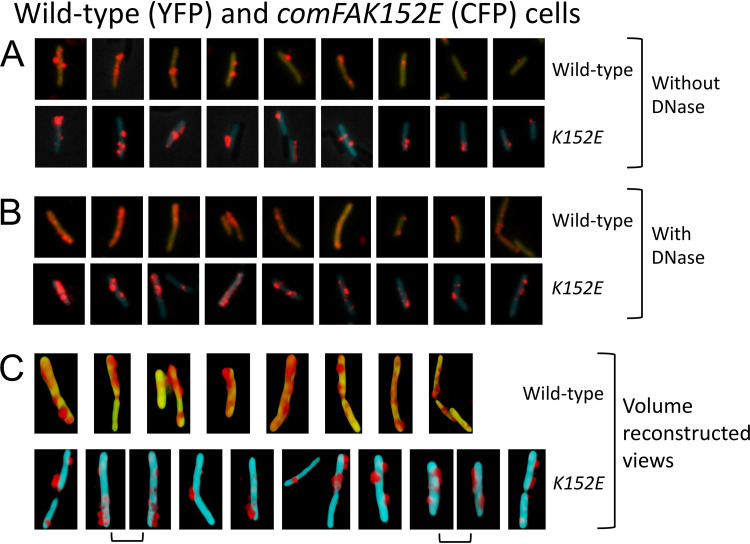
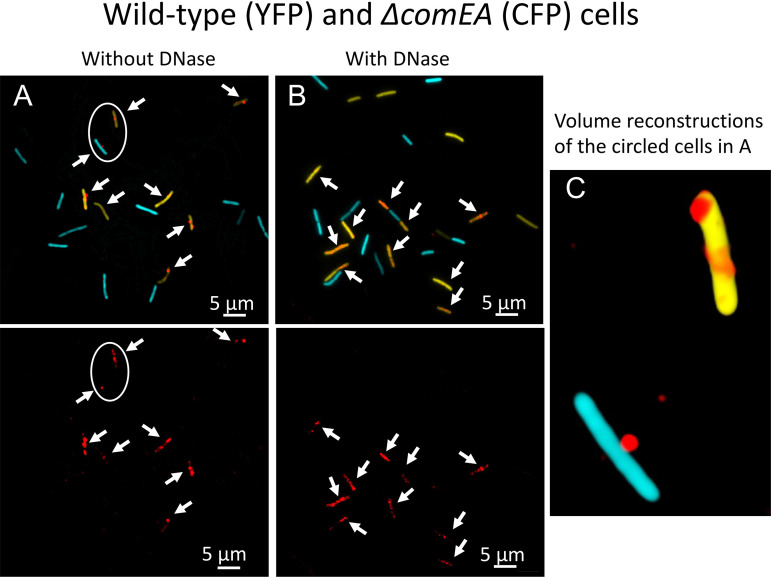
We demonstrate here that the acquisition of DNase resistance by transforming DNA, often assumed to indicate transport to the cytoplasm, reflects uptake to the periplasm, requiring a reevaluation of conclusions about the roles of several proteins in transformation. The new evidence suggests that the transformation pilus is needed for DNA binding to the cell surface near the cell poles and for the initiation of uptake. The cellular distribution of the membrane-anchored ComEA of Bacillus subtilis does not dramatically change during DNA uptake as does the unanchored ComEA of Vibrio and Neisseria. Instead, our evidence suggests that ComEA stabilizes the attachment of transforming DNA at localized regions in the periplasm and then mediates uptake, probably by a Brownian ratchet mechanism. Following that, the DNA is transferred to periplasmic portions of the channel protein ComEC, which plays a previously unsuspected role in uptake to the periplasm. We show that the transformation endonuclease NucA also facilitates uptake to the periplasm and that the previously demonstrated role of ComFA in the acquisition of DNase resistance derives from the instability of ComGA when ComFA is deleted. These results prompt a new understanding of the early stages of DNA uptake for transformation. IMPORTANCE Transformation is a widely distributed mechanism of bacterial horizontal gene transfer that plays a role in the spread of antibiotic resistance and virulence genes and more generally in evolution. Although transformation was discovered nearly a century ago and most, if not all the proteins required have been identified in several bacterial species, much remains poorly understood about the molecular mechanism of DNA uptake. This study uses epifluorescence microscopy to investigate the passage of labeled DNA into the compartment between the cell wall and the cell membrane of Bacillus subtilis, a necessary early step in transformation. The roles of individual proteins in this process are identified, and their modes of action are clarified.

Keywords: Bacillus subtilis; ComEA; ComEC; DNA uptake; periplasm; transformation.


Figures

FIG 1
FIG 1
Transformation model. The process is divided into six steps. Each protein is depicted only before the step in which it is required. (Step 1) The transforming DNA binds reversibly to the transforming DNA (tDNA), which extends across the cell wall. Assembly of the tpilus requires the ATPase ComGA. The tpilus is presumably anchored by the ComGB scaffold protein. (Step 2) The tpilus retracts, bringing a loop of DNA into the periplasm. (Step 3) The DNA is captured by ComEA, a membrane-anchored DNA binding protein, and association of the DNA with the cell is stabilized. (Step 4) The membrane DNase NucA cleaves the DNA, providing a terminus for further steps. (Step 5) More DNA diffuses into the periplasm and is captured by additional nearby molecules of ComEA, preventing retrograde diffusion (a Brownian ratchet). (Step 6) DNA is transferred to periplasmic domains of the channel protein ComEC. One strand is degraded, and the other is transported through the channel with the help of the ATPase ComFA.
FIG 2
FIG 2
Binding of tDNA and acquisition of DNase I (DNase) resistance. Competent cells expressing CFP (BD5810) or YFP (BD6011) from the comG promoter were incubated separately with rDNA, and samples were taken after 2 (A) and 30 (B) min of incubation. The CFP samples were treated with DNase and then combined with YFP samples from the same time points after removing the DNase. In panels A and B, images are presented with superimposed rhodamine, CFP, YFP, and phase-contrast channels as well as one showing only the rhodamine channel. Cells associated with rDNA are indicated by arrows. The circled cell in panel A was imaged by 3D deconvolution and volume reconstructed, and views produced by successive 90° rotations are shown in panel C. In panel D, volume-reconstructed images are shown for the single cyan (with DNase) and yellow (no DNase) cells, circled in panel B. Panel E contains a 3D-deconvolved optical slice from the center of a Z-stack, showing of a group of cells after DNase treatment.
FIG 3
FIG 3
Binding and uptake in the comFA K152A mutant. Wild-type (YFP) and mutant (CFP) cells were combined and then incubated for 30 min with rDNA. Panels A and B show results for comFA K152E without and with DNase treatment, respectively. In each panel, the top and bottom rows show nine each of wild-type and mutant cells, respectively. All the cells were taken from a single representative microscope field and show all or nearly all of the rDNA-associated cells in that field. In the cropped images of a given panel (A or B), rDNA signals were enhanced identically but rDNA signal intensities cannot be compared between panels A and B. Panel C shows volume-reconstructed images of several representative wild-type (top row) and mutant (bottom row) cells after DNase treatment. In each case, a single view is shown except for the adjacent images in panel C joined by brackets, which show two views of the same cell related by 180° rotations.
FIG 4
FIG 4
Binding and uptake in the ΔcomEA mutant. Wild-type (YFP) and ΔcomEA cells were combined before incubation for 30 min with rDNA. Panel A shows the cells without DNase treatment, and panel B shows cells with treatment. In the top images, the rhodamine, CFP, and YFP channels were merged, and the bottom images in panels A and B show only the rhodamine channel. The arrows indicate the positions of all the rhodamine signals. Panel C shows one aspect from a 3D deconvolution of the CFP- and YFP-expressing cells circled in panel A.
FIG 5
FIG 5
Binding and uptake in the nucA D98A mutant. (A and B) Wild-type (YFP) and D98A (CFP) mutant cells were made competent, combined, and after 15-min incubation with rDNA, imaged without (A) and with DNase (pB). In each of these panels, the top and bottom rows show nearly all the wild-type and mutant cells with rDNA signals from a single field. The rhodamine signal was enhanced before cropping the cells, and the intensities of the rhodamine signal can be directly compared within the panels. The YFP and CFP images were separately adjusted in each image so as not to obscure the rDNA signal. The images in these two panels were ordered by apparent rDNA signal strengths, decreasing from left to right, to facilitate comparisons of the mutant and wild-type cells. The boxed image in panel B shows a cell expressing both YFP and CFP.
FIG 6
FIG 6
Binding and uptake in the comEC518 mutant. Wild-type (YFP) and ΔcomEC518 (CFP) cells were combined before 30-min incubation with rDNA. The images were processed as described in the legend to Fig. 5. Panel A shows the cells without DNase treatment, and panel B shows cells with treatment. The images in these two panels were ordered by apparent rDNA signal strengths decreasing from left to right, to facilitate comparisons of the mutant and wild-type cells. Panel C shows selected volume-reconstructed images of wild-type and comEC518 cells, DNase treated, selected from the same field, representing almost all the cells in the field. Only one view is shown of each cell. Image intensities cannot be compared either within panel C or with the images in panels A and B.
FIG 7
FIG 7
Association of rDNA and YFP-ComEA without DNase treatment. In each group of four images (a to d in panel A and a to h in panel B), the top and bottom pairs show views of a single cell, related by 180° rotations. The left-hand images in each group show the superimposed YFP, rhodamine, and CFP channels, where CFP delineates the cytoplasmic volume. The right-hand images show only the YFP and rhodamine channels. Panel A shows images collected after 1-min incubation of the cells with rDNA and panel B shows images collected after 10 min.

References

    1. Blokesch M. 2016. Natural competence for transformation. Curr Biol 26:R1126–R1130. doi: 10.1016/j.cub.2016.08.058. - DOI - PubMed
    1. Dubnau D, Blokesch M. 2019. Mechanisms of DNA uptake by naturally competent bacteria. Annu Rev Genet 53:217–237. doi: 10.1146/annurev-genet-112618-043641. - DOI - PubMed
    1. Maier B. 2020. Competence and transformation in Bacillus subtilis. Curr Issues Mol Biol 37:57–76. doi: 10.21775/cimb.037.057. - DOI - PubMed
    1. Hahn J, Albano M, Dubnau D. 1987. Isolation and characterization of Tn917lac-generated competence mutants of Bacillus subtilis. J Bacteriol 169:3104–3109. doi: 10.1128/jb.169.7.3104-3109.1987. - DOI - PMC - PubMed
    1. Albano M, Hahn J, Dubnau D. 1987. Expression of competence genes in Bacillus subtilis. J Bacteriol 169:3110–3117. doi: 10.1128/jb.169.7.3110-3117.1987. - DOI - PMC - PubMed

Publication types

MeSH terms

LinkOut - more resources