. 2021 Jun 14;53(1):49.
doi: 10.1186/s12711-021-00642-1.

Identification of genomic regions affecting production traits in pigs divergently selected for feed efficiency

Affiliations

Identification of genomic regions affecting production traits in pigs divergently selected for feed efficiency

Emilie Delpuech et al. Genet Sel Evol. .

Abstract

Background: Feed efficiency is a major driver of the sustainability of pig production systems. Understanding the biological mechanisms that underlie these agronomic traits is an important issue for environment questions and farms' economy. This study aimed at identifying genomic regions that affect residual feed intake (RFI) and other production traits in two pig lines divergently selected for RFI during nine generations (LRFI, low RFI; HRFI, high RFI).

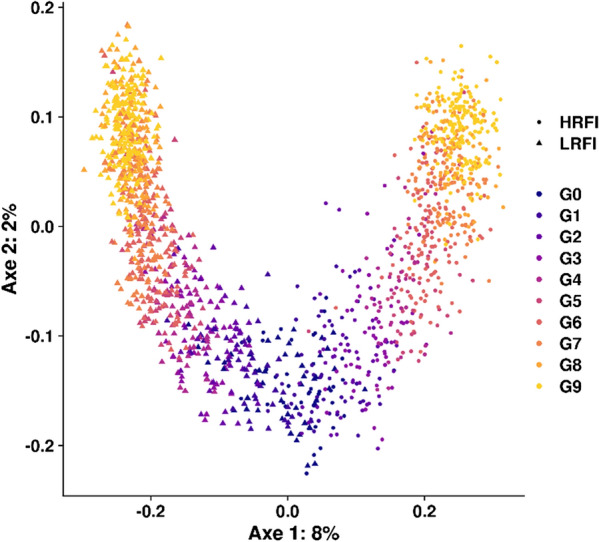
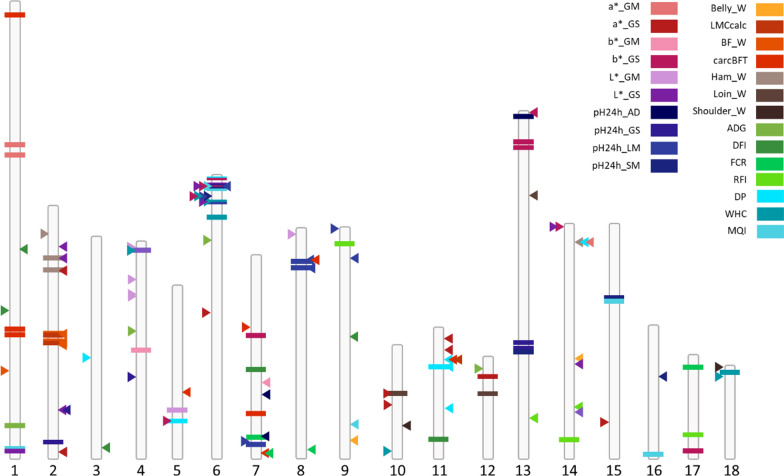
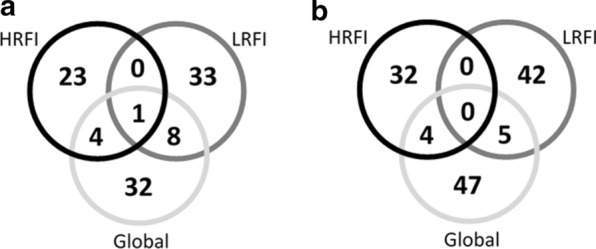
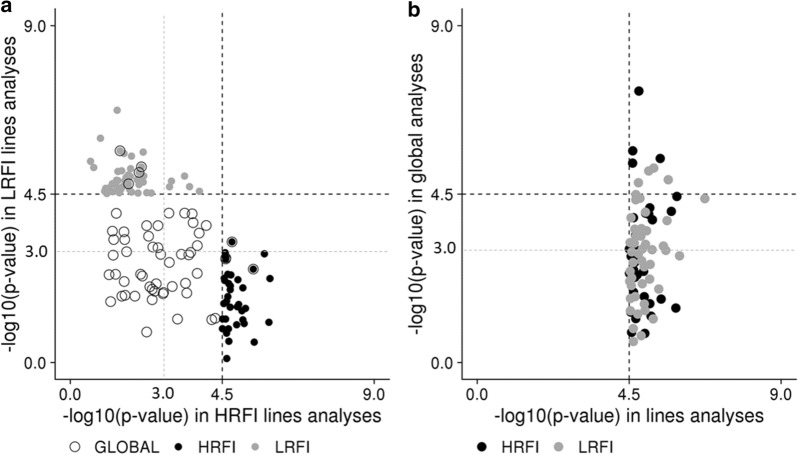
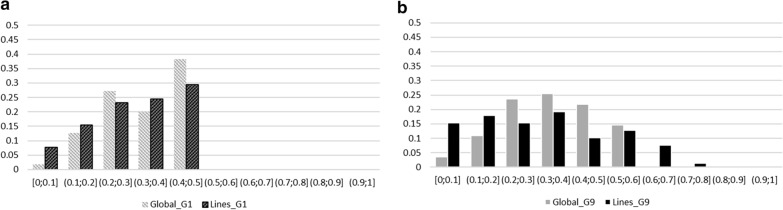
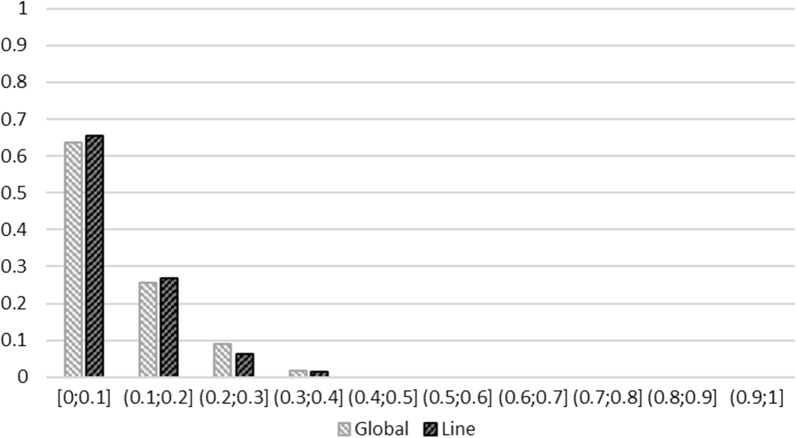
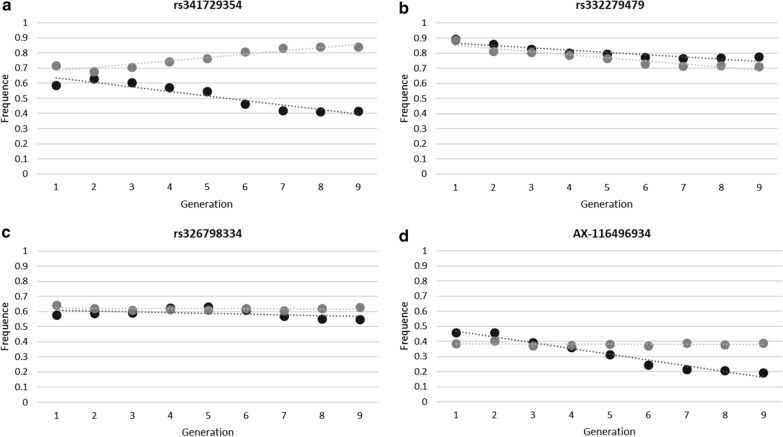
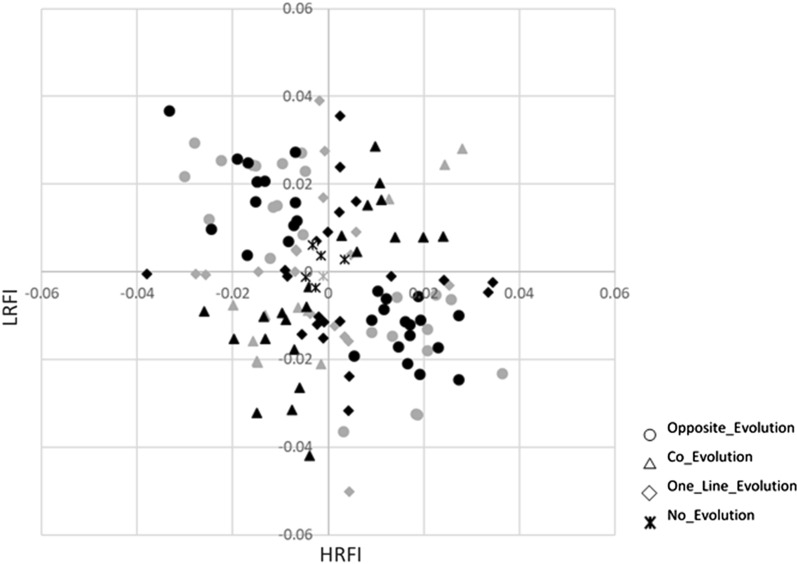
Results: We built a whole dataset of 570,447 single nucleotide polymorphisms (SNPs) in 2426 pigs with records for 24 production traits after both imputation and prediction of genotypes using pedigree information. Genome-wide association studies (GWAS) were performed including both lines (global-GWAS) or each line independently (LRFI-GWAS and HRFI-GWAS). Forty-five chromosomal regions were detected in the global-GWAS, whereas 28 and 42 regions were detected in the HRFI-GWAS and LRFI-GWAS, respectively. Among these 45 regions, only 13 were shared between at least two analyses, and only one was common between the three GWAS but it affects different traits. Among the five quantitative trait loci (QTL) detected for RFI, two were close to QTL for meat quality traits and two pinpointed novel genomic regions that harbor candidate genes involved in cell proliferation and differentiation processes of gastrointestinal tissues or in lipid metabolism-related signaling pathways. In most cases, different QTL regions were detected between the three designs, which suggests a strong impact of the dataset structure on the detection power and could be due to the changes in allelic frequencies during the establishment of lines.

Conclusions: In addition to efficiently detecting known and new QTL regions for feed efficiency, the combination of GWAS carried out per line or simultaneously using all individuals highlighted chromosomal regions that affect production traits and presented significant changes in allelic frequencies across generations. Further analyses are needed to estimate whether these regions correspond to traces of selection or result from genetic drift.


Conflict of interest statement

The authors declare that they have no competing interests.

Figures

Fig. 1
Fig. 1
The first two axes of the multidimensional scaling (MDS) analysis, based on the 570,447 genotypes. Points represent individuals (corresponding to all sires and dams of the population, N = 1632) and colors are generations
Fig. 2
Fig. 2
Location of all SNP-QTL identified on the 18 autosomes from the Global-GWAS, LRFI-GWAS and HRFI-GWAS. The SNP-QTL corresponding to Global-GWAS are represented by horizontal bars, LRFI-GWAS by arrows to the right of the chromosomes and HRFI-GWAS by arrows to the left of the chromosomes. Each color represents one of the 24 traits; LRFI: low RFI line; HRFI: high RFI line; DFI: daily feed intake; ADG: average daily gain; FCR: feed conversion ratio; RFI: residual feed intake; carcBFT: backfat thickness measured on carcass; a*_GM: a* measured on the gluteus medius muscle; a*_GS: a* measured on the gluteus superficialis muscle; b*_GM: b* measured on the gluteus medius muscle; b*_GS: b* measured on the gluteus superficialis muscle; L*_GM: L* measured on the gluteus medius muscle; L*_GS: L* measured on the gluteus superficialis muscle; pH24h_AD: pH 24 h after slaughter measured on the adductor femoris muscle; pH24h_GS: pH 24 h after slaughter measured on the gluteus superficialis muscle; pH24h_LM: pH 24 h after slaughter measured on the longissimus dorsi muscle; pH24h_SM: pH 24 h after slaughter measured on the semimembranosus muscle; WHC: water holding capacity of the gluteus superficialis muscle; MQI: meat quality index; LMCcalc: lean meat content of the carcass; DP: carcass dressing percentage; Belly_W: belly weight; BF_W: backfat weight; Ham_W: ham weight; Loin_W: loin weight; Shoulder_W: shoulder weight
Fig. 3
Fig. 3
Comparison of GWAS results obtained from Global-GWAS (Global), HRFI-GWAS (HRFI) and LRFI-GWAS (LRFI). a Comparison of the number of identical regions and b comparison of the number of identical QTL (trait x region)
Fig. 4
Fig. 4
Plot of the − log10(p-value) of the SNP-QTL. The − log10(p-value) are obtained in first case with the two lines analyses for all SNP-QTL detected for the lines or the global analyses (a), and in second case obtained with the global analysis for SNP-QTL detected with the GWAS performed per line (b)
Fig. 5
Fig. 5
Distribution of SNP-QTL allele frequencies of Global-GWAS (in grey) and Lines-GWAS (in black). Distribution representing individuals from the line of the significant analysis a in G1 generation (G1 individuals only) and b in G9 generation (G1 to G9 individuals)
Fig. 6
Fig. 6
Distribution of differences in allele frequencies between the lines. The differences in allele frequencies are the absolute values between lines for SNP-QTL resulting from the Global-GWAS and Lines-GWAS in G1
Fig. 7
Fig. 7
Linear regression of the generation number on the allele frequencies computed in each line. Allele frequencies were estimated in the two lines by combining, for each generation, individuals of the generation n with the previous ones (animals from generation G1 to G n-1). Allelic frequencies evolutions are reported for SNP-QTL corresponding to a no-evolution, b co-evolution in both lines, c opposite-evolution, and d evolution only in one line, situations
Fig. 8
Fig. 8
Slopes of the linear regression equations of the allele frequencies on the nine generations. Slopes were calculated in each line, for all SNP-QTL identified with Global-GWAS (in grey) and Lines-GWAS (in black). Four situations (differentiated by different labels) were identified according to the significance of the slope (different from zero with p < 0.05 with a Wald test) in one or the two lines
Fig. 9
Fig. 9
Genetic differences in G9 between the two lines. The genetic differences were expressed in genetic standard deviations of the trait (σg) as a function of the average evolution of allelic frequencies in the QTL regions of the trait between the two lines. The magnitude of the genetic correlation between each trait and RFI is indicated with a grey gradient; DFI: daily feed intake; ADG: average daily gain; FCR: feed conversion ratio; RFI: residual feed intake; carcBFT: backfat thickness measured on carcass; a*_GM: a* measured on the gluteus medius muscle; a*_GS: a* measured on the gluteus superficialis muscle; b*_GM: b* measured on the gluteus medius muscle; b*_GS: b* measured on the gluteus superficialis muscle; L*_GM: L* measured on the gluteus medius muscle; L*_GS: L* measured on the gluteus superficialis muscle; pH24h_AD: pH 24 h after slaughter measured on the adductor femoris muscle; pH24h_GS: pH 24 h after slaughter measured on the gluteus superficialis muscle; pH24h_LM: pH 24 h after slaughter measured on the longissimus dorsi muscle; pH24h_SM: pH 24 h after slaughter measured on the semimembranosus muscle; WHC: water holding capacity of the gluteus superficialis muscle; MQI: meat quality index; LMCcalc: lean meat content of the carcass; DP: carcass dressing percentage; Belly_W: belly weight; BF_W: backfat weight; Ham_W: ham weight; Loin_W: loin weight; Shoulder_W: shoulder weight

References

    1. McGlone J, Pond W. Pig production: biological principles and applications. Florence: Thomson/Delmar Learning; 2003.
    1. Soleimani T, Gilbert H. Evaluating environmental impacts of selection for residual feed intake in pigs. Animal. 2020;14:2598–608. doi: 10.1017/S175173112000138X. - DOI - PMC - PubMed
    1. Webb AJ, King JWB. Selection for improved food conversion ratio on ad libitum group feeding in pigs. Anim Sci. 1983;37:375–385. doi: 10.1017/S0003356100001987. - DOI
    1. Koch RM, Swiger LA, Chambers D, Gregory KE. Efficiency of feed use in beef cattle. J Anim Sci. 1963;22:486–494. doi: 10.2527/jas1963.222486x. - DOI
    1. Gilbert H, Bidanel J-P, Gruand J, Caritez J-C, Billon Y, Guillouet P, et al. Genetic parameters for residual feed intake in growing pigs, with emphasis on genetic relationships with carcass and meat quality traits. J Anim Sci. 2007;85:3182–3188. doi: 10.2527/jas.2006-590. - DOI - PubMed

LinkOut - more resources