. 2021 Jun 14;21(1):697.
doi: 10.1186/s12885-021-08358-7.

Identification of novel hub genes associated with gastric cancer using integrated bioinformatics analysis

Affiliations

Identification of novel hub genes associated with gastric cancer using integrated bioinformatics analysis

Xiao-Qing Lu et al. BMC Cancer. .

Abstract

Background: Gastric cancer (GC) is one of the most common solid malignant tumors worldwide with a high-recurrence-rate. Identifying the molecular signatures and specific biomarkers of GC might provide novel clues for GC prognosis and targeted therapy.

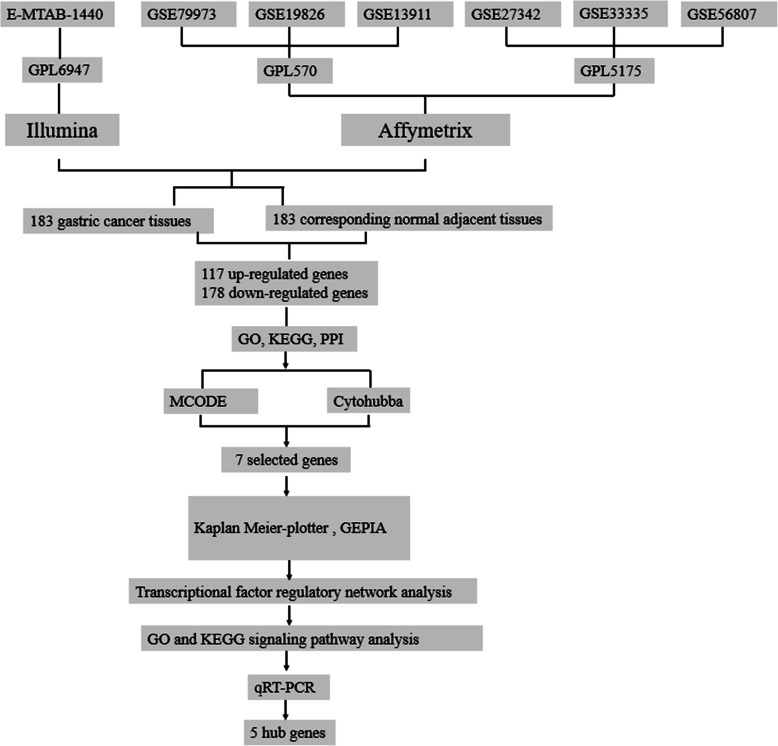
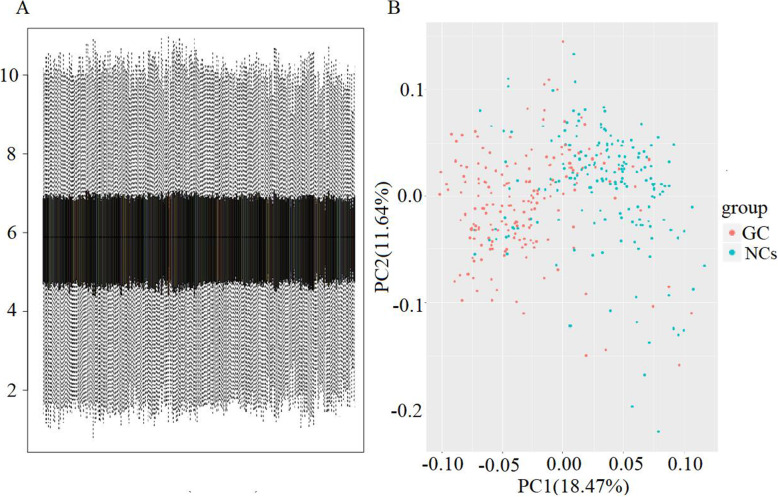
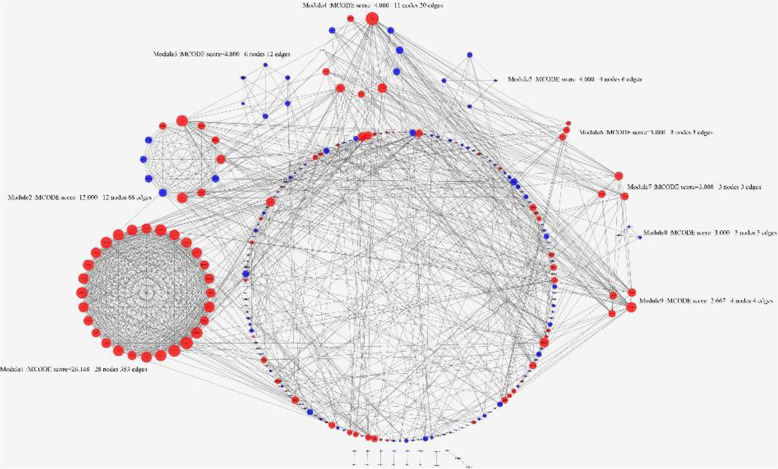
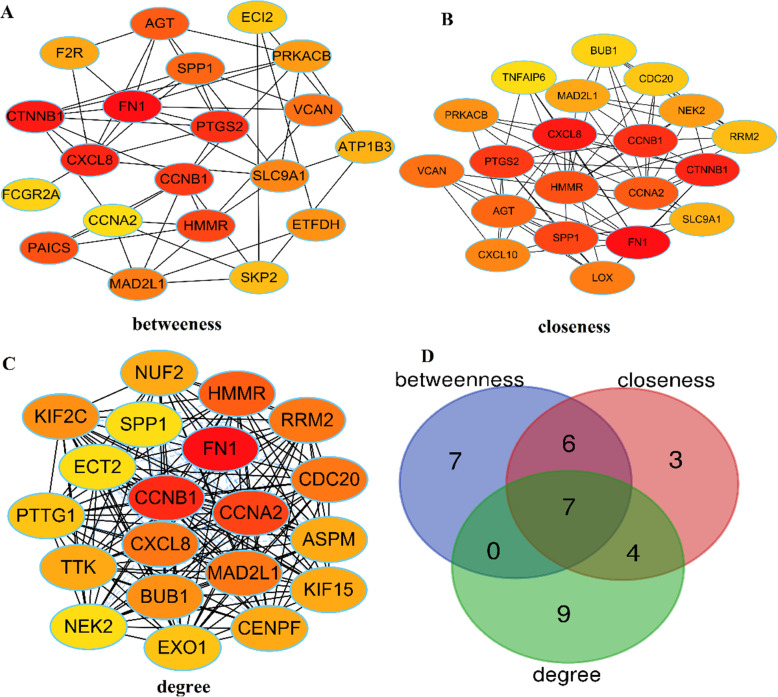
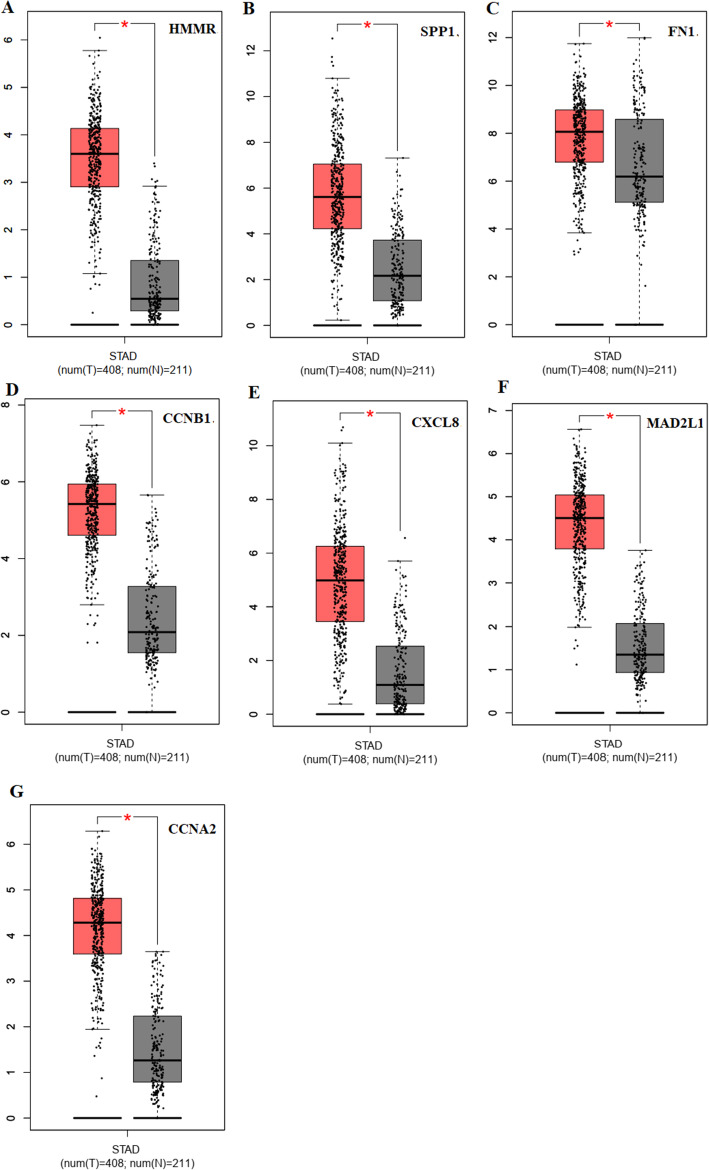
Methods: Gene expression profiles were obtained from the ArrayExpress and Gene Expression Omnibus database. Differentially expressed genes (DEGs) were picked out by R software. The hub genes were screened by cytohubba plugin. Their prognostic values were assessed by Kaplan-Meier survival analyses and the gene expression profiling interactive analysis (GEPIA). Finally, qRT-PCR in GC tissue samples was established to validate these DEGs.

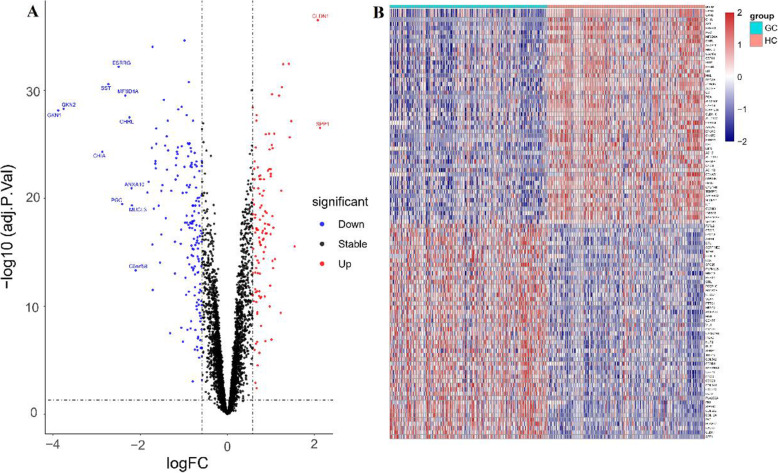
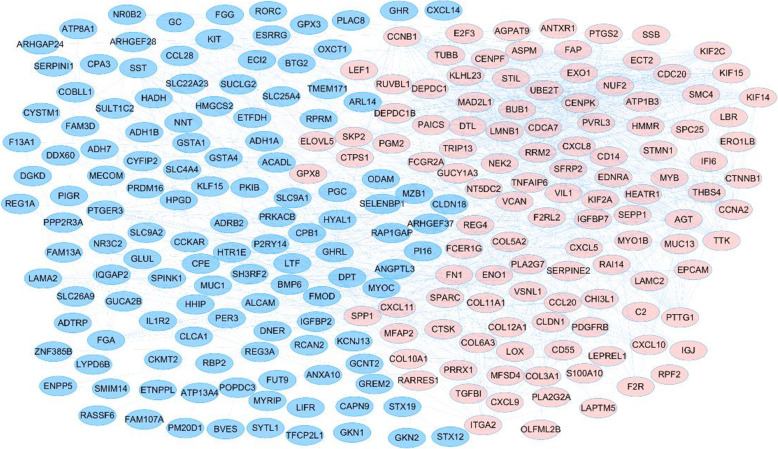
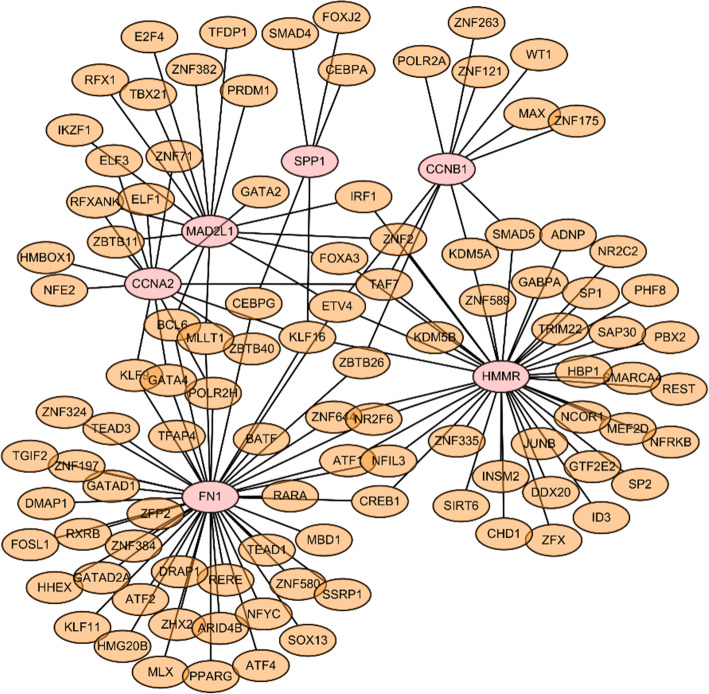
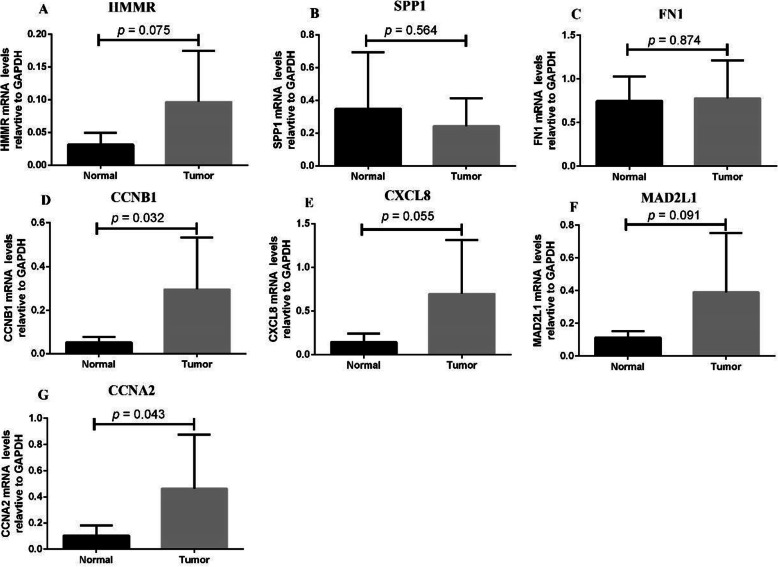
Results: Total of 295 DEGs were identified between GC and their corresponding normal adjacent tissue samples in E-MTAB-1440, GSE79973, GSE19826, GSE13911, GSE27342, GSE33335 and GSE56807 datasets, including 117 up-regulated and 178 down-regulated genes. Among them, 7 vital upregulated genes (HMMR, SPP1, FN1, CCNB1, CXCL8, MAD2L1 and CCNA2) were selected. Most of them had a significantly worse prognosis except SPP1. Using qRT-PCR, we validated that their transcriptions in our GC tumor tissue were upregulated except SPP1 and FN1, which correlated with tumor relapse and predicts poorer prognosis in GC patients.

Conclusions: We have identified 5 upregulated DEGs (HMMR, CCNB1, CXCL8, MAD2L1, and CCNA2) in GC patients with poor prognosis using integrated bioinformatical methods, which could be potential biomarkers and therapeutic targets for GC treatment.

Keywords: Bioinformatics analysis; Differentially expressed genes; Gastric cancer.


Conflict of interest statement

The authors declare no competing interests.

Figures

Fig. 1
Fig. 1
Flowchart of the multistep screening strategy used in this study on bioinformatics data in Arrayexpress and GEO database
Fig. 2
Fig. 2
Data normalization and the distribution of differentially expressed genes (DEGs). (A) Box plots illustrating data normalization: the data distributions were neat after background adjustment and normalization. (B) Principal component analysis (PCA): each point in the PCA diagram represents a sample, and the distance between samples reflects the difference. After batch correction, individuals with similar genetic background were clustered together, and obvious stratification was observed between GC and adjacent normal gastric tissue samples. Gastric cancer, GC. normal controls, NCs
Fig. 3
Fig. 3
Volcano plot and heatmap of DEGs. (A) Volcanic map of DEGs: each colored dot represents a DEG based on the criteria of P < 0.05 and |log FC| > 0.58; red: up-regulation, blue: downregulation, black: normally expressed mRNAs. (B) Heatmap of top 50 significant up-regulated and down-regulated DEGs expressed in mRNAs microarrays. The horizontal axis shows clusters of DEGs, and the right vertical axis represents each sample. Gene expression levels were indicated by colors: red: high expression level and blue: low expression level
Fig. 4
Fig. 4
PPI network of the DEGs in GC. The PPI network of DEGs was constructed using Cytoscape. The nodes meant proteins; the edges meant the interaction of proteins. Upregulated genes are marked in light red; downregulated genes are marked in blue. PPI: protein–protein interaction; DEG: differentially expressed gene; GC: gastric cancer
Fig. 5
Fig. 5
The 9 modules identified in the PPI network. Module analysis via Cytoscape software (degree cutoff = 2, node score cutoff = 0.2, k-core = 2, and max. Depth = 100). Node size represents the degree score; lines represent interactions
Fig. 6
Fig. 6
Seven hub genes selected from PPI network. (A) Hub genes screened by betweenness centrality according to cytoHubba plug-in. (B) Hub genes screened by closeness according to cytoHubba plug-in. (C) Hub genes screened by degree according to cytoHubba plug-in. (D) Venn diagram of DEGs. Hub genes were HMMR, SPP1, FN1, CCNB1, CXCL8, MAD2L1, and CCNA2; PPI, protein–protein interaction
Fig. 7
Fig. 7
Genes associated with patient’s survival outcomes by applying the K-M method. Prognostic curves of most selected genes showed a significantly worse survival rate (P < 0.05). The red lines represent patients with high gene expression, and black lines with a low gene expression. HR: hazard ratio.
Fig. 8
Fig. 8
Differentially expressed genes related with poor prognosis were analyzed using GEPIA website. These genes had significantly upregulated expression in gastric cancers compared to normal specimen (*P < 0.05). The red and gray boxes represent cancer and normal tissues, respectively. STAD: Stomach adenocarcinoma
Fig. 9
Fig. 9
The hub gene-transcription factor (TF) regulatory network. Pink circle stands for the hub gene and orange node stands for the transcription factor
Fig. 10
Fig. 10
Validation of 7 selected gene expression in gastric cancer samples was performed by qRT-PCR analysis. (A) HMMR; (B) SPP1; (C) FN1; (D) CCNB1; (E) CXCL8; (F) MAD2L1; (G) CCNA2. Expression of these DEGs was normalized against GAPDH expression. The statistical significance of differences was calculated by the Student’s t-test

References

    1. Bray F, et al. Global cancer statistics 2018: GLOBOCAN estimates of incidence and mortality worldwide for 36 cancers in 185 countries. CA Cancer J Clin. 2018;68(6):394–424. doi: 10.3322/caac.21492. - DOI - PubMed
    1. Siegel RL, Miller KD, Jemal A. Cancer statistics, 2016. CA Cancer J Clin. 2016;66(1):7–30. doi: 10.3322/caac.21332. - DOI - PubMed
    1. Nagini S. Carcinoma of the stomach: a review of epidemiology, pathogenesis, molecular genetics and chemoprevention. World J Gastrointest Oncol. 2012;4(7):156–169. doi: 10.4251/wjgo.v4.i7.156. - DOI - PMC - PubMed
    1. Vogelstein B, Papadopoulos N, Velculescu VE, Zhou S, Diaz LA, Kinzler KW. Cancer genome landscapes. Science. 2013;339(6127):1546–1558. doi: 10.1126/science.1235122. - DOI - PMC - PubMed
    1. Thomas PD. The gene ontology and the meaning of biological function. Methods Mol Biol. 2017;1446:15–24. doi: 10.1007/978-1-4939-3743-1_2. - DOI - PMC - PubMed