. 2021 Jun 14;20(1):29.
doi: 10.1186/s12942-021-00281-1.

Investigating the drivers of the spatio-temporal heterogeneity in COVID-19 hospital incidence-Belgium as a study case

Affiliations

Investigating the drivers of the spatio-temporal heterogeneity in COVID-19 hospital incidence-Belgium as a study case

Simon Dellicour et al. Int J Health Geogr. .

Abstract

Background: The COVID-19 pandemic is affecting nations globally, but with an impact exhibiting significant spatial and temporal variation at the sub-national level. Identifying and disentangling the drivers of resulting hospitalisation incidence at the local scale is key to predict, mitigate and manage epidemic surges, but also to develop targeted measures. However, this type of analysis is often not possible because of the lack of spatially-explicit health data and spatial uncertainties associated with infection.

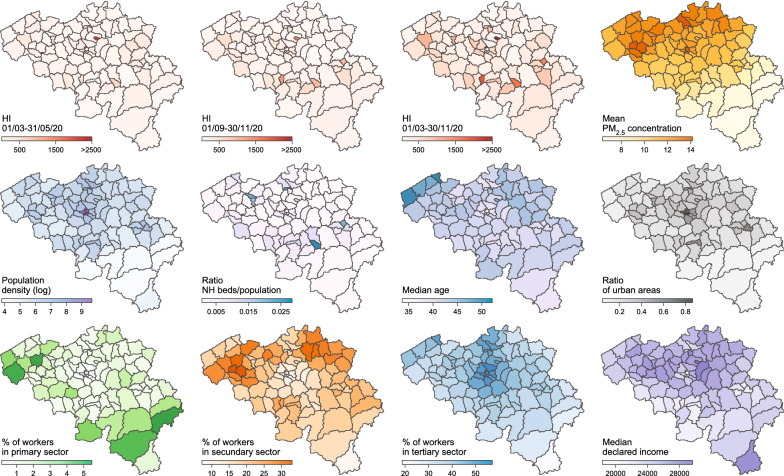
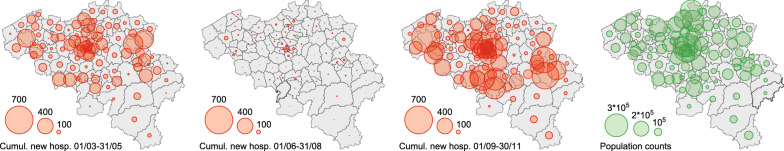
Methods: To overcome these limitations, we propose an analytical framework to investigate potential drivers of the spatio-temporal heterogeneity in COVID-19 hospitalisation incidence when data are only available at the hospital level. Specifically, the approach is based on the delimitation of hospital catchment areas, which allows analysing associations between hospitalisation incidence and spatial or temporal covariates. We illustrate and apply our analytical framework to Belgium, a country heavily impacted by two COVID-19 epidemic waves in 2020, both in terms of mortality and hospitalisation incidence.

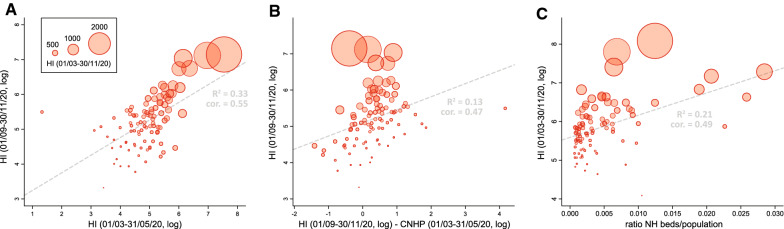
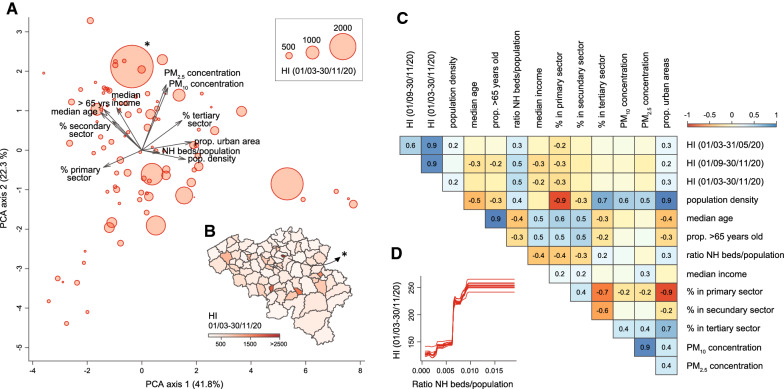
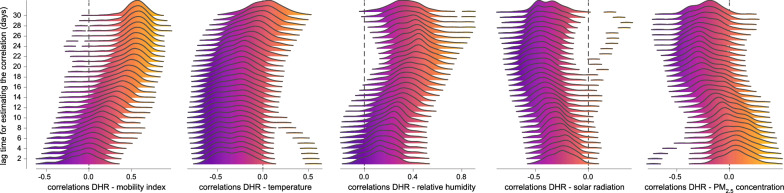
Results: Our spatial analyses reveal an association between the hospitalisation incidence and the local density of nursing home residents, which confirms the important impact of COVID-19 in elderly communities of Belgium. Our temporal analyses further indicate a pronounced seasonality in hospitalisation incidence associated with the seasonality of weather variables. Taking advantage of these associations, we discuss the feasibility of predictive models based on machine learning to predict future hospitalisation incidence.

Conclusion: Our reproducible analytical workflow allows performing spatially-explicit analyses of data aggregated at the hospital level and can be used to explore potential drivers and dynamic of COVID-19 hospitalisation incidence at regional or national scales.

Keywords: Belgium; Boosted regression trees; COVID-19; Hospitalisation incidence; Spatial covariates; Temporal covariates.


Conflict of interest statement

The authors declare no competing interest.

Figures

Fig. 1
Fig. 1
Spatial covariates tested as potential predictors of the heterogeneity in hospitalisation incidence. PM2.5 refers to particulate matter of ≤ 2.5 μm. Median declared income is expressed in euros (€) and was averaged over each HCA (see the Methods section in Additional file for further detail). Mean concentration of particulate matter of ≤ 10 μm (PM10) and proportion of people who are more than 65 years old are not represented but are highly correlated with mean PM2.5 concentration and median age, respectively
Fig. 2
Fig. 2
Spatial distribution of cumulative numbers of new hospitalisations per hospital catchment area (HCA). Cumulative numbers of new hospitalisations are here reported for three distinct periods: 01/03–31/05/2020 (corresponding to the first epidemic wave), 01/06–31/08/2020 (summer period), and 01/09–30/11/2020 (corresponding to the second epidemic wave). The rightmost panel maps the baseline population in each HCA
Fig. 3
Fig. 3
Exploration of the heterogeneity in hospitalisation incidence. The measure of hospitalisation incidence (HI) is computed as the cumulative number of new hospitalisations per 100,000 inhabitants for a given hospital catchment area (HCA) and a given time period. A Association between HI values of the second and first epidemic waves. B Association between HI values of the second epidemic wave and the difference between HI values of the second and first epidemic waves. C Association between HI values computed for the entire epidemic period (01/03–30/11/20) and the ratio between nursing home (NH) beds and population count in each HCA. Dot sizes are proportional to HI values computed for the entire epidemic period under consideration (01/03–30/11/20); R2 and “cor” refer to the coefficient of determination and the Spearman (rank) correlation
Fig. 4
Fig. 4
Analyses of the potential predictors of spatial heterogeneity in hospitalisation incidence (HI). A Principal component analysis (PCA) based on all spatial covariates, each dot corresponding to a distinct hospital catchment area (HCA; see also Additional file 2: Figure S2 for an alternative PCA that also includes HI variables). B Map of HCAs coloured by HI value computed for the entire epidemic period under consideration. C Correlogram reporting Spearman correlations among all spatial covariates and HI values for the three considered periods; only significant correlation values (p-values < 0.05) are reported. D Selected result from the boosted regression trees (BRT) analysis performed with all spatial covariates and HI values computed for the entire epidemic period as response variable: partial responses for HI values for the ratio of nursing home (NH) beds divided by the population in each HCA; i.e., the spatial covariate associated with the highest relative influence in the BRT model (~ 57%; Table 1). (*) indicates a potential HCA outlier discarded for the statistical analyses reported in Additional file 4: Table S2
Fig. 5
Fig. 5
Investigating the drivers of the temporal variability in COVID-19 hospitalisation incidence. Each density plot reports the distribution of correlation values obtained when comparing daily hospitalisation ratios (DHRs) and a specific temporal covariate for the entire epidemic period under consideration (01/03–30/11/20). Each reported distribution gathers 103 correlation values, i.e. one correlation value (Spearman) per hospital catchment area (HCA). In addition, we also report one distribution per lag time considered for estimating the correlation between DHRs and the considered temporal covariate. In practice, we investigated lag times ranging from 1 to 30 days. PM2.5 refers to particle matters ≤ 2.5 μm

References

    1. Zhou P, Yang X-L, Wang X-G, Hu B, Zhang L, Zhang W, et al. A pneumonia outbreak associated with a new coronavirus of probable bat origin. Nat Publishing Group. 2020;579:270–273. - PMC - PubMed
    1. Zhu N, Zhang D, Wang W, Li X, Yang B, Song J, et al. A novel coronavirus from patients with pneumonia in China, 2019. N Engl J Med. 2020;382:727–733. doi: 10.1056/NEJMoa2001017. - DOI - PMC - PubMed
    1. McKee M, Stuckler D. If the world fails to protect the economy, COVID-19 will damage health not just now but also in the future. Nat Med Nature Publishing Group. 2020;26:640–642. doi: 10.1038/s41591-020-0863-y. - DOI - PubMed
    1. Holmes EA, O’Connor RC, Perry VH, Tracey I, Wessely S, Arseneault L, et al. Multidisciplinary research priorities for the COVID-19 pandemic: a call for action for mental health science. Lancet Psychiatry Elsevier. 2020;7:547–560. doi: 10.1016/S2215-0366(20)30168-1. - DOI - PMC - PubMed
    1. Pereira RHM, Braga CKV, Servo LM, Serra B, Amaral P, Gouveia N, et al. Geographic access to COVID-19 healthcare in Brazil using a balanced float catchment area approach. Soc Sci Med. 2021;273:113773. doi: 10.1016/j.socscimed.2021.113773. - DOI - PMC - PubMed

Publication types