. 2021 Jul 1;81(13):3480-3494.
doi: 10.1158/0008-5472.CAN-20-2936. Epub 2021 Jun 14.

Loss of SDHB Promotes Dysregulated Iron Homeostasis, Oxidative Stress, and Sensitivity to Ascorbate

Affiliations

Loss of SDHB Promotes Dysregulated Iron Homeostasis, Oxidative Stress, and Sensitivity to Ascorbate

Judith Goncalves et al. Cancer Res. .

Abstract

Succinate dehydrogenase is a key enzyme in the tricarboxylic acid cycle and the electron transport chain. All four subunits of succinate dehydrogenase are tumor suppressor genes predisposing to paraganglioma, but only mutations in the SDHB subunit are associated with increased risk of metastasis. Here we generated an Sdhd knockout chromaffin cell line and compared it with Sdhb-deficient cells. Both cell types exhibited similar SDH loss of function, metabolic adaptation, and succinate accumulation. In contrast, Sdhb-/- cells showed hallmarks of mesenchymal transition associated with increased DNA hypermethylation and a stronger pseudo-hypoxic phenotype compared with Sdhd-/- cells. Loss of SDHB specifically led to increased oxidative stress associated with dysregulated iron and copper homeostasis in the absence of NRF2 activation. High-dose ascorbate exacerbated the increase in mitochondrial reactive oxygen species, leading to cell death in Sdhb-/- cells. These data establish a mechanism linking oxidative stress to iron homeostasis that specifically occurs in Sdhb-deficient cells and may promote metastasis. They also highlight high-dose ascorbate as a promising therapeutic strategy for SDHB-related cancers. SIGNIFICANCE: Loss of different succinate dehydrogenase subunits can lead to different cell and tumor phenotypes, linking stronger 2-OG-dependent dioxygenases inhibition, iron overload, and ROS accumulation following SDHB mutation.


Conflict of interest statement

Conflict of interest disclosure statement: the authors declare no potential conflicts of interest

Figures

Figure 1
Figure 1. Generation of Sdhd-deficient immortalized mouse chromaffin cells.
A, Electrophoregrams of Sanger sequencing of the exon 3 of Sdhd gene showing both homozygous point mutations c.119delC and c.120_121delCA of ClA and ClB respectively compared to a control DNA (WT). B, Western-blot showing SDHB protein expression in all cell types. C, Spectrophotometrical measurement of SDH activity. Steady-state assessment of TCA cycle organic acids (D, succinate, E, fumarate and F, α-ketoglutarate). Results shown are from at least three independent experiments, presented as mean ± SEM. In C-F, One-way ANOVA was used to assess statistical significance. ns, not significant, *P≤0.05, **P≤0.01, ***P≤0.001.
Figure 2
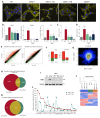
Figure 2. Metabolic and respiratory profiles of Sdhd-deficient imCC and Sdhb-/- cells.
A, Diagram describing the incorporation of carbons from glucose through PDH (blue) or PCX (red) enzymes activity. Abbreviations in metabolic diagram: PDH, pyruvate dehydrogenase; PCX, pyruvate carboxylase; AcCoA, acetyl coenzyme A. B, Incorporation of 13C into succinate, aspartate and citrate in stated cell lines. Isotopomers 13C atoms are shown as filled circles, whereas 12C atoms are empty circles. C, Incorporation of 13C5-glutamine into succinate, aspartate and citrate in indicated cell lines and D, the associated diagrammatic representation of their oxidative (blue) and reductive (red) metabolism. E, Oxygen consumption (respiration) of intact and F, permeabilized (CI + CII) cells. ETS refers to electron transfer system capacity and basal respiration to oxygen consumption in non-permeabilised cells. G, Lactate production over time. Results shown are from at least three independent experiments, presented as mean ± SEM. Two-way ANOVA was performed; ns, not significant, *P≤0.05, **P≤0.01, ***P≤0.001 relative to WT and $P≤0.05, $$$P≤0.001 relative to Sdhb-/- imCC.
Figure 3
Figure 3. Sdhb, but not Sdhd knockout in mouse chromaffin cells initiates a mesenchymal phenotype associated with stronger 2OG-dependent dioxygenases inhibition.
A, Actin staining in the indicated cell lines. B, qRT-PCR analysis of known epithelial-to-mesenchymal markers (Snai1, Mmp9, Fn1). C, Quantification of cell adhesion 1h after plating. D, Collective migration assessed after 10h in the stated cell lines, represented as the closure percentage of the wound. E, Scatterplot representative of methylation rates identified by RRBS in Sdhb-/- versus WT cells and Sdhd-/- versus WT cells, respectively. F, number of differentially methylated features in Sdhb-/- and Sdhd-/- imCC (versus WT) in TSS500 and gene body regions. G, Comparison of methylation changes generated by Sdhd and Sdhb knockout in imCC. H, Number and overlap of differentially methylated features in Sdhb-/- compared with Sdhd-/- imCCs. I, Western blot of HIF2α in total cellular extracts of indicated cell lines. J, Heatmap representation of transcriptome-based classification of imCCs according to their genotype resulting in hierarchical clustering. K, Number and overlap of overexpressed hypoxia-inducible genes from a selected list of 47 genes in Sdhb-/- and Sdhd-/- imCCs compared with WT cells. L, Relative expression levels of overexpressed hypoxia-inducible genes in Sdhb-/- and Sdhd-/- imCCs compared with WT. In A, B, C, D and E data shown are from at least three independent experiments, presented as mean ± SEM. K and L data are mean expression levels from RNAseq data generated in 3 Sdhb-/-, 2 WT and 2 Sdhd-/- clones. One-way ANOVA was used to assess statistical significance; ns, not significant, **P≤0.01, ***P≤0.001 relative to WT and $$$P≤0.001 relative to Sdhb-/- imCC.
Figure 4
Figure 4. SDH-deficient cells exhibit significant alterations in iron homeostasis, notably marked in Sdhb KO cells.
A, Flow cytometry analysis of labile overall iron content in each cell line. B, Representative 56Fe images generated by LA-ICP-MS in one NF1-mutated human pheochromocytoma C, one SDHB-mutated pheochromocytoma D, one SDHB-mutated paraganglioma and E, one SDHD-mutated paraganglioma. Images are displayed using the same threshold to enable a direct visual comparison between tumor sections. Average 56Fe counts in 2 NF1, 2 RET, 4 SDHB and 2 SDHD tumors are shown in F. G, Cytosolic Iron(II) content, H, mitochondrial Iron(II) content. I, Heatmap representation of the expression profiles of several critical actors of iron/copper homeostasis in Sdhb-/-, WT and Sdhd-/- cells, using mean level values to perform unsupervised classification. J, Diagram highlighting the role played by some iron and copper transporters (DMT1, Slc25a37, CTR1 and Slc25a3) explaining the major alterations induced by Sdhb KO in their iron and copper cellular homeostasis. Data shown in A, G and H are from three independent experiments, presented as mean ± SEM. Non-parametric one-way ANOVA was used to assess statistical significance; ns, not significant, *P≤0.05, **P≤0.01, ***P≤0.001.
Figure 5
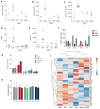
Figure 5. SDHB-deficient cells display increased ROS levels without activation of the NRF2 pathway.
A, Specific MFI using CellROX probe in all imCC cell types. Similar assays were carried out using B, Mitosox C, Bodipy C11 probe D, TMRM and E, Mitotracker probes. F, RNA-seq analysis showing the mRNA levels of the different forms of superoxide dismutase (cytoplasmic SOD1, mitochondrial and extracellular SOD3) and catalase. G, Specific MFI of MitoSOX probe in all imCC models following N-acetyl-cysteine (NAC) treatment (3 mM) for 48h. H, Cell survival percentage of indicated cell lines after treatment with 3 mM of NAC in comparison to vehicle-treated controls for 48h. I, Heatmap representation of the expression of 58 NRF2-target genes through the transcriptome data of the COMETE collection of human PPGL. Mean values of NRF2 targets levels in the groups of sporadic non-mutated tumors (n=49), RET- (n=19), NF1- (n=37), VHL- (n=40), SDHA, C, D- (n=6) and SDHB-mutated tumors (n=17) were used to perform unsupervised classification. Data shown in A, B, C, D and E each dot is representative of an independent experiment (n=4), bar plots show means ± SEM. One-way ANOVA was used to assess statistical significance; ns, not significant, *P≤0.05, **P≤0.01, ***P≤0.001 relative to WT and $P≤0.05 relative to Sdhb-/- imCC. In G and H results shown are from at least three independent experiments and presented as means ± SEM. To assess statistical significance in F, G and H, Two-way ANOVA was used; ns, not significant, *P≤0.05, ***P≤0.001.
Figure 6
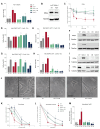
Figure 6. Modulation of Iron(II) and ROS levels affects HIF2α stabilization and survival in Sdhb-deficient cells.
A, Specific MFI of MitoSOX probe in all imCC models following treatment for 48h with either Iron(II) 50μM or vehicle. B, Western blot of HIF2α in total cellular extracts of Sdhb-/- imCCs not-treated (NT) or treated for 48h with Iron(II) (Fe2+). C, Dose-response curves showing cell survival of all cell types following 48h of treatment with Iron(II). D, Specific MFI of CellROX probe in all imCC models following treatment for 12 hours with MitoTEMPO (MTT) 2.5 μM in comparison to NT cells. E, Same as D, using MitoSOX probe. F, Western blot of HIF2α in total cellular extracts NT or treated for 12h with 2.5 μM MTT. G, Same as D, after treatment with MTT 2.5 mM. H, Same as G, using MitoSOX probe. I, Same as F, after treatment for 12h with 2.5 mM MTT. J, Cell morphology following treatment for 12h with MTT 2.5 mM. K, Same as C following Ascorbate treatment. L, Time-response curves showing cell survival of all imCC models after treatment with 2.5 mM ascorbate. M, Specific MFI of MitoSOX probe in all imCC models following treatment for 48h with either ascorbate 1mM or vehicle. Data for C, K, and L are all relative to vehicle-treated controls and presented as means ± SEM (n = 3 independent experiments, with 3 technical replicates/experiment). Data from A, and M are mean of at least three independent experiments and data from D, E, G, and H are mean of at least two independent experiments. Data are presented as mean ± SEM and two-way ANOVA was performed; ns, not significant, *P≤0.05, ***P≤0.001.

References

    1. Baysal BE, Ferrell RE, Willett-Brozick JE, Lawrence EC, Myssiorek D, Bosch A, et al. Mutations in SDHD, a mitochondrial complex II gene, in hereditary paraganglioma. Science. 2000;287:848–51. - PubMed
    1. Astuti D, Latif F, Dallol A, Dahia PL, Douglas F, George E, et al. Gene mutations in the succinate dehydrogenase subunit SDHB cause susceptibility to familial pheochromocytoma and to familial paraganglioma. Am J Hum Genet. 2001;69:49–54. doi: 10.1086/321282. - DOI - PMC - PubMed
    1. Burnichon N, Briere JJ, Libe R, Vescovo L, Riviere J, Tissier F, et al. SDHA is a tumor suppressor gene causing paraganglioma. Hum Mol Genet. 2010;19:3011–20. doi: 10.1093/hmg/ddq206. - DOI - PMC - PubMed
    1. Niemann S, Muller U. Mutations in SDHC cause autosomal dominant paraganglioma, type 3. Nat Genet. 2000;26:268–70. - PubMed
    1. Pasini B, Stratakis CA. SDH mutations in tumorigenesis and inherited endocrine tumours: lesson from the phaeochromocytoma-paraganglioma syndromes. Journal of internal medicine. 2009;266:19–42. doi: 10.1111/j.1365-2796.2009.02111.x. - DOI - PMC - PubMed

Publication types