. 2021 Jun 14;12(1):3594.
doi: 10.1038/s41467-021-23853-y.

Source sector and fuel contributions to ambient PM2.5 and attributable mortality across multiple spatial scales

Affiliations

Source sector and fuel contributions to ambient PM2.5 and attributable mortality across multiple spatial scales

Erin E McDuffie et al. Nat Commun. .

Abstract

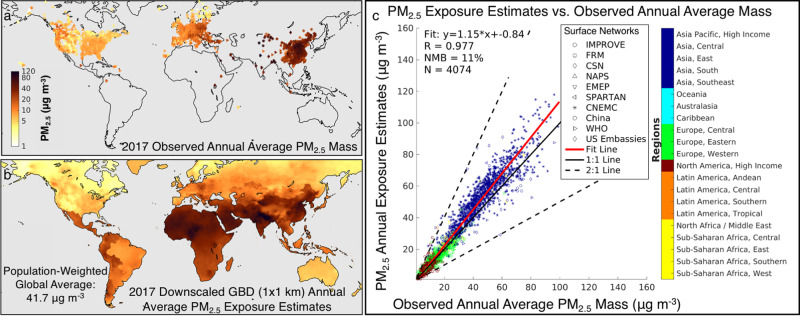
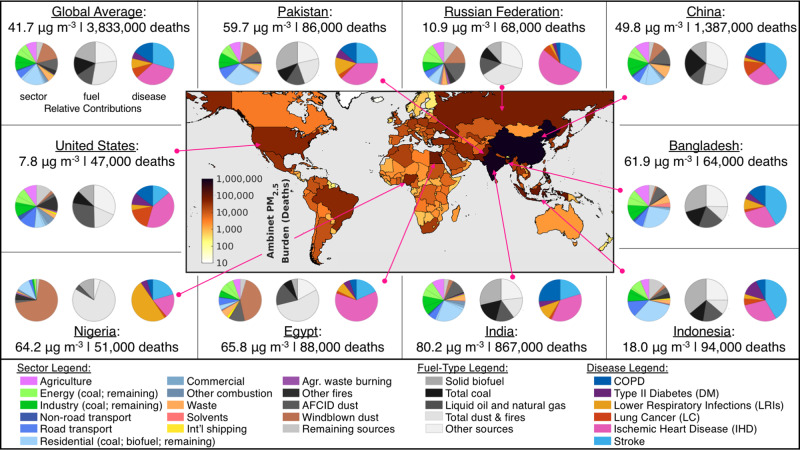
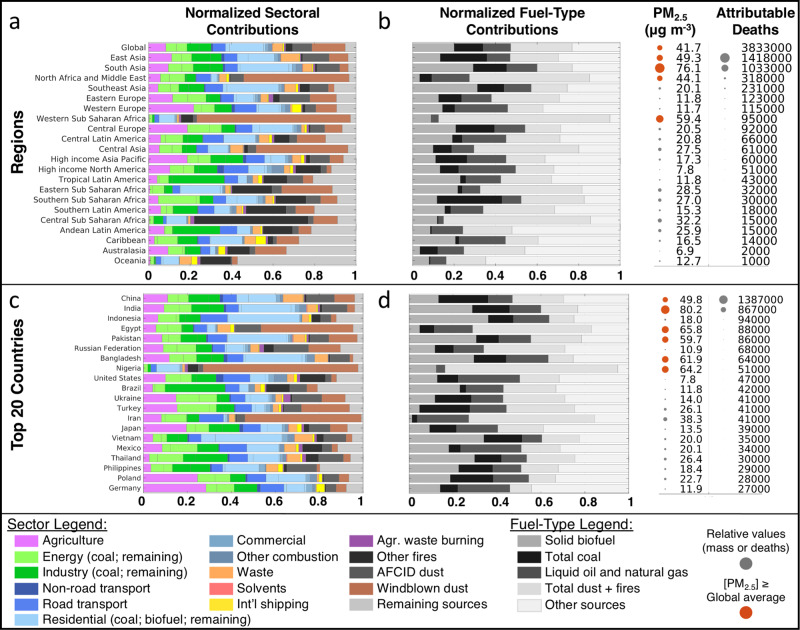
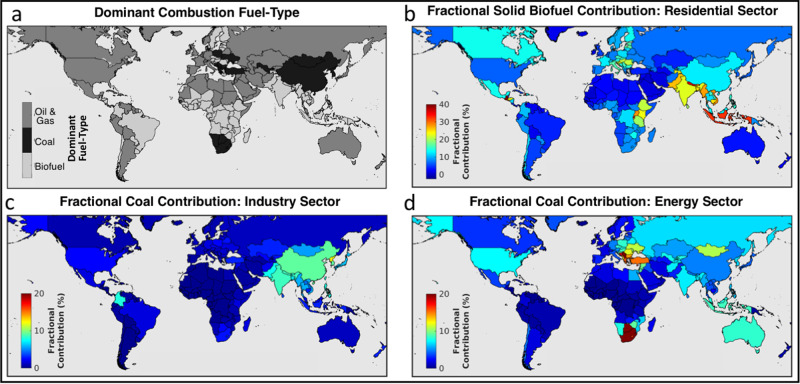
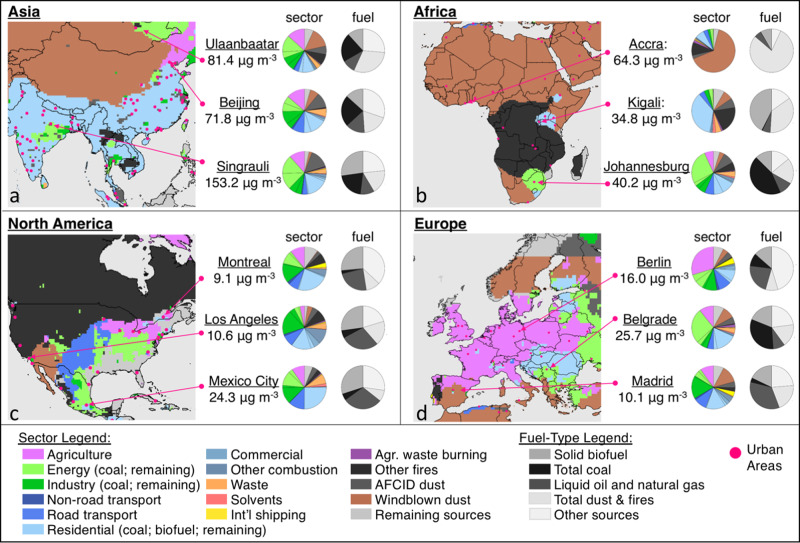
Ambient fine particulate matter (PM2.5) is the world's leading environmental health risk factor. Reducing the PM2.5 disease burden requires specific strategies that target dominant sources across multiple spatial scales. We provide a contemporary and comprehensive evaluation of sector- and fuel-specific contributions to this disease burden across 21 regions, 204 countries, and 200 sub-national areas by integrating 24 global atmospheric chemistry-transport model sensitivity simulations, high-resolution satellite-derived PM2.5 exposure estimates, and disease-specific concentration response relationships. Globally, 1.05 (95% Confidence Interval: 0.74-1.36) million deaths were avoidable in 2017 by eliminating fossil-fuel combustion (27.3% of the total PM2.5 burden), with coal contributing to over half. Other dominant global sources included residential (0.74 [0.52-0.95] million deaths; 19.2%), industrial (0.45 [0.32-0.58] million deaths; 11.7%), and energy (0.39 [0.28-0.51] million deaths; 10.2%) sectors. Our results show that regions with large anthropogenic contributions generally had the highest attributable deaths, suggesting substantial health benefits from replacing traditional energy sources.


Conflict of interest statement

The authors declare no competing interests.

Figures

Fig. 1
Fig. 1. Evaluation of PM2.5 exposure estimates relative to surface observations.
a Annual average observations of total PM2.5 mass in the year 2017; symbol shapes correspond to monitor network. b Annual PM2.5 exposure estimates for 2017, downscaled to 0.01° × 0.01° resolution. c Correlation between the 2017 exposure estimates and observed annual average concentrations, colored by Global Burden of Disease (GBD) region (Supplementary Table 1); symbol shape corresponds to the observation network; correlation slope, intercept, coefficient, normalized mean bias (NMB), and number of observation points are provided. (NMB = 100*Σ (exposure estimate−observations)/Σ observations).
Fig. 2
Fig. 2. Absolute ambient PM2.5 burden and fractional sector, fuel, and disease contributions for the global average and top nine countries.
Map: National-level outdoor PM2.5 disease burden in 2017 (from the 2019 Global Burden of Disease concentration-response relationships). Panels: Annual average population-weighted PM2.5 exposure levels and attributable mortality (rounded to the nearest 1000). (Left pie charts) fractional sectoral source contributions. ‘Other fires’ include deforestation, boreal forest, peat, savannah, and temperate forest fires. ‘Remaining sources’ include volcanic SO2, lightning NOx, biogenic soil NO, aircraft emissions, and oceanic and biogenic sources (Supplementary Table 2). Energy and industry sectors also include separate contributions from coal use (first wedge, counterclockwise). The residential sector separates the contributions from coal (first wedge) and solid biofuel (second wedge). (middle pie charts) fuel-type contributions. The ‘total dust & fires’ category is the sum of windblown and AFCID (anthropogenic fugitive, combustion, and industrial) dust, agricultural waste burning, and other fires. Other sources are primarily from non-combustion or uncategorized combustion sources (agriculture, solvents, biogenic SOA, waste incineration, etc.). (Right pie charts) Relative disease contributions (not including pre-term birth and low birth weight). Supplementary Data 1 and 2 provide all data in this figure, including the number of neonatal incidences.
Fig. 3
Fig. 3. Relative (fractional) source and fuel contributions to annual population-weighted mean PM2.5 mass and attributable deaths in 2017.
a, c Normalized sectoral source contributions for 21 world regions and the global average (a) and top 20 countries (c). Sorted by decreasing number of ambient PM2.5-attributable deaths (rounded to the nearest 1000). b, d Normalized contributions from the combustion of three fuel categories and remaining PM2.5 sources. To the right of b and d, annual population-weighted mean PM2.5 concentrations and associated attributable deaths are provided for each region/country. Relative amounts are illustrated by relative dot sizes. Concentrations above or equal to the global average are colored red.
Fig. 4
Fig. 4. Fractional contributions from select combustion fuel types and sectors.
a The combustion fuel-type with the largest relative contribution to PM2.5 mass and mortality in each country. bd The fractional contributions from solid biofuel combustion in the residential sector (b), coal combustion in the industry sector (c), and coal combustion in the energy sector (d). Note the color scale change between (b) and (c, d).
Fig. 5
Fig. 5. Sub-national sources of PM2.5 mass and attributable mortality.
Results are shown for (a) Asia, (b) Africa, (c) North America, and (d) Europe. Maps illustrate the single source with the largest contribution in each model grid cell (0.5° × 0.625°). Population-weighted mean PM2.5 concentrations (calculated from 0.01° × 0.01° PM2.5 exposure estimates) and regional fractional source contributions are also shown for a select sub-set of sub-national regions, identified by the name of the nearest major city.

References

    1. GBD 2019 Risk Factor Collaborators. Global burden of 87 risk factors in 204 countries and territories, 1990–2019: a systematic analysis for the Global Burden of Disease Study 2019. Lancet. 2020;396:1223–1249. doi: 10.1016/S0140-6736(20)30752-2. - DOI - PMC - PubMed
    1. Yokelson RJ, et al. Emissions from biomass burning in the Yucatan. Atmos. Chem. Phys. 2009;9:5785–5812. doi: 10.5194/acp-9-5785-2009. - DOI
    1. Johnston FH, et al. Estimated global mortality attributable to smoke from landscape fires. Environ. Health Perspect. 2012;120:695–701. doi: 10.1289/ehp.1104422. - DOI - PMC - PubMed
    1. Reid, J. S. et al. Comparison of size and morphological measurements of coarse mode dust particles from Africa. J. Geophys. Res. Atmos.10.1029/2002JD002485 (2003).
    1. Bond, T. C. et al. Historical emissions of black and organic carbon aerosol from energy-related combustion, 1850–2000. Global Biogeochem. Cycles10.1029/2006GB002840 (2007).

Publication types