Multicenter Study
. 2021 Jun 14;12(1):3601.
doi: 10.1038/s41467-021-23859-6.

Integrated omics endotyping of infants with respiratory syncytial virus bronchiolitis and risk of childhood asthma

Affiliations
Multicenter Study

Integrated omics endotyping of infants with respiratory syncytial virus bronchiolitis and risk of childhood asthma

Yoshihiko Raita et al. Nat Commun. .

Abstract

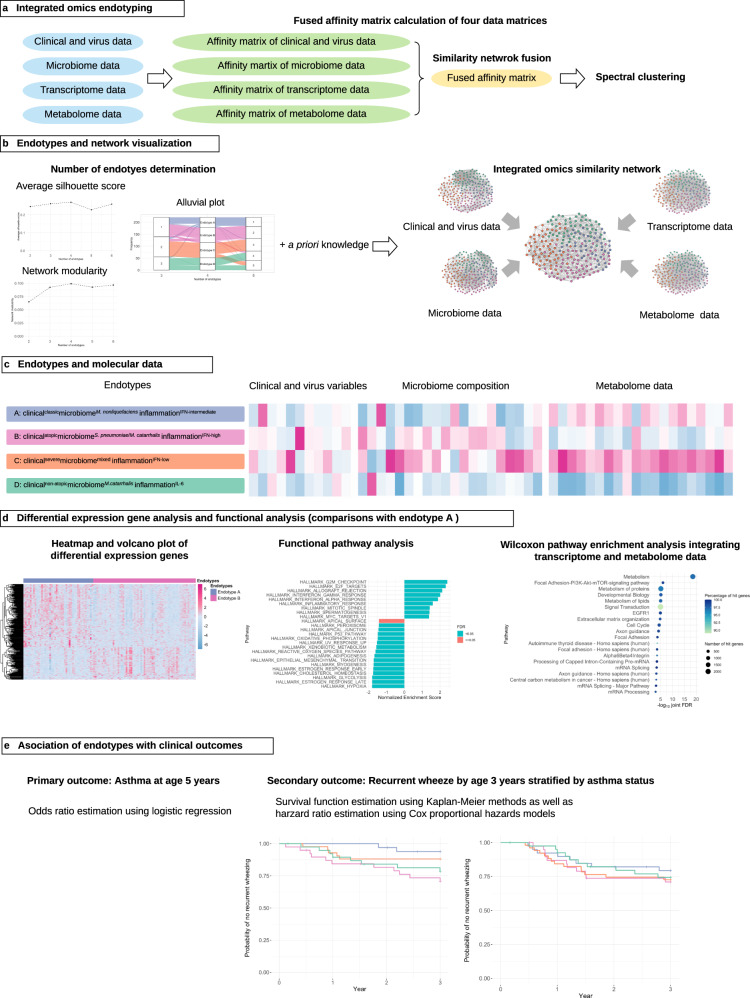
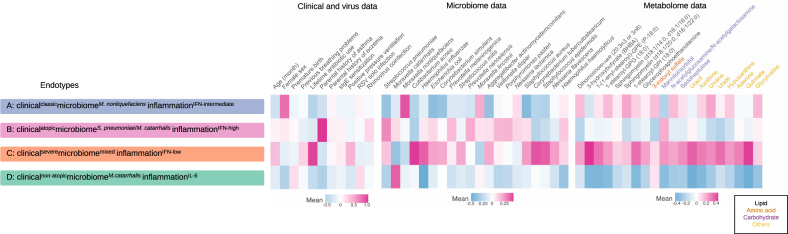
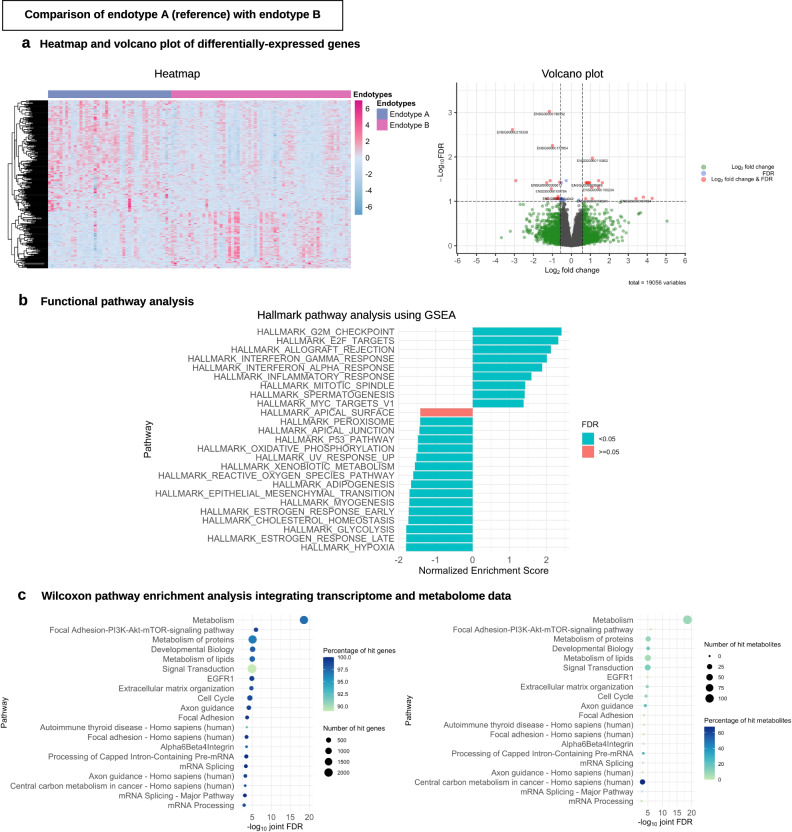
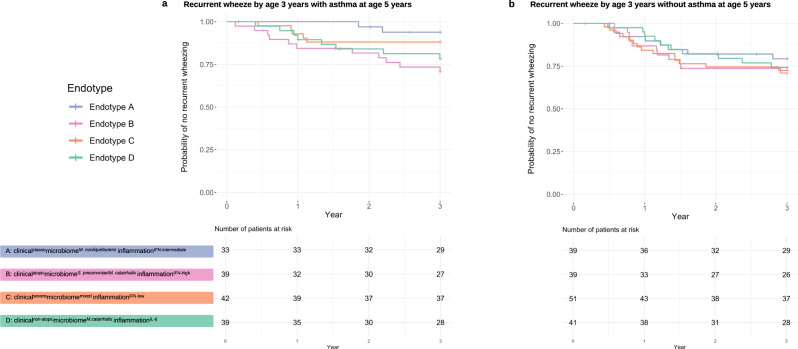
Respiratory syncytial virus (RSV) bronchiolitis is not only the leading cause of hospitalization in U.S. infants, but also a major risk factor for asthma development. While emerging evidence suggests clinical heterogeneity within RSV bronchiolitis, little is known about its biologically-distinct endotypes. Here, we integrated clinical, virus, airway microbiome (species-level), transcriptome, and metabolome data of 221 infants hospitalized with RSV bronchiolitis in a multicentre prospective cohort study. We identified four biologically- and clinically-meaningful endotypes: A) clinicalclassicmicrobiomeM. nonliquefaciensinflammationIFN-intermediate, B) clinicalatopicmicrobiomeS. pneumoniae/M. catarrhalisinflammationIFN-high, C) clinicalseveremicrobiomemixedinflammationIFN-low, and D) clinicalnon-atopicmicrobiomeM.catarrhalisinflammationIL-6. Particularly, compared with endotype A infants, endotype B infants-who are characterized by a high proportion of IgE sensitization and rhinovirus coinfection, S. pneumoniae/M. catarrhalis codominance, and high IFN-α and -γ response-had a significantly higher risk for developing asthma (9% vs. 38%; OR, 6.00: 95%CI, 2.08-21.9; P = 0.002). Our findings provide an evidence base for the early identification of high-risk children during a critical period of airway development.


Conflict of interest statement

The authors declare no competing interests.

Figures

Fig. 1
Fig. 1. Analytic workflow of integrated omics endotyping.
a After an affinity matrix of each dataset (clinical and virus, microbiome, transcriptome, and metabolome) was separately computed, and a fused affinity matrix was generated by similarity network fusion. Then, the fused affinity matrix was used to identify mutually exclusive endotypes by spectral clustering. b A combination of average silhouette scores, network modularity, and clinical plausibility (in addition to endotype size) was used to choose the optimal number of endotypes. The concordance between the different numbers of endotypes was also examined. After deriving endotypes, a similarity network was visualized. c Between four derived endotypes of RSV bronchiolitis, the differences in the major clinical and virus variables, nasopharyngeal microbiome, and metabolome were visualized using heatmap. d Differentially expressed genes (endotype A as the reference group) were visualized using a heatmap and volcano plot. The functional pathway analysis using the gene set enrichment analysis and the Wilcoxon pathway enrichment analysis integrating transcriptomic and metabolome data were conducted to identify enriched pathways. e The risk of childhood asthma (binary outcome) was modeled by fitting a logistic regression model. The rate of recurrent wheeze (time-to-event outcome) was modeled by fitting a Cox proportional hazards model. RSV respiratory syncytial virus, IFN interferon, IL interleukin.
Fig. 2
Fig. 2. Between-endotype differences in clinical variables, virus, nasopharyngeal microbiome, and nasopharyngeal metabolome data in infants with respiratory syncytial virus bronchiolitis.
To visualize the between-endotype differences, the clinical variables and viruses are treated as numeric variables and processed by autoscaling. The microbiome data (20 most abundant species) are processed by log2 transformation and autoscaling. The metabolome data (20 metabolites with the highest normalized mutual information score) are processed by log2 transformation with batch effect adjustment and autoscaling. RSV respiratory syncytial virus, IFN interferon, IL interleukin, sIgE specific immunoglobulin E.
Fig. 3
Fig. 3. Relationship between major clinical variables and endotypes.
a Chord diagram showing major clinical variables by endotype. The ribbons connect from the individual endotypes to the major clinical and virus characteristics. The width of the ribbon represents the proportion of infants within the endotype who have the corresponding clinical or virus characteristic. Then, it was scaled to a total of 100%. For example, the endotype B infants (light red) had a high proportion of parental asthma, IgE sensitization, and coinfection with rhinovirus. Endotype C (light orange) infants had a high proportion of lifetime antibiotics use and positive pressure ventilation use during the index hospitalization for bronchiolitis. b Venn diagram of three major clinical variables (parental history of asthma, IgE sensitization, rhinovirus infection) and their intersections. The Venn diagram illustrates the composition of three major clinical variables and their intersections. The numbers correspond to the number of infants in each subset and intersection. c Upset plot corresponding to the presented Venn diagram. The plot illustrates the composition of three major clinical variables and their intersections visualized based on the four endotypes. Vertical stacked bar charts reflect the number of infants within each subset and intersection colored according to the endotypes. Horizontal bars indicate the number of infants in each clinical variable set. Black dots indicate the sets of subsets and intersections; connecting lines indicate relevant intersections related to each stacked bar chart.
Fig. 4
Fig. 4. Between-endotype differences in the abundance of the ten most abundant nasopharyngeal microbial species.
The boxplots show the distribution of the ten most abundant microbial species of the nasopharyngeal microbiome, according to the four endotypes. The differences in relative abundance (scale of 0–1) among the four endotypes (endotype A, 43 samples; endotype B, 63 samples; endotype C, 63 samples; and endotype D, 52 samples) were tested by Kruskal–Wallis test. center lines indicate median values. Box limits indicate upper and lower quartiles. Whiskers indicate 1.5 × interquartile ranges. Points indicate outliers. Exact P values and false discovery rates (FDRs) are the following: Streptococcus pneumoniae, P value = 0.0051, FDR = 0.013; Moraxella catarrhalis, P value = 4.1 × 10−5, FDR = 0.00014; Moraxella nonliquefaciens, P value = 0.014, FDR = 0.028; Cutibacterium acnes; P value = 2.4 × 10−5, FDR = 0.00012; Haemophilus influenzae, P value = 2.0 × 10−5, FDR = 0.00012; Escherichia coli, P value = 0.029, FDR = 0.042; Corynebacterium simulans, P value = 0.029, FDR = 0.042; Prevotella melaninogenica, P value = 0.22, FDR = 0.22; Streptococcus mitis, P value = 0.15, FDR = 0.18; and Prevotella nanceiensis, P value = 0.17, FDR = 0.18. FDR false discovery rate.
Fig. 5
Fig. 5. Differential gene expression analysis and functional pathway analysis in the endotypes A vs. B comparison.
a Heatmap and volcano plot of differentially expressed genes. For the heatmap (left), we selected 300 genes with the most significant P value (two-sided raw P value) and the color bar indicates the scaled value of variance stabilizing transformation. For the volcano plot (right), the threshold of log2 fold change is |0.58| (i.e., ≥|1.5|-fold change) and that of FDR < 0.1. There were 29 differentially expressed genes that met these criteria. Of these, 11 Ensemble gene ids are annotated in the volcano plot due to space availability. These genes are presented in Supplementary Table 4. b Functional pathway analysis. For the functional class scoring analysis (left), we selected 25 pathways with the highest absolute value of normalized enriched score to visualize the plot. c Wilcoxon pathway enrichment analysis integrating transcriptome and metabolome data. For the Wilcoxon pathway enrichment analysis, we selected 20 pathways with the most significant joint FDR, and showed the numbers and proportions of hit genes (left) and metabolites (right) for the corresponding pathways. GSEA gene set enrichment analysis, FDR false discovery rate.
Fig. 6
Fig. 6. Kaplan–Meier curves for development of recurrent wheeze by age 3 years, according to respiratory syncytial virus bronchiolitis endotypes.
a Recurrent wheeze by age 3 years with asthma at age 5 years. Overall, the survival curves significantly differed across the endotypes (Plog-rank = 0.049). Compared with endotype A (clinicalclassicmicrobiomeM. nonliquefaciensinflammationIFN-intermediate) infants, the rate of developing recurrent wheeze by age 3 years was not significantly different in endotype C or D infants. By contrast, the rate was significantly higher in endotype B (clinicalatopicmicrobiomeS. pneumoniae/M. catarrhalisinflammationIFN-high) infants (HR 5.50; 95% CI 1.22–24.8; P = 0.03). Corresponding hazards ratio estimates are presented in Table 2. b Recurrent wheeze by age 3 years without asthma at age 5 years. The survival curves did not significantly differ across the endotypes (Plog-rank = 0.84). Compared with endotype A infants, the rate of developing recurrent wheeze by age 3 years was not significantly different in endotype B, C, or D. Corresponding hazards ratio estimates are presented in Table 2. RSV respiratory syncytial virus, IFN interferon, IL interleukin.

References

    1. Fujiogi, M. et al. Trends in bronchiolitis hospitalizations in the United States: 2000–2016. Pediatrics144, (2019). - PMC - PubMed
    1. Hasegawa K, Dumas O, Hartert TV, Camargo CA. Advancing our understanding of infant bronchiolitis through phenotyping and endotyping: clinical and molecular approaches. Expert Rev. Respiratory Med. 2016;10:891–899. doi: 10.1080/17476348.2016.1190647. - DOI - PMC - PubMed
    1. Abreo, A., Gebretsadik, T., Stone, C. A. & Hartert, T. V. The impact of modifiable risk factor reduction on childhood asthma development. Clin. Transl. Med. 7, 1–12 (2018). - PMC - PubMed
    1. Scheltema NM, et al. Global respiratory syncytial virus-associated mortality in young children (RSV GOLD): a retrospective case series. Lancet Glob. Heal. 2017;5:e984–e991. doi: 10.1016/S2214-109X(17)30344-3. - DOI - PMC - PubMed
    1. Hasegawa K, et al. Association of rhinovirus C bronchiolitis and immunoglobulin E sensitization during infancy with development of recurrent wheeze. JAMA Pediatr. 2019;173:544–552. doi: 10.1001/jamapediatrics.2019.0384. - DOI - PMC - PubMed

Publication types

MeSH terms