. 2021 Jun 14;12(1):3609.
doi: 10.1038/s41467-021-23885-4.

The insulo-opercular cortex encodes food-specific content under controlled and naturalistic conditions

Affiliations

The insulo-opercular cortex encodes food-specific content under controlled and naturalistic conditions

Yuhao Huang et al. Nat Commun. .

Abstract

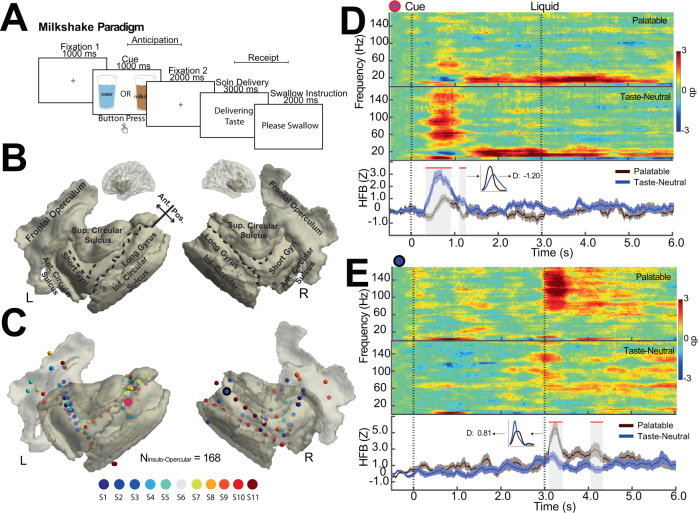
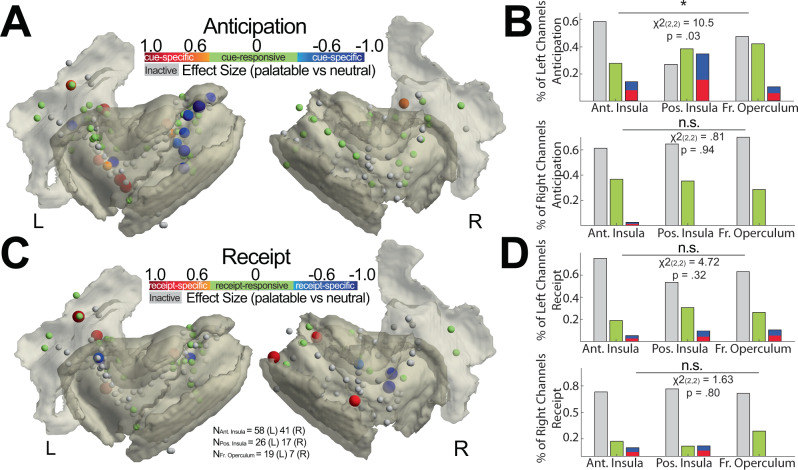
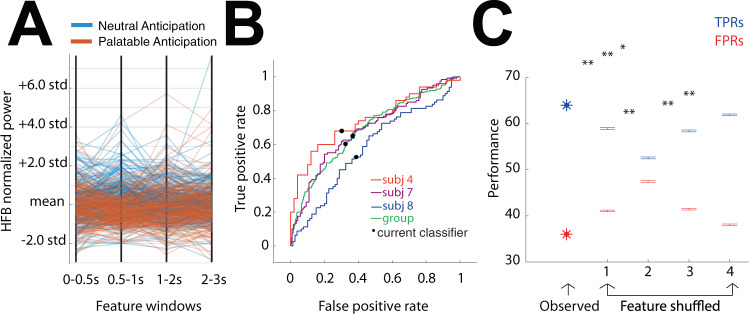
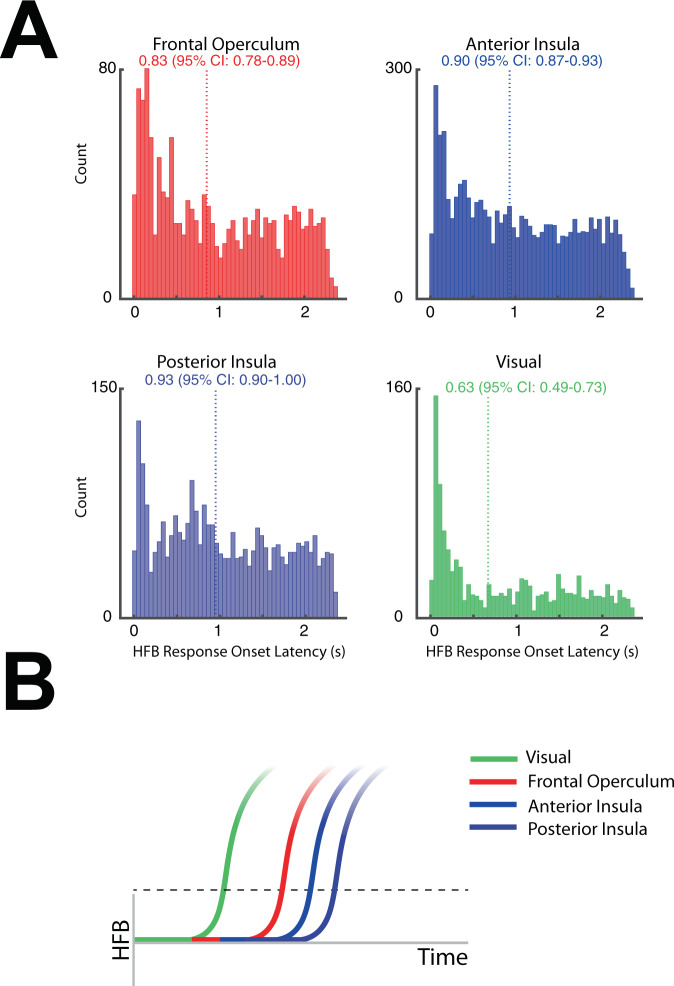
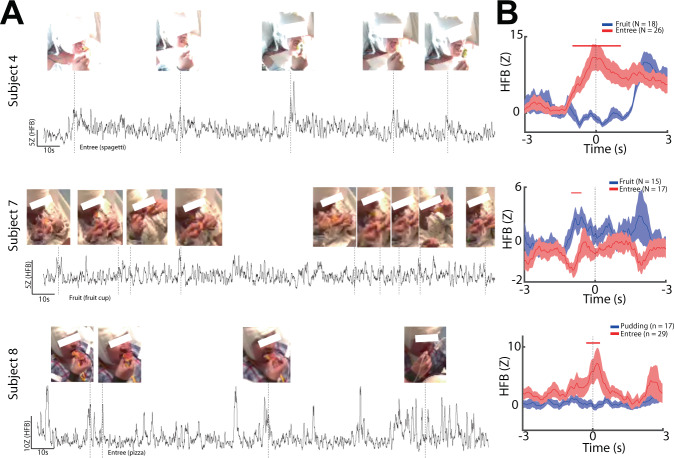
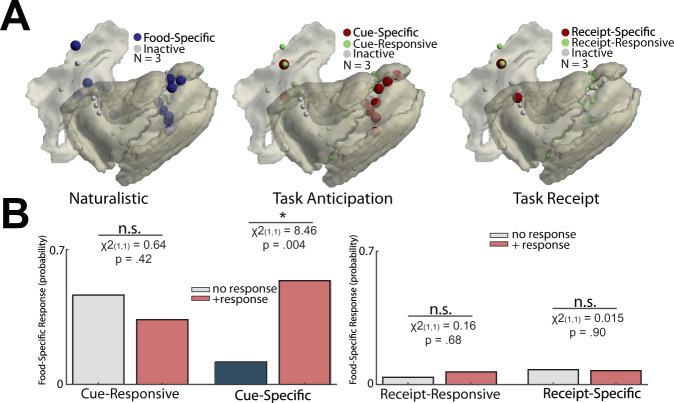
The insulo-opercular network functions critically not only in encoding taste, but also in guiding behavior based on anticipated food availability. However, there remains no direct measurement of insulo-opercular activity when humans anticipate taste. Here, we collect direct, intracranial recordings during a food task that elicits anticipatory and consummatory taste responses, and during ad libitum consumption of meals. While cue-specific high-frequency broadband (70-170 Hz) activity predominant in the left posterior insula is selective for taste-neutral cues, sparse cue-specific regions in the anterior insula are selective for palatable cues. Latency analysis reveals this insular activity is preceded by non-discriminatory activity in the frontal operculum. During ad libitum meal consumption, time-locked high-frequency broadband activity at the time of food intake discriminates food types and is associated with cue-specific activity during the task. These findings reveal spatiotemporally-specific activity in the human insulo-opercular cortex that underlies anticipatory evaluation of food across both controlled and naturalistic settings.


Conflict of interest statement

The authors declare the following competing interests: C.H.H. receives consulting and speaking honoraria from NeuroPace, Boston Scientific, and Ad-Tech. C.J.K. receives salary and equity from Alto Neuroscience. The remaining authors declare no competing interests.

Figures

Fig. 1
Fig. 1. The milkshake paradigm evokes responses in the human frontal opercular and insular cortices.
A The task paradigm. All subjects performed a food task that involved responding to cues of either palatable (chocolate milkshake) or taste-neutral (water-based solution) liquid and subsequently receiving 3 mL bolus. The anticipatory phase of the task was defined as the onset of the cue immediately prior to solution delivery (0 to 3 s). The receipt phase of the task was defined from solution delivery to immediately prior to swallowing (3 s to 6 s). B Freesurfer parcellation of the insular/opercular cortex. The insula was divided into anterior-posterior subregions based on the central sulcus of the insula. The anterior insula includes the short gyri, the anterior (ant.) circular sulcus, and the superior (sup.) circular sulcus; the posterior insula includes the long gyrus and the inferior (inf.) circular sulcus. The frontal operculum is defined as the inferior frontal gyrus. C Magnetic resonance image reconstruction of the insular cortex and the frontal operculum overlaid with the translucent cortical surface. All insular/opercular recording contacts are plotted as 3D spheres, color-coded according to subjects, in the Montreal Neurological Institute (MNI) space. D Time-frequency spectrogram (decibel, db) and high-frequency broadband (HFB) activity waveform from an insular electrode in a left long gyrus (red circled electrode in C) showing differential responses to palatable vs. taste-neutral cue during anticipation. Time points significantly different between palatable and neutral conditions (p < 0.05, cluster-based permutation testing, α < 0.05) are marked in red along the horizontal axis. The effect size was calculated using time periods that were considered significant as marked by red. The vertical dashed line denotes the onset of the solution cue (t = 0 s) and solution delivery (t = 3 s). Inset: distribution of mean HFB activity stratified by palatable and neutral trials with the effect size indicated. E Identical data representation as shown in D for an electrode in the right superior circular sulcus of the insula (black circled electrode in C) showing differential responses to palatable vs. taste-neutral solution during receipt. Error bars show ±SEM.
Fig. 2
Fig. 2. Topographic differences in insular and frontal opercular neural activity when anticipating and receiving task solutions.
A Site-by-site differences in anticipatory neural activity. Effect size between the anticipatory response to palatable vs. neutral solution is shown per electrode. Shades of red indicate significantly greater response in palatable trials whereas shades of blue indicate significantly greater response in taste-neutral trials. Green indicates a significant increase in activity from pre-cue baseline activity, but no difference between palatable or neutral conditions (cue-responsive but not cue-specific). Gray indicates activity was not different from pre-cue baseline activity (inactive). B Proportion of inactive (gray bar), responsive but not specific (green bar), and specific (blue/red bar) electrodes during anticipation stratified by anatomical location and sidedness. Chi-square proportional test was employed. C, D the Same set of plots as in (A, B) showing site-by-site differences in receipt neural activity. Chi-square proportional test was employed.
Fig. 3
Fig. 3. Posterior insular HFB activity is sufficient to classify between anticipation for palatable and taste-neutral solutions on a single trial basis.
A Parallel coordinates plot displaying normalized HFB power for each observation (n = 250 taste-neutral and n = 250 palatable trials) as a function of the four features used (4 anticipation time epochs: 0–0.5 and 0.5–1 s of cue presentation, and 1–2 and 2–3 s of post-cue fixation). Note that at the second feature, a cluster of taste-neutral anticipation trials is observed. B Inter (green) and intra-individual Receiver Operating Curves (ROCs) for positive class 1 (neutral anticipation). Inter-individual mean TPR (True Positive Rate) and FPR (False Positive Rate) and AUC (Area Under the Curve) were 64%, 36, and 69%, respectively. Intra-individual mean TPR and FPR, and AUC for the three subjects were (4) 69%, 31%, and 74% (7) 64%, 36%, and 69%, and (8) 57%, 43%, and 58% respectively. C Statistical testing on classifier performance (TPR in blue, FPR in red). The first set of values represent group classification performance on observed data: 64% mean TPR and 36% mean FPR across the two classes. Same performance measures were computed following permutations (n = 100) of values for a given feature across the two classes. Shuffled features 1, 2, 3, and 4 values yielded the following mean TPR and FPR values: (1) 58.84%, 41.06, (2) 52.56, 47.46, (3) 58.43, 41.46, and (4) 61.94, 38.06. Error bars represent S.E.M. across performance measures on shuffled data (n = 100). Observed TPR and FPR significantly differed from features 1, 2, and 3 shuffled data (p < 0.01, p < 0.01, and p = 0.01, respectively). Feature 4 shuffled data did not significantly affect classification performance (p = 0.08). Performance using feature 2 shuffled data was significantly diminished compared to performance on shuffled data for any other feature (Tw-sample t-test, corrected for multiple comparisons, p = 0.02 for features 2 vs. 1, 3, and 4, pFDR = 0.002). *p < 0.05, **p < 0.01.
Fig. 4
Fig. 4. Comparison of HFB response onset by anatomical location during task anticipation.
A Histogram showing the distribution of response onset latency (ROL) of HFB at the frontal operculum, the anterior insula, the posterior insula, and visual regions. Each observation represents the ROL of HFB at the single-trial level calculated for all trials across all subjects (palatable and taste-neutral conditions). The vertical line denotes the median ROL time. B Schematic representing the sequence of HFB activity onset: early visual response to cue with the subsequent delay in activation of the frontal operculum, followed by involvement of anterior insula and subsequently posterior insula.
Fig. 5
Fig. 5. Time-locked HFB activity during natural eating stratified by type of food consumed.
A Simultaneous HFB activity trace and video capture during meal consumption. For each subject, HFB activity computed from spike-minimized data in an exemplar electrode in the left posterior insula is shown. Dotted vertical lines denote the moment food was about to enter the subject’s mouth, with accompanying images showing the time point that was used for time-locking. The food being consumed is denoted under the activity trace. B Mean time-locked HFB waveforms stratified by type of food consumed. Dotted vertical lines denote the immediate time point as the food was about to enter the subject’s mouth. Time points significantly different between entrée vs. non-entrée near the time of food entering the mouth (p < 0.05, cluster-based permutation testing, α < 0.05) are marked in red along the horizontal axis. Error bars show ±SEM.
Fig. 6
Fig. 6. Food-specific responses during anticipation are maintained in task-based and natural eating settings.
A Topography of response types in the insular/opercular cortex during task-based and natural eating. During eating of a standard meal, a food-specific site (blue electrodes) was defined as a significant difference in HFB time-locked activity between food types near the time that food was about to enter a subject’s mouth, whereas gray electrodes indicate a non-responsive response. During a task, a cue-specific response (red electrodes) was defined as a significant difference between palatable and neutral conditions for either anticipation or receipt of these solutions. Green electrodes (cue-responsive sites) denote significant HFB activity compared to pre-cue baseline activity, but no difference between palatable and taste-neutral conditions. Gray electrodes denote activity was not different from pre-cue baseline activity. Electrodes visualized are from the three subjects shown in Fig. 5. B The probability of a channel being food-specific during eating with and without significant response during task anticipation. Left: Cue-responsive contacts without discriminatory activity during anticipation were not associated with food-specific eating responses. However, the presence of cue-specific activity was significantly associated with the presence of food-specific eating responses. Right: Amongst all electrodes, neither receipt-responsive nor receipt-specific responses were associated with food-specific channels.

Similar articles

Cited by

References

    1. Saper CB, Chou TC, Elmquist JK. The need to feed: homeostatic and hedonic control of eating. Neuron. 2002;36:199–211. doi: 10.1016/S0896-6273(02)00969-8. - DOI - PubMed
    1. Lutter M, Nestler EJ. Homeostatic and hedonic signals interact in the regulation of food intake. J. Nutr. 2009;139:629–632. doi: 10.3945/jn.108.097618. - DOI - PMC - PubMed
    1. Morris MJ, Beilharz JE, Maniam J, Reichelt AC, Westbrook RF. Why is obesity such a problem in the 21st century? The intersection of palatable food, cues and reward pathways, stress, and cognition. Neurosci. Biobehav. Rev. 2015;58:36–45. doi: 10.1016/j.neubiorev.2014.12.002. - DOI - PubMed
    1. Reiter AMF, Heinze HJ, Schlagenhauf F, Deserno L. Impaired flexible reward-based decision-making in binge eating disorder: evidence from computational modeling and functional neuroimaging. Neuropsychopharmacology. 2017;42:628–637. doi: 10.1038/npp.2016.95. - DOI - PMC - PubMed
    1. Livneh Y, et al. Homeostatic circuits selectively gate food cue responses in insular cortex. Nature. 2017;546:611–616. doi: 10.1038/nature22375. - DOI - PMC - PubMed

Publication types