Meta-Analysis
. 2021 Jun 14;12(1):3595.
doi: 10.1038/s41467-021-23873-8.

A large multiethnic GWAS meta-analysis of cataract identifies new risk loci and sex-specific effects

Affiliations
Meta-Analysis

A large multiethnic GWAS meta-analysis of cataract identifies new risk loci and sex-specific effects

Hélène Choquet et al. Nat Commun. .

Abstract

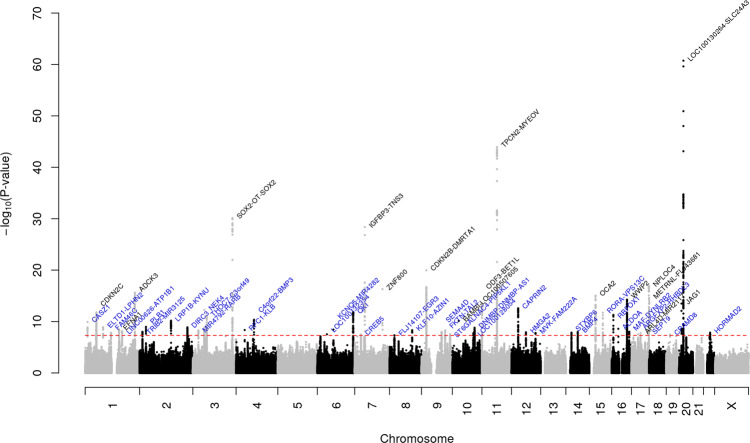
Cataract is the leading cause of blindness among the elderly worldwide and cataract surgery is one of the most common operations performed in the United States. As the genetic etiology of cataract formation remains unclear, we conducted a multiethnic genome-wide association meta-analysis, combining results from the GERA and UK Biobank cohorts, and tested for replication in the 23andMe research cohort. We report 54 genome-wide significant loci, 37 of which were novel. Sex-stratified analyses identified CASP7 as an additional novel locus specific to women. We show that genes within or near 80% of the cataract-associated loci are significantly expressed and/or enriched-expressed in the mouse lens across various spatiotemporal stages as per iSyTE analysis. Furthermore, iSyTE shows 32 candidate genes in the associated loci have altered gene expression in 9 different gene perturbation mouse models of lens defects/cataract, suggesting their relevance to lens biology. Our work provides further insight into the complex genetic architecture of cataract susceptibility.


Conflict of interest statement

G.C.P. and W.W. are employed by and hold stock or stock options in 23andMe, Inc. The remaining authors declare no competing interests.

Figures

Fig. 1
Fig. 1. Manhattan plot of the multiethnic combined (GERA + UKB) GWAS meta-analysis of cataract.
The y-axis represents the -log10(P-value); all P-values derived from logistic regression model are two-sided. The red dotted line represents the threshold of P = 5 × 10⁻⁸ which is the commonly accepted threshold of adjustments for multiple comparisons in GWAS. Locus names in blue are for the novel loci and the ones in dark are for the previously reported ones.
Fig. 2
Fig. 2. Chicago plot of the sex-stratified multiethnic GWAS meta-analyses of cataract.
Results from the meta-analysis combining men from GERA and UKB are presented on upper panel, while results from the meta-analysis combining women from GERA and UKB are presented on the lower panel. The y-axis represents the -log10(P-value); all P-values derived from logistic regression model are two-sided. The red dotted line represents the threshold of P = 5 × 10⁻⁸ which is the commonly accepted threshold of adjustments for multiple comparisons in GWAS. Locus names in black are for those previously reported. Locus names in bold (CASP7 and GSTM2) are for the additional novel loci specific to women (compared to the multiethnic meta-analysis (GERA + UKB)). Novel loci significantly associated (P < 5 × 10⁻⁸) with cataract in women are highlighted in green, and those significantly associated with cataract in men are highlighted in blue.
Fig. 3
Fig. 3. Expression of candidate genes in mouse lens.
Mouse orthologs of the human candidate genes in the 54 loci were examined for their lens expression in the iSyTE database. Analysis of whole lens tissue data on various platforms, microarrays (Affymetrix, Illumina) and RNA-seq indicates expression of 55 genes at different stages indicated by embryonic (E) and postnatal (P) days and ranged from early lens development (i.e., E10.5) through adulthood (i.e., P60). Note: P28 in Affymetrix represents expression data on isolated lens epithelium. The range of expression on each platform is indicated by a specific heat-map. The numbers within individual tiles indicate the level of expression in fluorescence intensity (for microarrays) and in counts per million (CPM) (for RNA-seq).
Fig. 4
Fig. 4. Phenome-wide association matrix of cataract top variants.
PheWAS was carried out for the 54 lead SNPs in our loci of interest identified in the combined (GERA + UKB) multiethnic analysis. SNPs were queried against 776 traits ascertained for UKB participants and reported in the Roslin Gene Atlas, including disorders of the lens, anthropometric traits, hematologic laboratory values, ICD-10 clinical diagnoses and self-reported conditions. Among the 54 lead SNPs, 43 were available in Gene Atlas database. We reported SNPs showing genome-wide significant association with at least one trait (in addition to cataract).

References

    1. Shiels A, Hejtmancik JF. Biology of inherited cataracts and opportunities for treatment. Annu. Rev. Vis. Sci. 2019;5:123–149. doi: 10.1146/annurev-vision-091517-034346. - DOI - PMC - PubMed
    1. Shiels A, Bennett TM, Hejtmancik JF. Cat-Map: putting cataract on the map. Mol. Vis. 2010;16:2007–2015. - PMC - PubMed
    1. Lou L, et al. Association of sex with the global burden of cataract. JAMA Ophthalmol. 2018;136:116–121. doi: 10.1001/jamaophthalmol.2017.5668. - DOI - PMC - PubMed
    1. Heiba IM, Elston RC, Klein BE, Klein R. Genetic etiology of nuclear cataract: evidence for a major gene. Am. J. Med Genet. 1993;47:1208–1214. doi: 10.1002/ajmg.1320470816. - DOI - PubMed
    1. Hammond CJ, Snieder H, Spector TD, Gilbert CE. Genetic and environmental factors in age-related nuclear cataracts in monozygotic and dizygotic twins. N. Engl. J. Med. 2000;342:1786–1790. doi: 10.1056/NEJM200006153422404. - DOI - PubMed

Publication types