Observational Study
. 2021 Jun 14;11(1):12469.
doi: 10.1038/s41598-021-91978-7.

Association between aphasia severity and brain network alterations after stroke assessed using the electroencephalographic phase synchrony index

Affiliations
Observational Study

Association between aphasia severity and brain network alterations after stroke assessed using the electroencephalographic phase synchrony index

Teiji Kawano et al. Sci Rep. .

Abstract

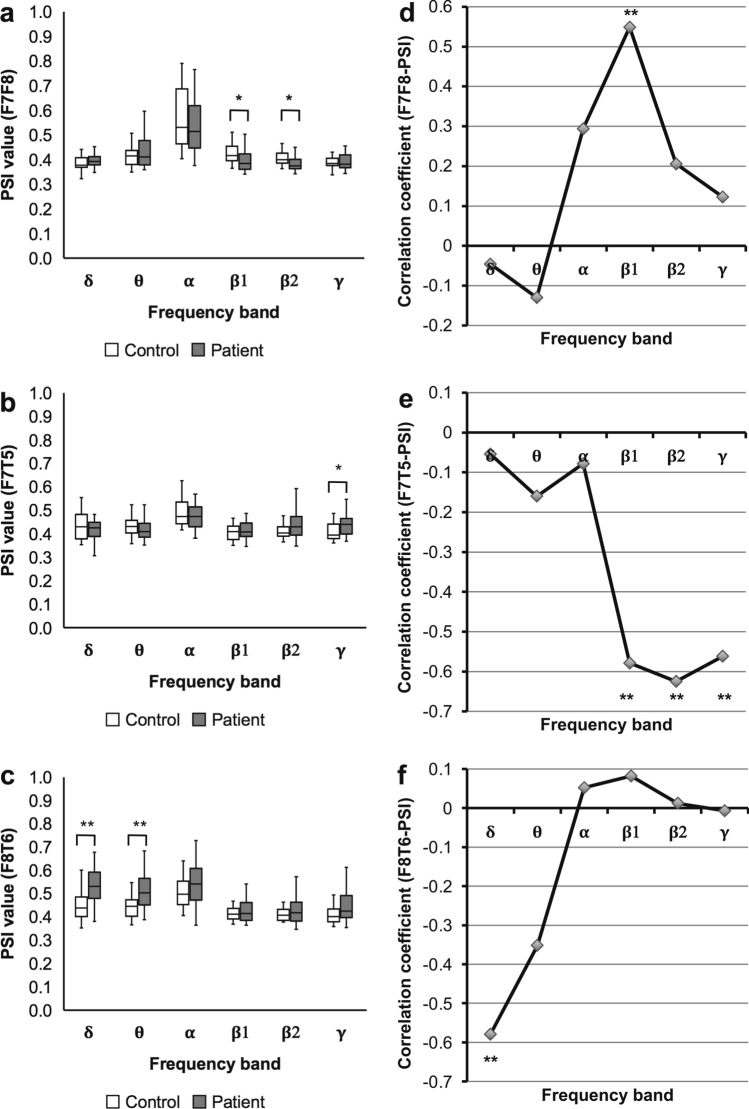
Electroencephalographic synchrony can help assess brain network status; however, its usefulness has not yet been fully proven. We developed a clinically feasible method that combines the phase synchrony index (PSI) with resting-state 19-channel electroencephalography (EEG) to evaluate post-stroke motor impairment. In this study, we investigated whether our method could be applied to aphasia, a common post-stroke cognitive impairment. This study included 31 patients with subacute aphasia and 24 healthy controls. We assessed the expressive function of patients and calculated the PSIs of three motor language-related regions: frontofrontal, left frontotemporal, and right frontotemporal. Then, we evaluated post-stroke network alterations by comparing PSIs of the patients and controls and by analyzing the correlations between PSIs and aphasia scores. The frontofrontal PSI (beta band) was lower in patients than in controls and positively correlated with aphasia scores, whereas the right frontotemporal PSI (delta band) was higher in patients than in controls and negatively correlated with aphasia scores. Evaluation of artifacts suggests that this association is attributed to true synchrony rather than spurious synchrony. These findings suggest that post-stroke aphasia is associated with alternations of two different networks and point to the usefulness of EEG PSI in understanding the pathophysiology of aphasia.


Conflict of interest statement

K. K. has a patent (JP6142354) issued to RIKEN and two patents (US14/770,047 and JPA2015-166281) pending to be issued to RIKEN. Y. U. has a patent (JPA2015-166281) pending to be issued to RIKEN. T. K., N. H., M. H., H. Y., H. F., M. N., H. M., and I. M. declare that they have no conflicts of interest to disclose.

Figures

Figure 1
Figure 1
Maps of electrode pairs and stroke lesions in this study. (a) Electrode pairs used for the computation of the F7F8-PSI, F7T5-PSI, and F8T6-PSI. They are located in the motor language-related regions. (b) Electrode pairs (F3F4, F3P3, and F4P4) spatially adjacent to those in (a) (F7F8, F7T5, and F8T6) used for evaluation of the effect of artifacts. They are not located in the motor language-related regions. (c) A map of the ischemic stroke lesion distribution in 31 patients. The colors indicate the number of patients with lesions. PSI phase synchrony index.
Figure 2
Figure 2
Results of analyses for the PSIs between the motor language-related regions. Comparison of PSIs in stroke patients with those in healthy controls. A box-and-whisker plot indicating values of the (a) F7F8-PSI, (b) F7T5-PSI, and (c) F8T6-PSI of stroke patients and healthy controls (Mann‒Whitney U test; * P < 0.05; ** P < 0.01, FDR corrected). The F7F8-PSI (β1 and β2), the F7T5-PSI (γ), and the F8T6-PSI (δ and θ) show significant differences between stroke patients and healthy controls. Correlation coefficients of the F7F8/F7T5/F8T6-PSIs with ARSsp scores. A polygonal line graph of the correlation coefficients for the correlation of (d) F7F8-PSI, (e) F7T5-PSI, and (f) F8T6-PSI with ARSsp scores (Spearman’s correlation analysis; * P < 0.05; ** P < 0.01, FDR corrected). Each PSI shows significant correlations in distinct frequency bands with significant differences between stroke patients and healthy controls. ARSsp Aphasia Rating Scale speech, FDR false discovery rate, PSI phase synchrony index.
Figure 3
Figure 3
Correlation of the F7F8/F7T5/F8T6-PSIs with ARSsp scores. Scatter plots of the (a) F7F8-PSI, (b) F7T5-PSI, and (c) F8T6-PSI versus the ARSsp scores (P values: Spearman’s correlation analysis; FDR corrected). The F7F8-PSI is correlated positively with the ARSsp score, whereas the F7T5-PSI and F8T6-PSI are correlated negatively with the ARSsp scores. ARSsp Aphasia Rating Scale speech, FDR false discovery rate, PSI phase synchrony index.
Figure 4
Figure 4
Results of analyses for the spatially adjacent PSIs. Comparison of PSIs in stroke patients with those in healthy controls. A box-and-whisker plot indicating values of the (a) F3F4-PSI, (b) F3P3-PSI, and (c) F4P4-PSI of stroke patients and healthy controls (Mann‒Whitney U test, FDR corrected). In contrast to the PSIs between motor language-related regions, all spatially adjacent PSIs show no significant difference between stroke patients and healthy controls. Correlation coefficients of the F3F4/F3P3/F4P4-PSIs with ARSsp scores. A polygonal line graph of the correlation coefficients for the correlation of (d) F3F4-PSI, (e) F3P3-PSI, and (f) F4P4-PSI with ARSsp scores (Spearman’s correlation analysis, FDR corrected). In contrast to the PSIs between motor language-related regions, all spatially adjacent PSIs show no significant correlations in any frequency band. ARSsp Aphasia Rating Scale speech, FDR false discovery rate, PSI phase synchrony index.
Figure 5
Figure 5
Results of analyses for the global PSIs. Comparison of PSIs in stroke patients with those in healthy controls. A box-and-whisker plot indicating values of the (a) left Intrah-PSI and (b) right Intrah-PSI of stroke patients and healthy controls (Mann‒Whitney U test; * P < 0.05, ** P < 0.01, FDR corrected). Right Intrah-PSIs shows significant differences between stroke patients and healthy controls in the δ and θ bands. Correlation coefficients of the left/right Intrah-PSIs with ARSsp scores. A polygonal line graph of the correlation coefficients for the correlation of (c) left Intrah-PSI and (d) right Intrah-PSI with ARSsp scores (Spearman’s correlation analysis, FDR corrected). In contrast to the PSIs between motor language-related regions, global PSIs show no significant correlations in any frequency band. ARSsp Aphasia Rating Scale speech, FDR false discovery rate, Intrah intrahemispheric, lt left, PSI phase synchrony index, rt right.
Figure 6
Figure 6
Results of analyses for the PLIs between the motor language-related regions. Comparison of the PLIs in stroke patients with those in healthy controls. A box-and-whisker plot indicating values of the (a) F7F8-PLI, (b) F7T5-PLI, and (c) F8T6-PLI of stroke patients and healthy controls (Mann‒Whitney U test; * P < 0.05, ** P < 0.01, *** P < 0.001, FDR corrected). In contrast to the F7F8-PLI and F7T5-PLI, the F8T6-PLI shows no significant difference between stroke patients and healthy controls. Correlation coefficients of the F7F8/F7T5/F8T6-PLIs with ARSsp scores. A polygonal line graph of the correlation coefficients for the correlation of (d) F7F8-PLI, (e) F7T5-PLI, and (f) F8T6-PLI with ARSsp scores (Spearman’s correlation analysis; * P < 0.05, FDR corrected). In contrast to the F7F8-PLI and F7T5-PLI, the F8T6-PLI shows a significant correlation in the β1 band. ARSsp Aphasia Rating Scale speech, FDR false discovery rate, PLI phase lag index.
Figure 7
Figure 7
A correlation of LV with ARSsp scores and a summary of correlation analyses in this study. (a) A scatter plot showing a negative correlation between stroke LV and the ARSsp score. (b) A summary of the correlation analyses between six PSIs (F7F8-PSI, F3F4-PSI, F7T5-PSI, F3P3-PSI, F8T6-PSI, and F4P4-PSI)/the F8T6-PLI and ARSsp scores is plotted on the brain overlay. The solid arrow indicates a significant correlation, whereas dashed arrows indicate nonsignificant correlations. The gray shadow indicates the stroke lesion. ARSsp Aphasia Rating Scale speech, LV lesion volume, PSI phase synchrony index, PLI phase lag index.

References

    1. Flowers HL, et al. Poststroke aphasia frequency, recovery, and outcomes: a systematic review and meta-analysis. Arch. Phys. Med. Rehabil. 2016;97:2188–2201.e8. doi: 10.1016/j.apmr.2016.03.006. - DOI - PubMed
    1. Boehme AK, Martin-Schild S, Marshall RS, Lazar RM. Effect of aphasia on acute stroke outcomes. Neurology. 2016;87:2348–2354. doi: 10.1212/WNL.0000000000003297. - DOI - PMC - PubMed
    1. Boyd LA, et al. Biomarkers of stroke recovery: consensus-based core recommendations from the stroke recovery and rehabilitation roundtable. Int. J. Stroke. 2017;12:480–493. doi: 10.1177/1747493017714176. - DOI - PMC - PubMed
    1. Fridriksson J, et al. Anatomy of aphasia revisited. Brain. 2018;141:848–862. doi: 10.1093/brain/awx363. - DOI - PMC - PubMed
    1. Hartwigsen G, Saur D. Neuroimaging of stroke recovery from aphasia: insights into plasticity of the human language network. Neuroimage. 2019;190:14–31. doi: 10.1016/j.neuroimage.2017.11.056. - DOI - PubMed

Publication types

MeSH terms