. 2021 Jun 14;11(1):12417.
doi: 10.1038/s41598-021-91993-8.

Vaccination with BCGΔBCG1419c protects against pulmonary and extrapulmonary TB and is safer than BCG

Affiliations

Vaccination with BCGΔBCG1419c protects against pulmonary and extrapulmonary TB and is safer than BCG

Michel de Jesús Aceves-Sánchez et al. Sci Rep. .

Abstract

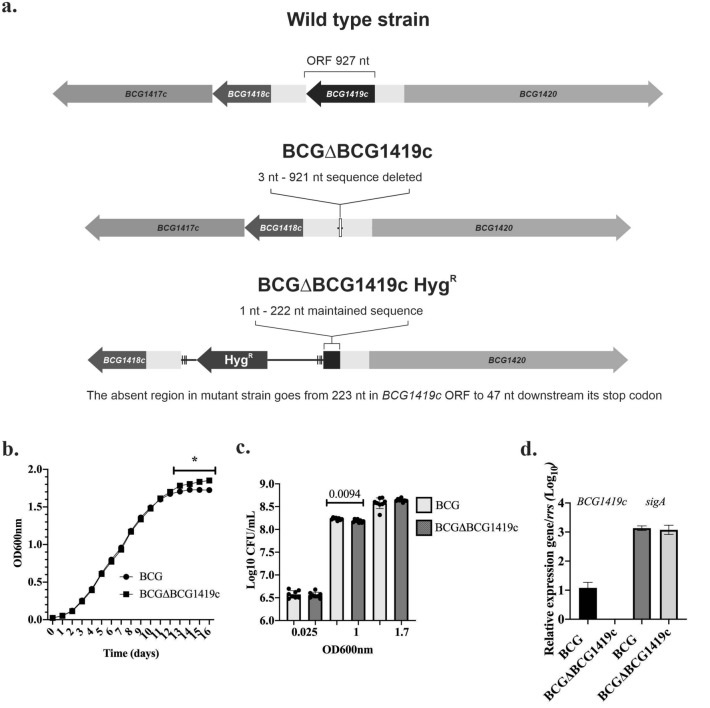
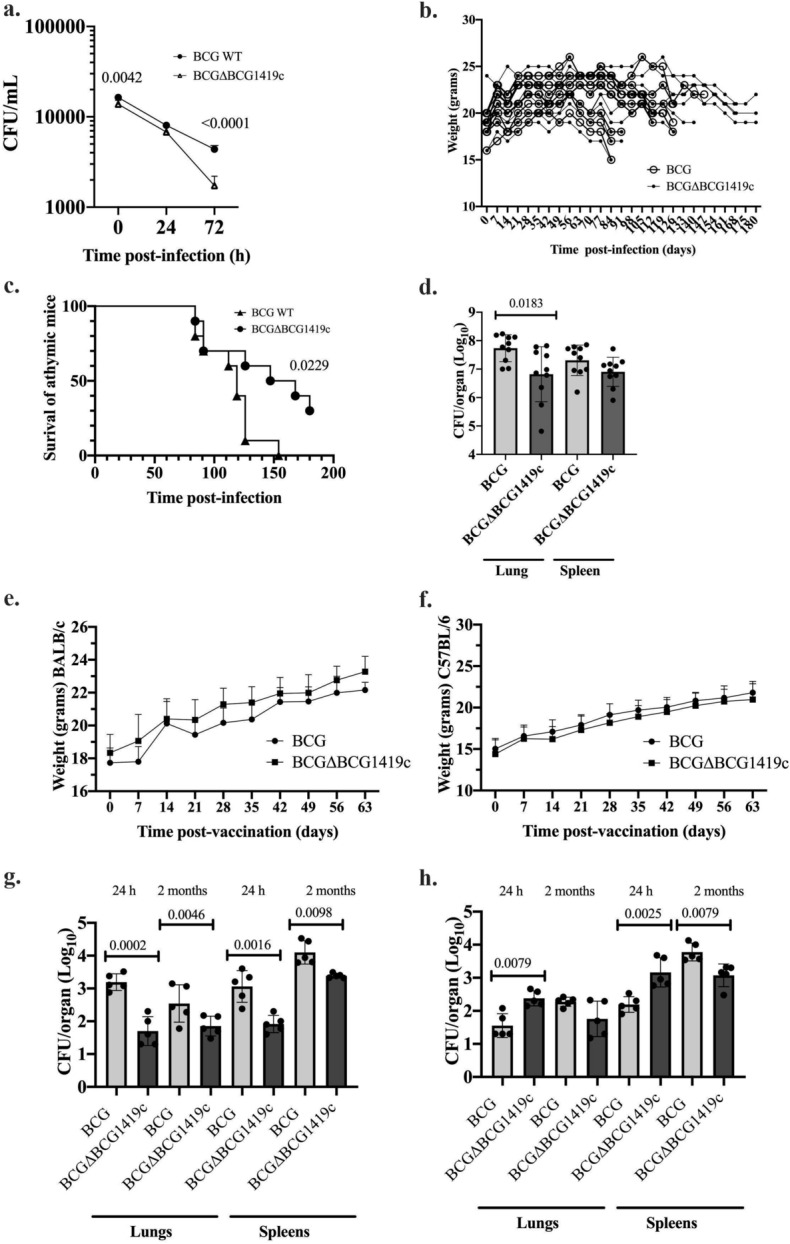
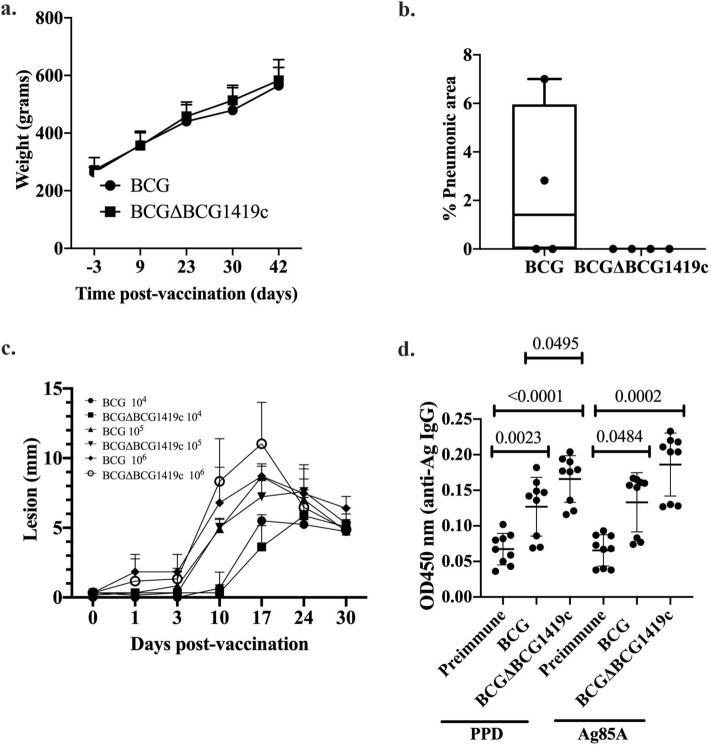
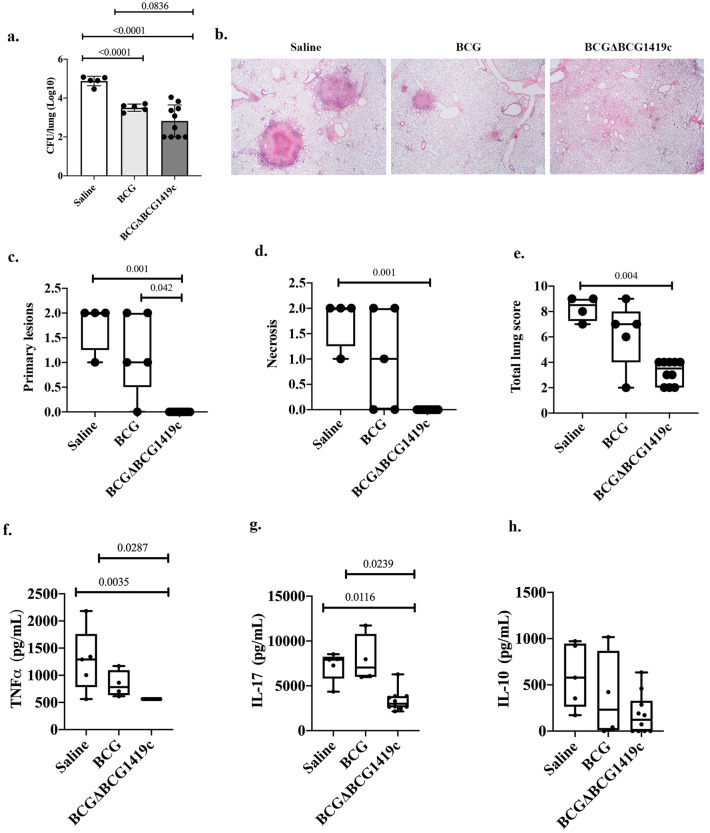
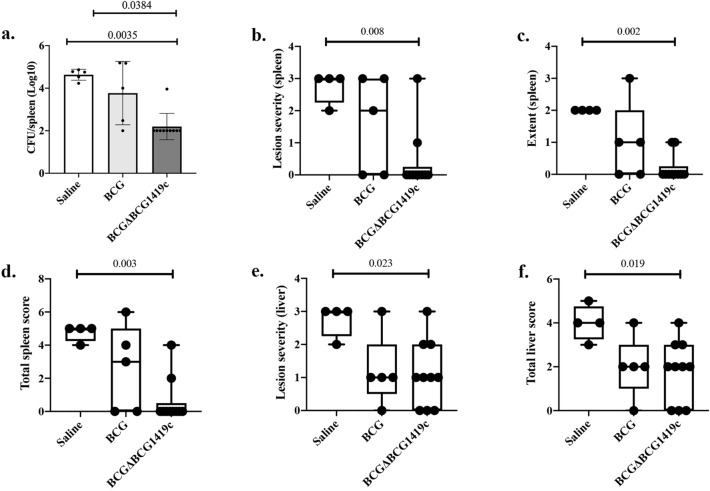
A single intradermal vaccination with an antibiotic-less version of BCGΔBCG1419c given to guinea pigs conferred a significant improvement in outcome following a low dose aerosol exposure to M. tuberculosis compared to that provided by a single dose of BCG Pasteur. BCGΔBCG1419c was more attenuated than BCG in murine macrophages, athymic, BALB/c, and C57BL/6 mice. In guinea pigs, BCGΔBCG1419c was at least as attenuated as BCG and induced similar dermal reactivity to that of BCG. Vaccination of guinea pigs with BCGΔBCG1419c resulted in increased anti-PPD IgG compared with those receiving BCG. Guinea pigs vaccinated with BCGΔBCG1419c showed a significant reduction of M. tuberculosis replication in lungs and spleens compared with BCG, as well as a significant reduction of pulmonary and extrapulmonary tuberculosis (TB) pathology measured using pathology scores recorded at necropsy. Evaluation of cytokines produced in lungs of infected guinea pigs showed that BCGΔBCG1419c significantly reduced TNF-α and IL-17 compared with BCG-vaccinated animals, with no changes in IL-10. This work demonstrates a significantly improved protection against pulmonary and extrapulmonary TB provided by BCGΔBCG1419c in susceptible guinea pigs together with an increased safety compared with BCG in several models. These results support the continued development of BCGΔBCG1419c as an effective vaccine for TB.


Conflict of interest statement

M.J.A.S., M.A.F.V. and C.P.R. are co-inventors on a patent on BCGΔBCG1419c held by the Centro de Investigación y Asistencia en Tecnología y diseño del Estado de Jalisco (CIATEJ), A.C. and Instituto Nacional de Ciencias Médicas y Nutrición “Salvador Zubirán”.

Figures

Figure 1
Figure 1
Characterization of the novel, antibiotic-less version of the TB vaccine candidate BCGΔBCG1419c. (a) Schematic representation of the BCG1419c gene and flanking regions present in wild type BCG, the antibiotic-less, and the hygromycin resistant (HygR) versions of BCGΔBCG1419c. (b) Growth curve of BCG and BCGΔBCG1419c. An asterisk (*) denotes a statistically significant difference (p < 0.05) between OD600nm readings of BCG and BCGΔBCG1419c from day 11 to day 16, as evaluated with multiple t tests corrected for multiple comparison with Holm-Sidak method at α = 0.05. Data (n = 4) is shown as mean with standard deviation (SD). (c) Bacterial replication determined as colony-forming units (CFU)/mL at 3 different OD600 (0.025, 1.0, 1.7). Mean Log10 CFU/mL with individual data (n = 8 per BCG strain) with SD are shown, and were compared with an unpaired, two-tailed Student’s t test, with Welch’s correction when standard deviation of the groups was different. (d) Comparison of BCG1419c and sigA gene expression in wild type BCG and BCG∆BCG1419c. Mean Log10 gene expression relative to rrs with SD is shown for each strain (n = 6 per BCG strain), a Mann–Whitney test was used for comparison.
Figure 2
Figure 2
The BCGΔBCG1419c vaccine candidate is more attenuated than parental BCG. (a) Kinetics of murine macrophage infection assay in RAW 264.7 using BCG or BCG∆BCG1419c. Data (n = 6 per BCG strain/time point) is shown as mean with SD. A One-Way ANOVA followed by Tukey’s multiple comparison test or a Brown-Forsythe and Welch ANOVA followed by Dunnett’s multiple comparison test were used depending on SDs being or not different among groups compared, and significantly different p values indicated. (b) Body weight registry of individual athymic mice (n = 10/group) intravenously infected with 106 CFU of BCG or BCGΔBCG1419c, used to inform humane endpoint (≥ 20% of weight loss). (c) Survival of athymic mice at 180 days post intravenous infection, with p value resulting from the Log-rank (Mantel-Cox) test shown. (d) Bacterial replication in lungs and spleen of athymic mice euthanized when they lost ≥ 20% of its maximum weight. Mean Log10 CFU/organ with individual data (n = 10 per BCG strain) with SD are shown, and were compared with an unpaired, two-tailed Student’s t test, with Welch’s correction when standard deviation of the groups was different, with significantly different p values indicated. (e) Body weight registry of individual BALB/c mice (n = 10/group) subcutaneously vaccinated with 107 CFU BCG or BCGΔBCG1419c over 2 months (63 days). (f) Body weight registry of individual C57BL/6 mice (n = 10/group) subcutaneously vaccinated with 107 CFU BCG or BCGΔBCG1419c over 2 months (63 days). (g) Bacterial replication in lungs and spleen of BALB/c mice (n = 5 per time point) at 24 h and 2 months (63 days) post-vaccination. Mean Log10 CFU/organ with individual data (n = 5 per BCG strain) with SD are shown, and were compared with an unpaired, two-tailed Student’s t test, with Welch´s correction when standard deviation of the groups was different, with significantly different p values indicated. (h) Bacterial replication in lungs and spleen of C57BL/6 mice (n = 5 per time point) at 24 h and 2 months (63 days) post-vaccination. Mean Log10 CFU/organ with individual data (n = 5 per BCG strain) with SD are shown, and were compared with an unpaired, two-tailed Student’s t test, with Welch’s correction when standard deviation of the groups was different, with significantly different p values indicated.
Figure 3
Figure 3
The BCGΔBCG1419c vaccine candidate is as safe as parental BCG and induces more anti-PPD IgG. (a) Body weight registry of guinea pigs (n = 6/group) after intramuscular (i.m.) vaccination with 107 CFU of BCG or BCGΔBCG1419c over 42 days. Data is presented as means with SD and were evaluated with multiple t tests corrected for multiple comparison with Holm–Sidak method at α = 0.05. (b) Histopathological assessment of pneumonic areas found at 42 days post-vaccination (i.m.) in guinea pigs (n = 4/group) that received 107 CFU of BCG or BCGΔBCG1419c. Data is presented as a box and whisker plot showing all points. (c) Excessive dermal reactivity in guinea pigs (n = 6/group). Each guinea pig was intradermally injected with three different doses of BCG or BCGΔBCG1419c. Lesions formed at the sites of injection were observed over a 28-day period. In each animal, the papule sizes resulting from vaccination with either BCG strain were compared with a multiple t test corrected for multiple comparison with Holm–Sidak method at α = 0.05. Data are presented as mean with SD. (d) Anti-IgG reactivity to bovine PPD and recombinant Ag85A from guinea pigs (n = 9/group) pre-vaccination (preimmune) and 10 weeks post-vaccination with 103 CFU of BCG or BCGΔBCG1419c. Data are presented as mean with SD with individual OD450nm values shown. A One-Way ANOVA followed by Tukey’s multiple comparison test or a Kruskal–Wallis followed by Dunn’s multiple comparison test were used depending on distribution of data, and significantly different p values are indicated.
Figure 4
Figure 4
The BCGΔBCG1419c vaccine candidate is more effective than BCG in reducing pulmonary TB in guinea pigs. (a) Bacterial replication in lungs of guinea pigs (n = 5 in saline and BCG groups, n = 10 in the BCGΔBCG1419c group) at 40 days post-infection. Mean Log10 CFU with SD are shown, including individual data. Brown-Forsythe and Welch ANOVA test followed by Dunnett’s multiple comparison was used to compare M. tuberculosis burden and p values are shown. (b) Representative H&E images (×2) of animals that received saline, BCG, or BCGΔBCG149c. Lesions were evaluated using a scoring system to compare them (c). Primary lesions. (d) Necrosis. (e) Total lung score. Data (n = 4–10, depending on groups) is presented as a box and whisker plot showing all points. Categorized data were analyzed with a H Kruskal–Wallis test using SPSS version 25 (α = 0.05). In all cases, p value was adjusted for multiple comparisons with Bonferroni correction. Secreted cytokines in lungs of infected guinea pigs at 40 days post-infection, showing (f) TNF-α, (g) IL-17, and (h) IL-10. Data (n = 4–10, depending on groups) is presented as a box and whisker plot showing all points. A One-Way ANOVA followed by Tukey’s multiple comparison test or a Kruskal–Wallis followed by Dunn’s multiple comparison test were used depending on distribution of data, and significantly different p values are indicated.
Figure 5
Figure 5
The BCGΔBCG1419c vaccine candidate is more effective than BCG in reducing extrapulmonary TB in guinea pigs. (a) Bacterial replication in spleens of guinea pigs (n = 5 in saline and BCG groups, n = 10 in the BCGΔBCG1419c group) at 40 days post-infection. Mean Log10 CFU with SD are shown, including individual data. A Kruskal–Wallis test followed by Dunn’s multiple comparison was used to compare M. tuberculosis burden and significant p values are shown. Lesions were evaluated using a scoring system to compare (b) Lesion severity in spleens. (c) Extent of lesions in spleens. (d) Total spleen score. (e) Lesion severity in livers. (f) Total liver score. Data (n = 4–10, depending on groups) are presented as a box and whisker plot showing all points. Categorized data were analyzed with a H Kruskal–Wallis test using SPSS version 25 (α = 0.05). In all cases, p value was adjusted for multiple comparisons with Bonferroni correction.

References

    1. World Health Organization. Global Tuberculosis Report 2020.https://www.who.int/publications/i/item/9789240013131(2020).
    1. Houben RM, Dodd PJ. The global burden of latent tuberculosis infection: A re-estimation using mathematical modelling. PLoS Med. 2016;13:e1002152. doi: 10.1371/journal.pmed.1002152. - DOI - PMC - PubMed
    1. Hunter R, Actor J. The pathogenesis of post-primary tuberculosis. A game changer for vaccine development. Tuberculosis (Edinb) 2019;116S:S114–S117. doi: 10.1016/j.tube.2019.04.018. - DOI - PMC - PubMed
    1. Hunter RL. The pathogenesis of tuberculosis: The early infiltrate of post-primary (adult pulmonary) tuberculosis: A distinct disease entity. Front. Immunol. 2018;9:2108. doi: 10.3389/fimmu.2018.02108. - DOI - PMC - PubMed
    1. Hunter RL, et al. Pathogenesis and animal models of post-primary (bronchogenic) tuberculosis, A review. Pathogens. 2018 doi: 10.3390/pathogens7010019. - DOI - PMC - PubMed

Publication types

MeSH terms