. 2021 Jun 14;4(1):734.
doi: 10.1038/s42003-021-02210-1.

The power and promise of genetic mapping from Plasmodium falciparum crosses utilizing human liver-chimeric mice

Affiliations

The power and promise of genetic mapping from Plasmodium falciparum crosses utilizing human liver-chimeric mice

Katrina A Button-Simons et al. Commun Biol. .

Abstract

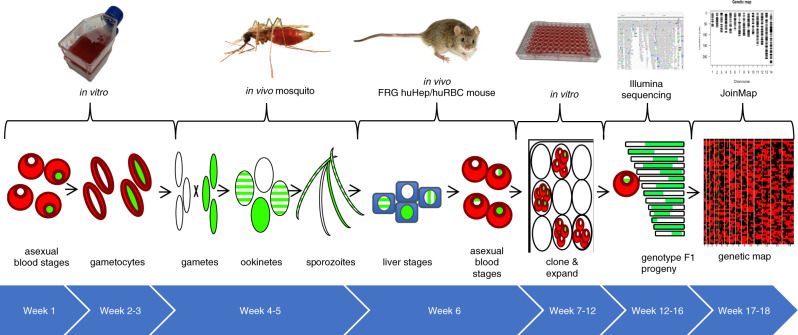
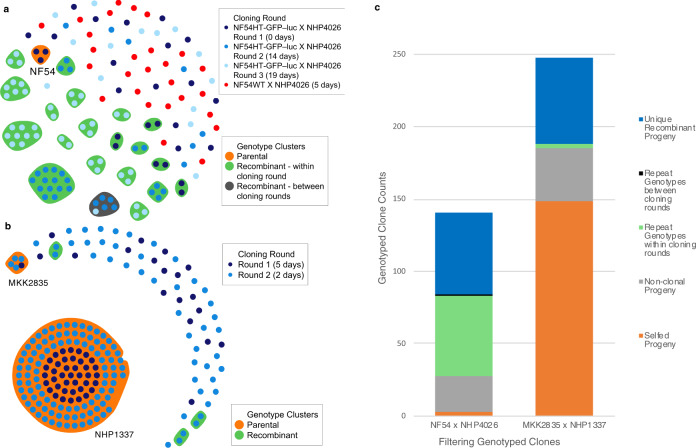
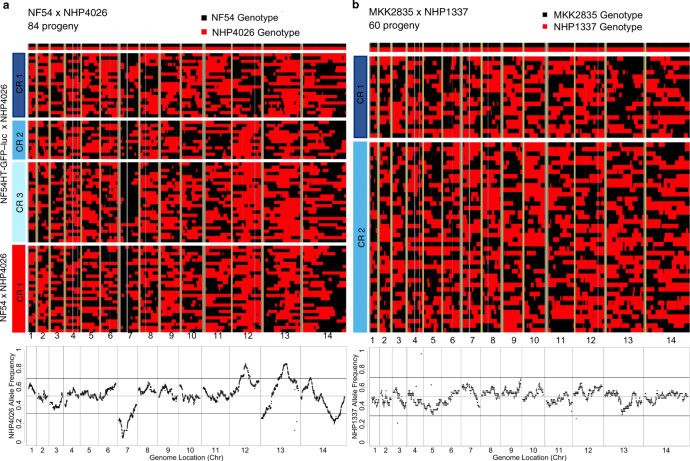
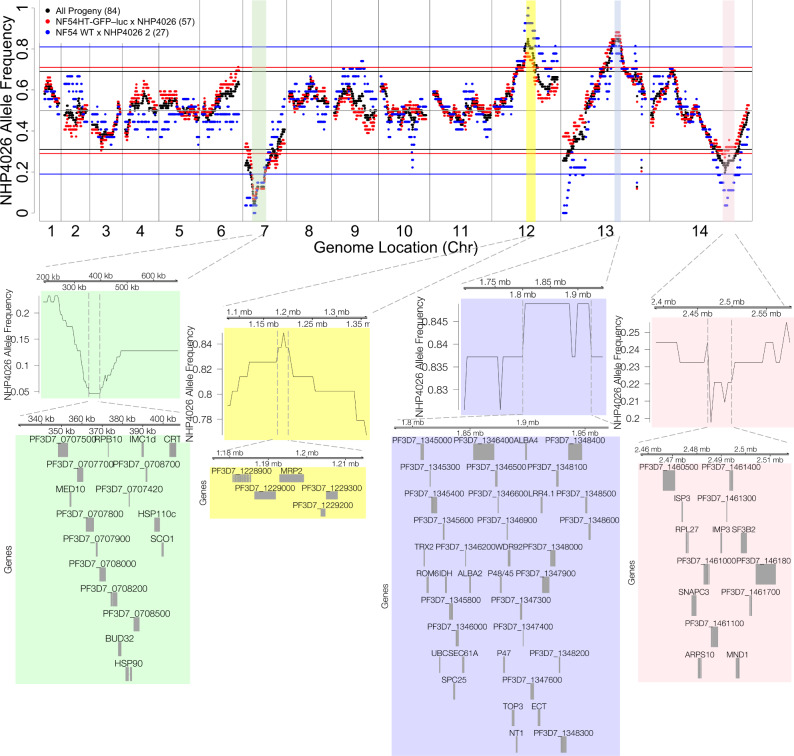
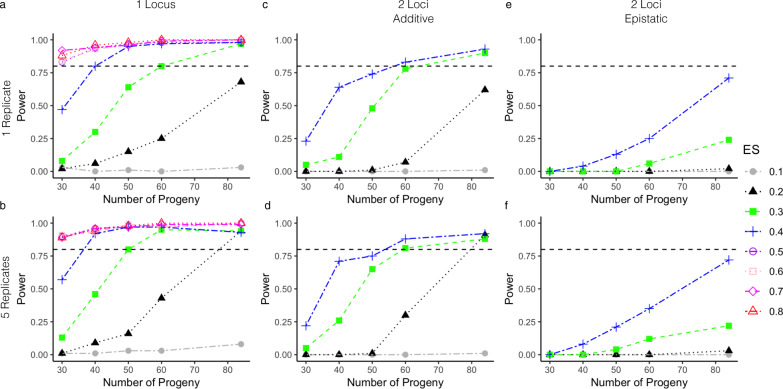
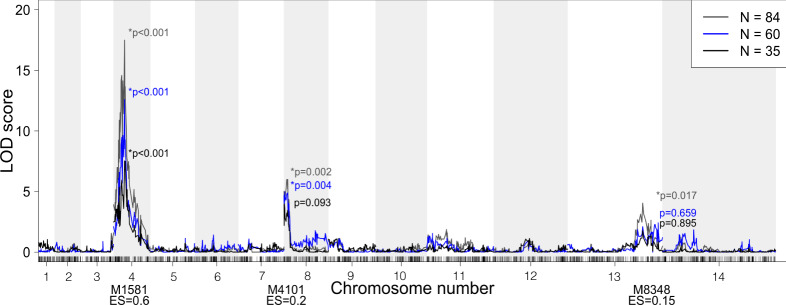
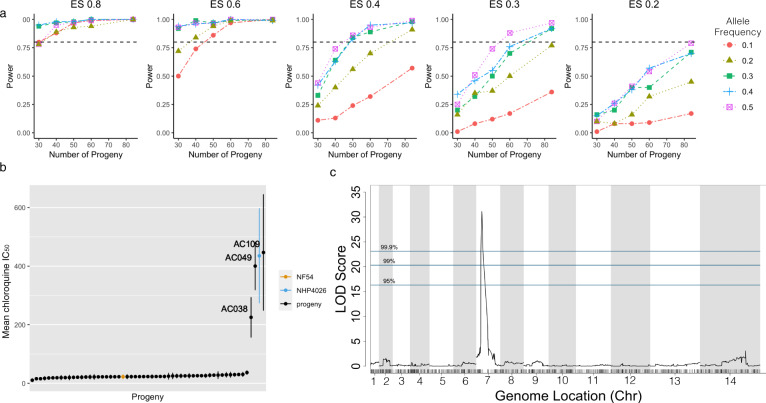
Genetic crosses are most powerful for linkage analysis when progeny numbers are high, parental alleles segregate evenly and numbers of inbred progeny are minimized. We previously developed a novel genetic crossing platform for the human malaria parasite Plasmodium falciparum, an obligately sexual, hermaphroditic protozoan, using mice carrying human hepatocytes (the human liver-chimeric FRG NOD huHep mouse) as the vertebrate host. We report on two genetic crosses-(1) an allopatric cross between a laboratory-adapted parasite (NF54) of African origin and a recently patient-derived Asian parasite, and (2) a sympatric cross between two recently patient-derived Asian parasites. We generated 144 unique recombinant clones from the two crosses, doubling the number of unique recombinant progeny generated in the previous 30 years. The allopatric African/Asian cross has minimal levels of inbreeding and extreme segregation distortion, while in the sympatric Asian cross, inbred progeny predominate and parental alleles segregate evenly. Using simulations, we demonstrate that these progeny provide the power to map small-effect mutations and epistatic interactions. The segregation distortion in the allopatric cross slightly erodes power to detect linkage in several genome regions. We greatly increase the power and the precision to map biomedically important traits with these new large progeny panels.


Conflict of interest statement

The authors declare no competing interests.

Figures

Fig. 1
Fig. 1. Timeline for performing P. falciparum crosses in FRG NOD huHep/huRBC mice.
Uncloned F1 progeny from P. falciparum genetic crosses of recent field isolates were recovered within 6 weeks from the start of the asexual stage culture of the two parent lines. Cloning of potential F1 recombinant progeny takes an additional 6 weeks and next-generation sequencing of potential recombinant progeny and identification of unique recombinants via our pipeline takes an additional 6 weeks. This figure was adapted from Fig. 1a of Vaughan et al.. The mosquito image was adapted from a photo created by James Gathany and the mouse image was created by George Shuklin both were made available for public use through creative commons lisences.
Fig. 2
Fig. 2. Cloning results and recombinant progeny for each cross.
a, b Genotyping results for each cross. Circles represent clonal genotyped progeny. Colored ellipses surround individual cloned progeny of the same genotype, with orange ellipses denoting parental progeny. a The cloned progeny from the NF54 × NHP4026 contained three selfed NF54 progeny (orange ellipse). The majority of repeat sampling of the same genotype (green and gray ellipse) occurred in cloning round 3, the gray ellipse denotes the only observed repeat sampling event between cloning rounds (rounds 2 and 3, gray ellipse). b The MKK2835 × NHP1337 cross produced 144 selfed NHP1337 progeny, five MKK2835 selfed progeny and few instances of repeat sampling (green ellipses). c Progeny were characterized to identify unique recombinant progeny (blue), selfed progeny (orange), non-clonal progeny (gray) and repeat sampling of the same genotype within a cloning round (green) and between cloning rounds (black).
Fig. 3
Fig. 3. Physical maps of recombinant progeny from two genetic crosses.
Physical maps (a, b) depict inheritance patterns in 5 kb blocks across the core genome (x axis) for each progeny (y axis). Non-core regions of the genome with no variant calls are shown in gray and yellow shows chromosome boundaries. Each heatmap is broken into sections by cloning round. The lower panels show allele frequencies across the genome for the unique recombinant progeny and the horizontal black lines show a cut-off for segregation distortion, a deviation from the expected ratio of 1:1 at p = 0.001. a The physical map for the NF54 × NHP4026 progeny shows regions where haplotype blocks deviate significantly from the expected 1:1 ratio. b The physical map for MKK2835 × NHP1337 shows even inheritance ratios across the genome, in line with Mendelian expectations.
Fig. 4
Fig. 4. Replicated segregation distortion in the NF54 × NHP4026 cross.
Frequency of the NHP4026 SNP alleles in unique recombinant progeny in NF54 × NHP4026 is highly repeatable across biological replicates (black—all progeny, red—progeny from biological replicate 1, blue—progeny from biological replicate 2). Horizontal lines represent significance thresholds (χ2 test p = 0.001) for segregation distortion for each corresponding set of progeny. Colored regions (green, yellow, lilac, pink) show significant segregation distortion in both biological replicates. Genes are shown for the peak regions of segregation distortion.
Fig. 5
Fig. 5. Power analysis for different size progeny sets.
Power curves are shown from simulated phenotypes for the NF54 × NHP4026 progeny for different size progeny sets. The top row a, c, e shows power curves where the phenotype only has a single replicate per progeny strain and the bottom row b, d, f shows results for five replicate phenotype values per progeny strain. The first column a, b shows results for a single locus effect, the second column c, d shows results for an additive two loci effect and the third column e, f shows results for an epistatic interaction between two loci. The horizontal black dotted line denotes 80% power.
Fig. 6
Fig. 6. Detecting complex associations.
QTL scans of simulated phenotypes with one major (ES = 0.6) and two minor (ES = 0.2 and 0.15) contributing loci for N = 84 (gray), 60 (blue) and 35 progeny (black). The major locus is detected for all sizes of N, but only one minor locus is detected for N = 60 progeny and neither minor locus is detected at N = 35 progeny.
Fig. 7
Fig. 7. Power loss due to segregation distortion.
a Effect of segregation distortion on mapping power with NF54 × NHP4026 progeny with simulated phenotype data at different ES. Each sub-panel shows the relationship between allele frequency and power for different numbers of progeny at a fixed ES. For a high ES, allele frequency has little effect on power. At lower ES, we observe a large loss of power for alleles with less than 0.3 allele frequency. b Distribution of mean ± standard deviation of the chloroquine IC50 from five biological replicates of 56 progeny and two parents from the NF54 × NHP4026 cross. c QTL mapping of mean chloroquine IC50 (ES = 0.84) in (b) results in a LOD score of 31.13 and a genome-wide p value of 0.0007 demonstrating that despite extreme segregation distortion, QTL can be detected for experimental phenotype data with high ES.

References

    1. Fairlamb, A. H., Gow, N. A. R., Matthews, K. R. & Waters, A. P. Drug resistance in eukaryotic microorganisms. Nat. Microbiol.1, 16092 (2016). - PMC - PubMed
    1. Wang W, Wang L, Liang Y-S. Susceptibility or resistance of praziquantel in human schistosomiasis: a review. Parasitol. Res. 2012;111:1871–1877. doi: 10.1007/s00436-012-3151-z. - DOI - PubMed
    1. Ferdig MT, et al. Dissecting the loci of low-level quinine resistance in malaria parasites. Mol. Microbiol. 2004;52:985–997. doi: 10.1111/j.1365-2958.2004.04035.x. - DOI - PubMed
    1. Müller IB, Hyde JE. Antimalarial drugs: modes of action and mechanisms of parasite resistance. Future Microbiol. 2010;5:1857–1873. doi: 10.2217/fmb.10.136. - DOI - PubMed
    1. Chevalier, F. D., Valentim, C. L. L., LoVerde, P. T. & Anderson, T. J. C. Efficient linkage mapping using exome capture and extreme QTL in schistosome parasites. BMC Genomics15, 617 (2014). - PMC - PubMed

Publication types