

Fine-mapping, trans-ancestral and genomic analyses identify causal variants, cells, genes and drug targets for type 1 diabetes
- PMID: 34127860
- PMCID: PMC8273124
- DOI: 10.1038/s41588-021-00880-5
Fine-mapping, trans-ancestral and genomic analyses identify causal variants, cells, genes and drug targets for type 1 diabetes
Abstract
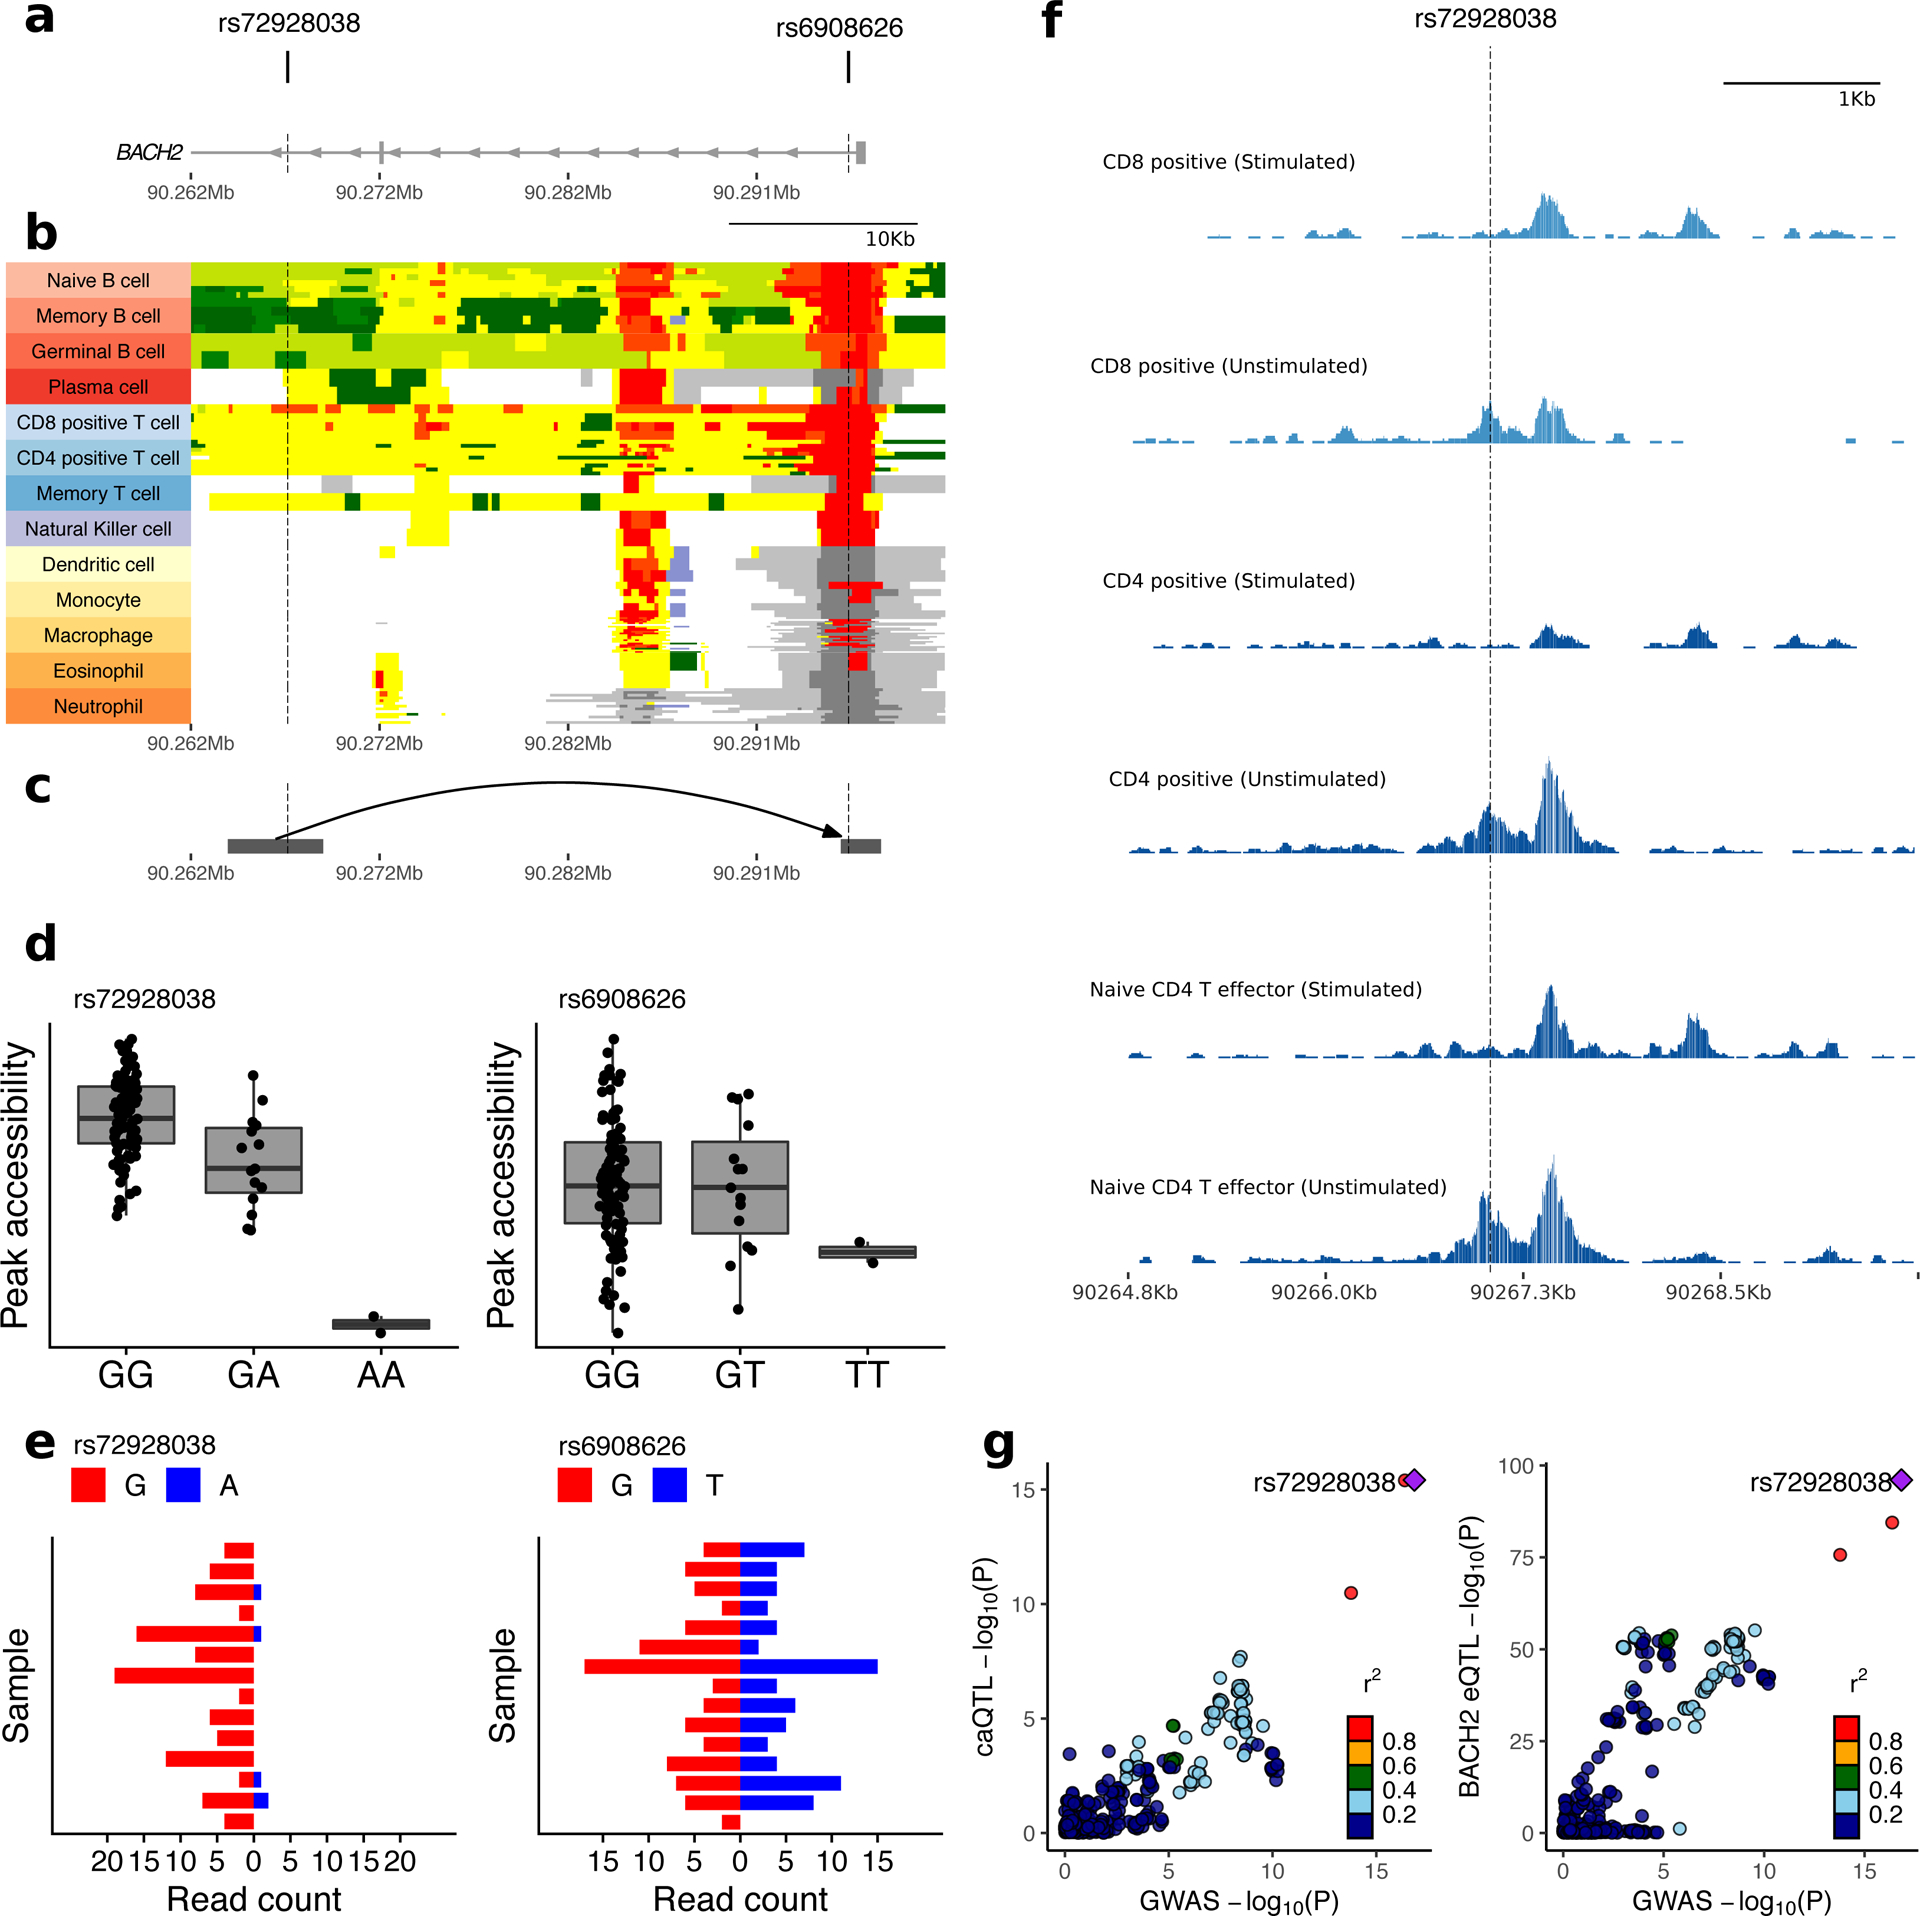
We report the largest and most diverse genetic study of type 1 diabetes (T1D) to date (61,427 participants), yielding 78 genome-wide-significant (P < 5 × 10⁻⁸) regions, including 36 that are new. We define credible sets of T1D-associated variants and show that they are enriched in immune-cell accessible chromatin, particularly CD4+ effector T cells. Using chromatin-accessibility profiling of CD4+ T cells from 115 individuals, we map chromatin-accessibility quantitative trait loci and identify five regions where T1D risk variants co-localize with chromatin-accessibility quantitative trait loci. We highlight rs72928038 in BACH2 as a candidate causal T1D variant leading to decreased enhancer accessibility and BACH2 expression in T cells. Finally, we prioritize potential drug targets by integrating genetic evidence, functional genomic maps and immune protein-protein interactions, identifying 12 genes implicated in T1D that have been targeted in clinical trials for autoimmune diseases. These findings provide an expanded genomic landscape for T1D.
© 2021. Crown.
Conflict of interest statement
Competing Interests statement
No authors have any competing interests to declare.
Figures
Comment in
-
The largest study of genetics of T1DM.Nat Rev Endocrinol. 2021 Sep;17(9):515. doi: 10.1038/s41574-021-00532-y. Nat Rev Endocrinol. 2021. PMID: 34194009 No abstract available.
References
Methods-only References
-
- Marchini J & Howie B Genotype imputation for genome-wide association studies. Nat. Rev. Genet 11, 499–511 (2010). - PubMed
Publication types
MeSH terms
Grants and funding
- U01 DK061010/DK/NIDDK NIH HHS/United States
- U18 DP002710/DP/NCCDPHP CDC HHS/United States
- DP3 DK111906/DK/NIDDK NIH HHS/United States
- U18 DP002714/DP/NCCDPHP CDC HHS/United States
- U01 DK127404/DK/NIDDK NIH HHS/United States
- U01 DK061036/DK/NIDDK NIH HHS/United States
- U18 DP002709/DP/NCCDPHP CDC HHS/United States
- U01 DK061042/DK/NIDDK NIH HHS/United States
- U01 DK085509/DK/NIDDK NIH HHS/United States
- R01 DK032493/DK/NIDDK NIH HHS/United States
- HIR 10-001/HX/HSRD VA/United States
- G1001799/MRC_/Medical Research Council/United Kingdom
- UL1 TR003096/TR/NCATS NIH HHS/United States
- P01 AI042288/AI/NIAID NIH HHS/United States
- R01 HL120393/HL/NHLBI NIH HHS/United States
- 203141/WT_/Wellcome Trust/United Kingdom
- N01AR62278/HL/NHLBI NIH HHS/United States
- U01 DP000247/DP/NCCDPHP CDC HHS/United States
- U01 DK061040/DK/NIDDK NIH HHS/United States
- R01 DK116954/DK/NIDDK NIH HHS/United States
- N01AR02247/AR/NIAMS NIH HHS/United States
- U01 DK085466/DK/NIDDK NIH HHS/United States
- 095219/WT_/Wellcome Trust/United Kingdom
- U01 DK061058/DK/NIDDK NIH HHS/United States
- U01 DK085505/DK/NIDDK NIH HHS/United States
- U01 DK085453/DK/NIDDK NIH HHS/United States
- DH_/Department of Health/United Kingdom
- UL1 TR000154/TR/NCATS NIH HHS/United States
- U01 DP000248/DP/NCCDPHP CDC HHS/United States
- U01 DK085499/DK/NIDDK NIH HHS/United States
- U01 DK085463/DK/NIDDK NIH HHS/United States
- R01 DK115694/DK/NIDDK NIH HHS/United States
- T32 LM012416/LM/NLM NIH HHS/United States
- U01 DP000244/DP/NCCDPHP CDC HHS/United States
- P30 DK116073/DK/NIDDK NIH HHS/United States
- U01 DK062418/DK/NIDDK NIH HHS/United States
- U01 DK061055/DK/NIDDK NIH HHS/United States
- HHSN268201800001C/HL/NHLBI NIH HHS/United States
- UM1 HG008853/HG/NHGRI NIH HHS/United States
- U01 DK103282/DK/NIDDK NIH HHS/United States
- 107212/WT_/Wellcome Trust/United Kingdom
- U01 DK061034/DK/NIDDK NIH HHS/United States
- U01 DK085461/DK/NIDDK NIH HHS/United States
- UL1 TR001417/TR/NCATS NIH HHS/United States
- R01 DK127208/DK/NIDDK NIH HHS/United States
- U01 DK061041/DK/NIDDK NIH HHS/United States
- R01 HL117626/HL/NHLBI NIH HHS/United States
- U01 DP000250/DP/NCCDPHP CDC HHS/United States
- P01 AR049084/AR/NIAMS NIH HHS/United States
- U01 DP000246/DP/NCCDPHP CDC HHS/United States
- U01 DP000254/DP/NCCDPHP CDC HHS/United States
- U18 DP002708/DP/NCCDPHP CDC HHS/United States
- 108439/WT_/Wellcome Trust/United Kingdom
LinkOut - more resources
Full Text Sources
Medical
Molecular Biology Databases
Research Materials
