

Measurements of exhaled airflow velocity through human coughs using particle image velocimetry
- PMID: 34127875
- PMCID: PMC8188782
- DOI: 10.1016/j.buildenv.2021.108020
Measurements of exhaled airflow velocity through human coughs using particle image velocimetry
Abstract
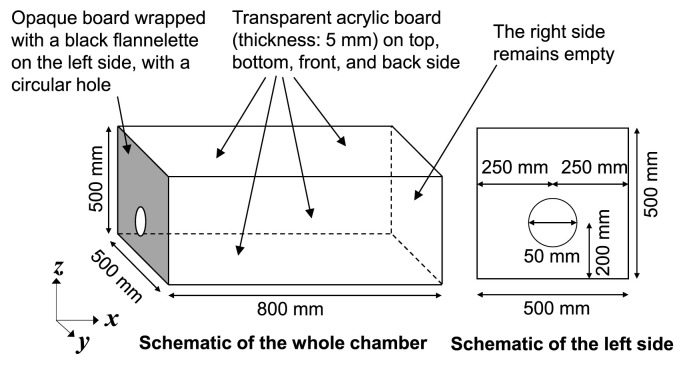
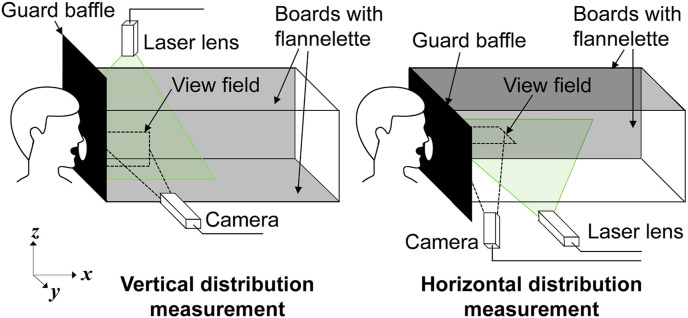
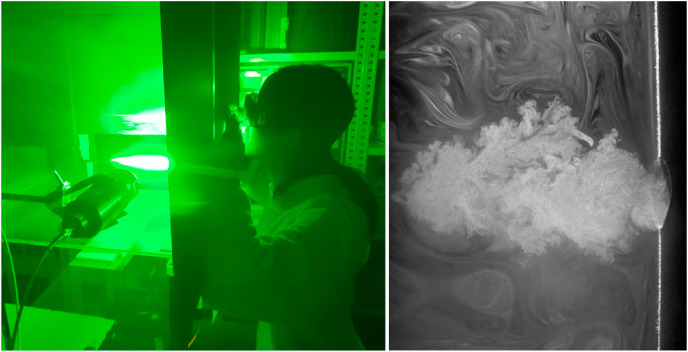
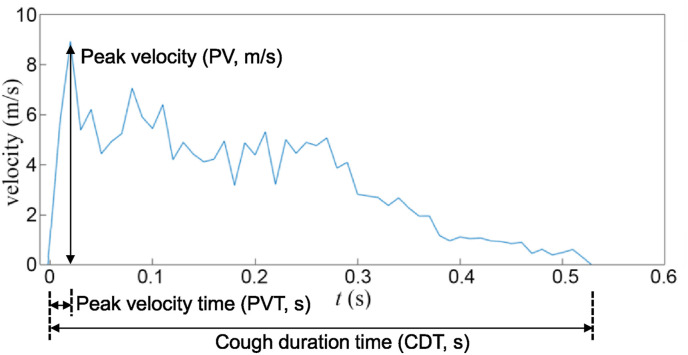
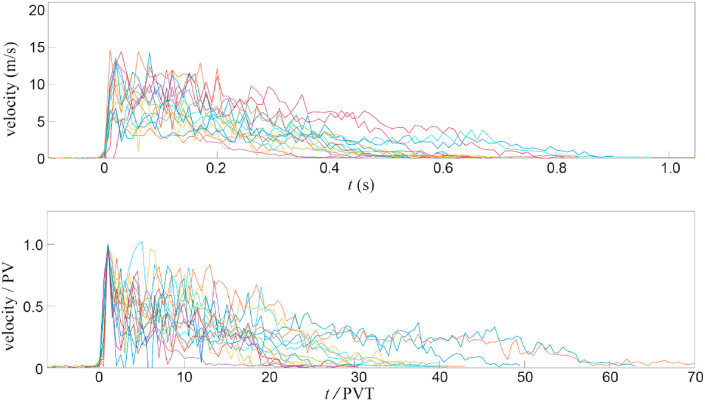
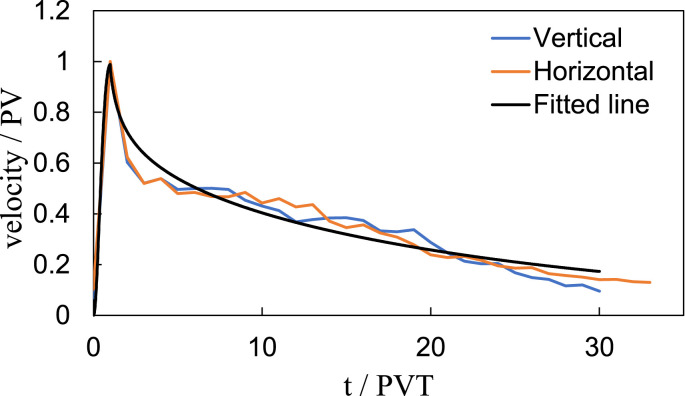
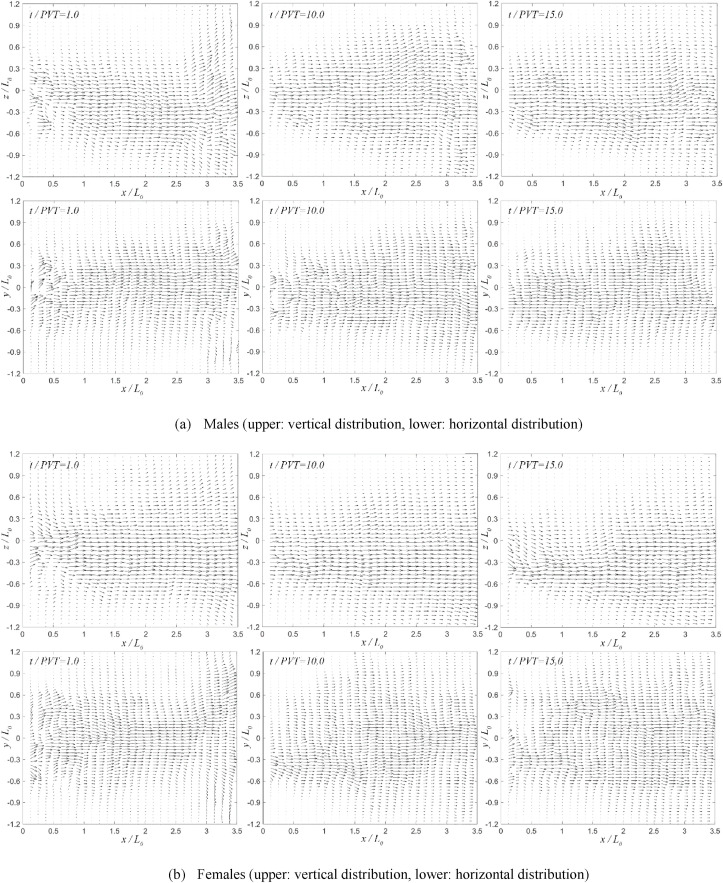
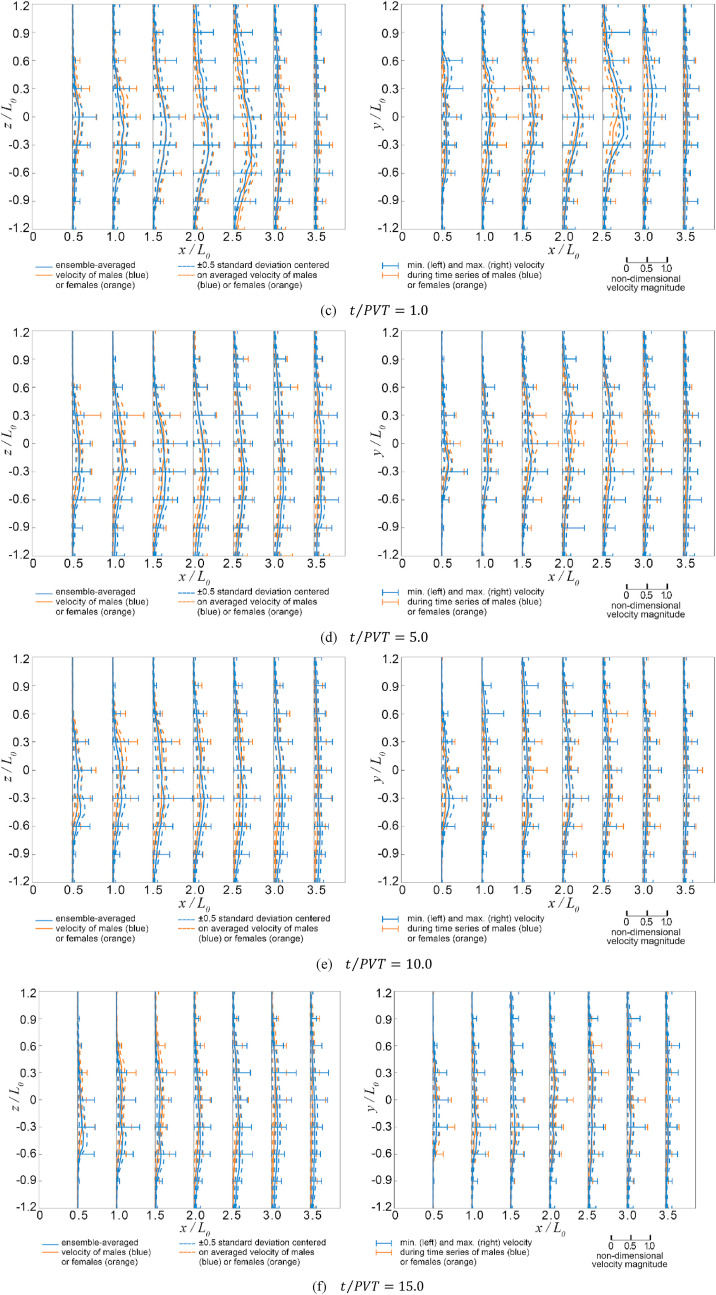
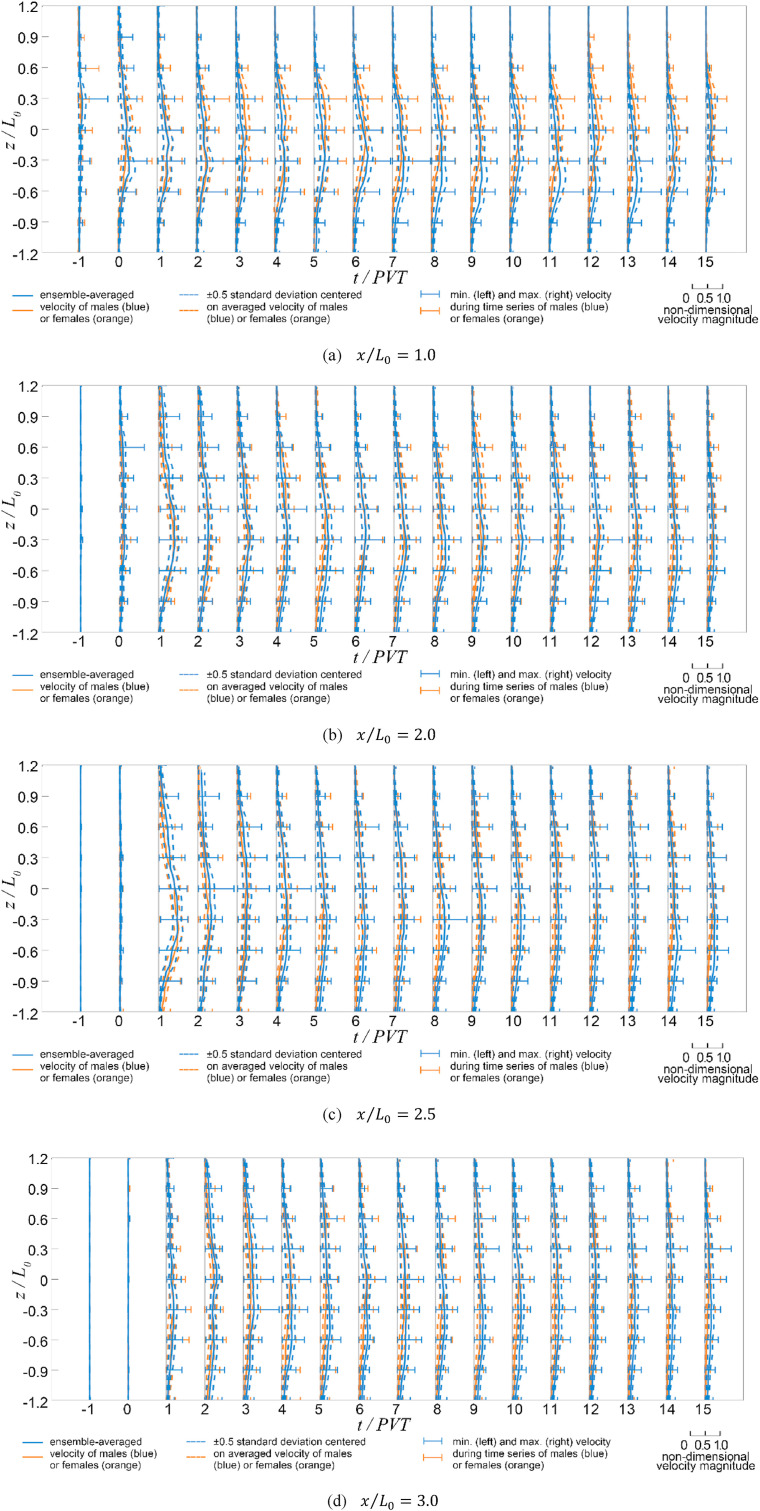
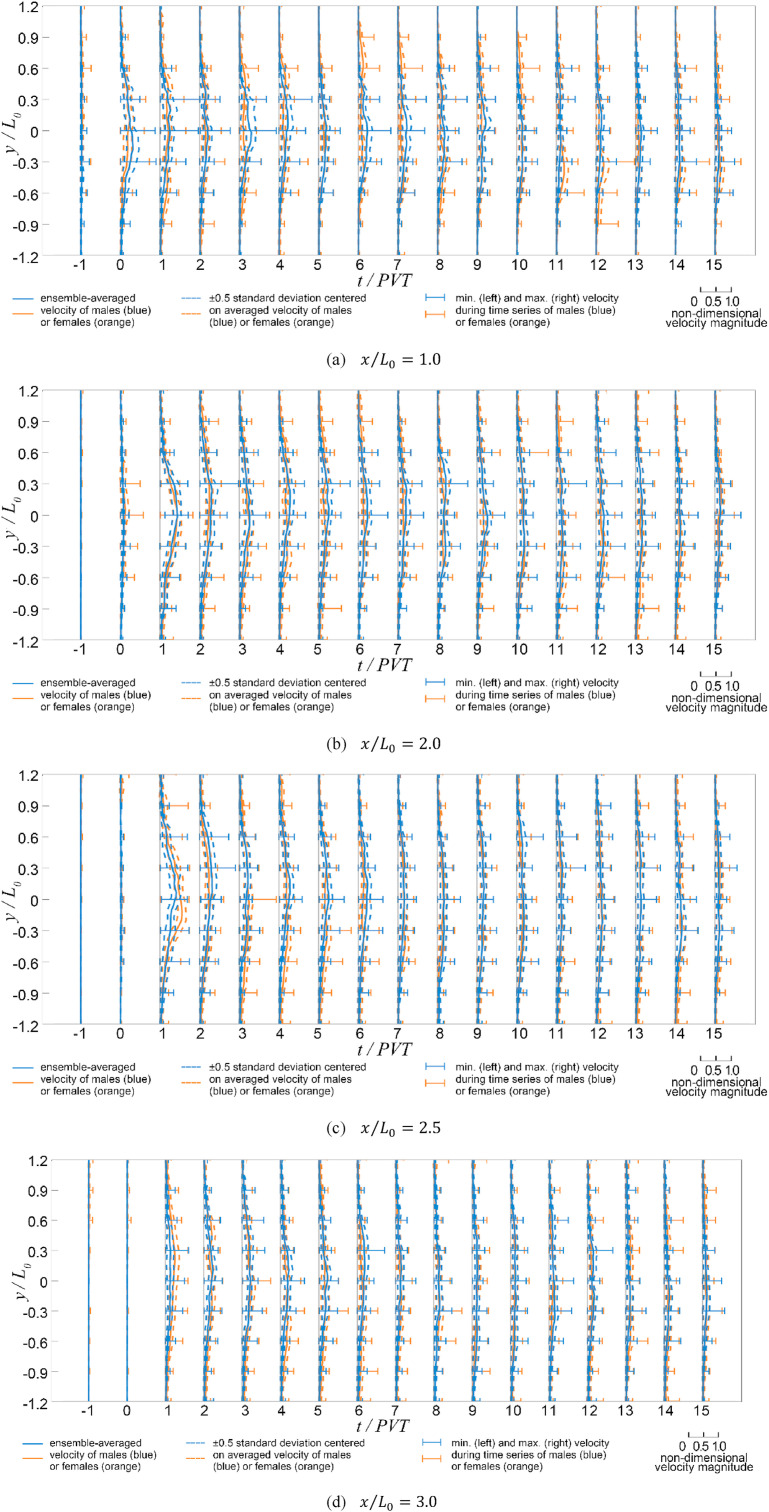
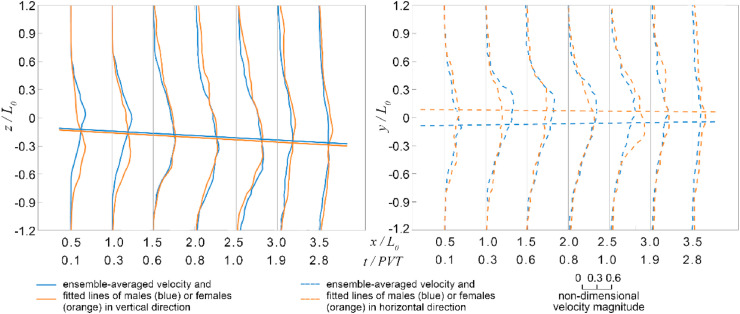
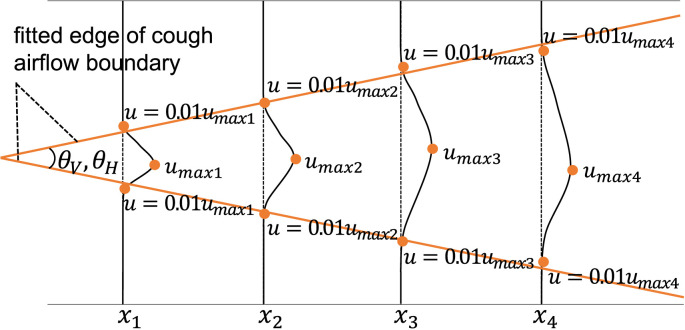
The sudden outbreak of coronavirus (COVID-19) has infected over 100 million people and led to over two million deaths (data in January 2021), posing a significant threat to global human health. As a potential carrier of the novel coronavirus, the exhaled airflow of infected individuals through coughs is significant in virus transmission. The research of detailed airflow characteristics and velocity distributions is insufficient because most previous studies utilize particle image velocimetry (PIV) with low frequency. This study measured the airflow velocity of human coughs in a chamber using PIV with high frequency (interval: 1/2986 s) to provide a detailed validation database for droplet propagation CFD simulation. Sixty cough cases for ten young healthy nonsmoking volunteers (five males and five females) were analyzed. Ensemble-average operations were conducted to eliminate individual variations. Vertical and horizontal velocity distributions were measured around the mouth area. Overall cough characteristics such as cough duration time (CDT), peak velocity time (PVT), maximum velocities, and cough spread angle were obtained. The CDT of the cough airflow was 520-560 m s, while PVT was 20 m s. The male/female averaged maximum velocities were 15.2/13.1 m/s. The average vertical/horizontal cough spread angle was 15.3°/13.3° for males and 15.6°/14.2° for females. In addition, the spatial and temporal distributions of ensemble-averaged velocity profiles were obtained in the vertical and horizontal directions. The experimental data can provide a detailed validation database the basis for further study on the influence of cough airflow on virus transmission using computational fluid dynamic simulations.
Keywords: Cough; Cough duration time; Cough spread angle; Particle image velocimetry; Peak velocity time; Velocity profile.
© 2021 Elsevier Ltd. All rights reserved.
Conflict of interest statement
The authors declare that they have no known competing financial interests or personal relationships that could have appeared to influence the work reported in this paper.
Figures

Similar articles
-
Experimental measurements of airflow features and velocity distribution exhaled from sneeze and speech using particle image velocimetry.Build Environ. 2021 Nov;205:108293. doi: 10.1016/j.buildenv.2021.108293. Epub 2021 Aug 26. Build Environ. 2021. PMID: 34908645 Free PMC article.
-
Experimental investigation of far-field human cough airflows from healthy and influenza-infected subjects.Indoor Air. 2020 Sep;30(5):966-977. doi: 10.1111/ina.12680. Epub 2020 May 4. Indoor Air. 2020. PMID: 32304605 Free PMC article.
-
Study on the initial velocity distribution of exhaled air from coughing and speaking.Chemosphere. 2012 Jun;87(11):1260-4. doi: 10.1016/j.chemosphere.2012.01.032. Epub 2012 Feb 18. Chemosphere. 2012. PMID: 22342283 Free PMC article.
-
A review on the applied techniques of exhaled airflow and droplets characterization.Indoor Air. 2021 Jan;31(1):7-25. doi: 10.1111/ina.12770. Epub 2020 Dec 28. Indoor Air. 2021. PMID: 33206424 Free PMC article. Review.
-
Digital particle image velocimetry studies of nasal airflow.Respir Physiol Neurobiol. 2008 Nov 30;163(1-3):111-20. doi: 10.1016/j.resp.2008.07.023. Epub 2008 Aug 5. Respir Physiol Neurobiol. 2008. PMID: 18755301 Review.
Cited by
-
Recent research on expiratory particles in respiratory viral infection and control strategies: A review.Sustain Cities Soc. 2021 Oct;73:103106. doi: 10.1016/j.scs.2021.103106. Epub 2021 Jun 18. Sustain Cities Soc. 2021. PMID: 34306994 Free PMC article. Review.
-
Flow dynamics of droplets expelled during sneezing.Phys Fluids (1994). 2021 Nov;33(11):111901. doi: 10.1063/5.0067609. Epub 2021 Nov 2. Phys Fluids (1994). 2021. PMID: 34803362 Free PMC article.
-
Bioaerosol distribution characteristics and potential SARS-CoV-2 infection risk in a multi-compartment dental clinic.Build Environ. 2022 Nov;225:109624. doi: 10.1016/j.buildenv.2022.109624. Epub 2022 Sep 22. Build Environ. 2022. PMID: 36164582 Free PMC article.
-
A New Method Proposed for Analyzing Airflow Dynamics in Negative Pressure Isolation Chambers Using Particle Image Velocimetry.Bioengineering (Basel). 2025 Mar 17;12(3):302. doi: 10.3390/bioengineering12030302. Bioengineering (Basel). 2025. PMID: 40150766 Free PMC article.
-
Mechanisms controlling the transport and evaporation of human exhaled respiratory droplets containing the severe acute respiratory syndrome coronavirus: a review.Environ Chem Lett. 2023;21(3):1701-1727. doi: 10.1007/s10311-023-01579-1. Epub 2023 Feb 22. Environ Chem Lett. 2023. PMID: 36846189 Free PMC article. Review.
References
-
- Who Department of Communicable Disease Surveillance and Response . SARS; 2004. WHO Guidelines for the Global Surveillance of Severe Acute Respiratory Syndrome.
-
- World Health Organisation . 2010. Pandemic (H1N1) 2009 - Update 112 (2010-08-06)http://www.who.int/csr/don/2010_08_06/en/index.html
-
- World Health Organization . 2015. Case Definition for Reporting to WHO Middle East Respiratory Syndrome Coronavirus Interim Case Definition 14 July 2015.http://www.who.int/csr/disease/coronavirus_infections/mers_cov_interim_c...
LinkOut - more resources
Full Text Sources
Research Materials
Miscellaneous